Public Hospitals: Results of the 2011–12 Audits
Overview
This report covers the results of the financial audits of 113 entities within the public hospital sector, comprising 87 public hospitals and the 26 entities they control. It informs Parliament about significant issues arising from the audits and complements the assurance provided through audit opinions included in the entities’ annual reports.
The report recommends that public hospitals assess their policies and procedures against the commonly identified control weaknesses, and that comprehensive policies and procedures over capital projects and self-generated revenue be developed and regularly reviewed.
Public Hospitals: Results of the 2011–12 Audits: Message
Ordered to be printed
VICTORIAN GOVERNMENT PRINTER November 2012
PP No 193, Session 2010–12
President
Legislative Council
Parliament House
Melbourne
Speaker
Legislative Assembly
Parliament House
Melbourne
Dear Presiding Officers
Under the provisions of section 16AB of the Audit Act 1994, I transmit my report on Public Hospitals: Results of the 2011–12 Audits.
Yours faithfully

D D R PEARSON
Auditor-General
14 November 2012
Audit summary
This report presents the results of our financial audits of 113 entities within the public hospital sector, comprising 87 public hospitals and 26 associated entities. It provides a detailed analysis of public hospital financial reporting, financial results, financial sustainability and internal controls. It informs Parliament about significant issues arising from the audits and complements the assurance provided through individual audit opinions included in the entities’ annual reports.
Clear audit opinions were issued on 111 public hospital and associated entities’ financial reports for the financial year-ended 30 June 2012. At 31 October 2012, the audits of two associated entities were outstanding.
Conclusion
Notwithstanding some opportunities for improvement, Parliament can have confidence in the adequacy of financial reporting and the internal controls of the entities audited.
Findings
Financial results and sustainability
The combined operating result for all hospitals improved from a deficit of $102 million in 2010–11 to a deficit of $43 million in 2011–12, predominantly due to sector-wide cost containment measures and increased government funding.
The overall risk to financial sustainability for the public hospital sector was assessed as medium, consistent with 2010–11. Eighty of the 87 hospitals (92 per cent) had an assessment of either medium or high generally because of low cash reserves and a limited ability to fund long-term debt. In order to report as a going concern, 31 public hospitals (29 in 2010–11) relied on a ‘letter of support’ stating that the Department of Health would provide adequate cash flows to enable each hospital to meet their obligations if required.
Hospitals remain heavily reliant on government funding to maintain their operations. The Department of Health has not acted to address aspects of the funding model that limit the ability of governing boards to make decisions around asset maintenance and replacement. As a result the ability for governing boards to fulfil their legislative responsibilities for stewardship in the sector remains limited.
The National Health Reform Agreement which gives greater control for funding of the sector to the Commonwealth Government came into operation on 1 July 2012. The agreement has the potential to affect financial results going forward. However, the full effect is not yet certain.
Internal controls
Overall, public hospital internal controls were adequate for producing reliable, accurate and timely financial reports. Nevertheless, a number of common areas for improvement were identified. Public hospitals require adequate internal controls for financial reporting purposes to assist with the efficiency and effectiveness of their operations, and to comply with relevant laws and regulations. As part of our annual assessment of internal controls we focused on controls relating to audit committees, capital project management and self-generated revenue.
The effective structure and operation of audit committees is critical to the ongoing governance of hospitals. We found that all hospitals had a current audit committee in place. Generally, metropolitan and regional hospitals had more comprehensive charters and controls than rural hospitals. Opportunities for improvement include the regular rotation of members and maintenance of the requisite knowledge and skills of committee members.
Capital project management procedures at public hospitals were generally adequate. However, there is opportunity to improve the use of internal audit to review capital project arrangements and to increase the practice of conducting post project evaluations to drive continuous improvement.
To assist in funding their operations, public hospitals are under increasing pressure to provide self-generated revenue from sources such as commercial diagnostic services, cafeteria services, facility fees paid by private practitioners and car parking fees. Around 95 per cent of all public hospitals generate income from non-public hospital sources. The total of this income was approximately $1.4 billion in 2011–12. Monitoring and reporting on these types of income sources was effective, however, hospitals need to develop clear policies for these revenue sources and hospital boards need to provide guidance on acceptable sources of self-generated revenue.
Recommendations
That public hospitals:
- continue to review and further refine their financial reporting processes including the establishment of financial report preparation plans and the timely preparation of shell financial statements
- assess policies and practices against the identified general internal control weaknesses to determine the adequacy of their controls, and whether they are operating reliably, efficiently and effectively
- address instances of noncompliance of audit committee composition with the Minister for Finance’s Standing Directions
- develop capital project management policies tailored to the scope and size of their capital expenditure programs and submit them to the board for approval and regular review
- develop policies for self-generated revenue and submit them to the board for approval and regular review
- set and report against key capital project milestones and key performance indicators regularly to the board
- conduct and distribute post-project evaluations in order to facilitate improvements in processes
- enhance use of internal audit, to review capital project and self-generated revenue policies, procedures and practices.
Submissions and comments received
In addition to progressive engagement during the course of the audit, in accordance with section 16(3) of the Audit Act 1994, a copy of this report, or relevant extracts from the report, was provided to the Department of Health and named hospitals with a request for comments or submissions.
Their views have been considered in reaching our audit conclusions and are represented to the extent relevant and warranted in preparing this report. Their full section 16(3) comments and submissions, however, are included in Appendix E.
1 Background
1.1 Introduction
Public hospitals provide a range of services across metropolitan, regional and rural areas. Metropolitan and regional public hospitals largely provide acute health services, as well as a mix of mental health, subacute, community health services and aged care programs. Rural public hospitals generally offer a higher proportion of aged care and community health services.
This report includes the results of the financial audits of 87 Victorian public hospitals and their 26 associated entities, as set out in Figure 1A.
Figure 1A
Public hospitals and controlled entities
Hospital category |
2012 |
2011 |
|---|---|---|
Metropolitan |
||
Public hospitals |
18 |
18 |
Entities controlled by public hospitals(a) |
16 |
14 |
Other associated entities(b) |
2 |
2 |
Regional |
||
Public hospitals |
15 |
15 |
Entities controlled by public hospitals(a) |
2 |
2 |
Rural |
||
Public hospitals |
54 |
54 |
Entities controlled by public hospitals(a) |
5 |
6 |
Other associated entities(b) |
1 |
1 |
Total |
113 |
112 |
(a) Entities controlled by public hospitals generally comprise foundations and trusts.
(b) Other associated entities are not directly controlled by a public hospital and generally comprise joint ventures or unrelated not-for-profit entities.
Source: Victorian Auditor-General’s Office.
Figure 1A shows that there have been minor changes to the entities reported last financial year. The changes include the winding up of two rural subsidiary entities during the year and the establishment of three new metropolitan subsidiary entities this year.
This report informs Parliament about significant issues arising from the financial audits of the public hospital sector and complements the assurance provided through audit opinions on the financial statements included in the respective entities’ annual reports.
The report comments on various aspects including:
- the quality and timeliness of financial reporting across the sector
- the financial results of public hospitals for the 2011–12 financial year
- the financial sustainability of public hospitals
- the effectiveness of public hospital audit committees
- the effectiveness of public hospital capital project management practices
- issues relating to self-generated non-public hospital revenue.
This is the second of six reports to be presented to Parliament during 2012–13 covering the results of financial audits. The reports in this series are outlined in Appendix A.
1.2 Financial audit framework
1.2.1 Audit of financial reports
An annual financial audit of a public hospital has two aims:
- to give an opinion consistent with section 9 of the Audit Act 1994, on whether the financial report is fairly stated
- to consider whether there has been wastage of public resources or a lack of probity or financial prudence in the management or application of public resources, consistent with section 3A(2) of the Audit Act 1994.
The financial audit framework applied in the conduct of the 2011–12 audits is set out in Figure 1B.
Figure 1B
Financial audit framework
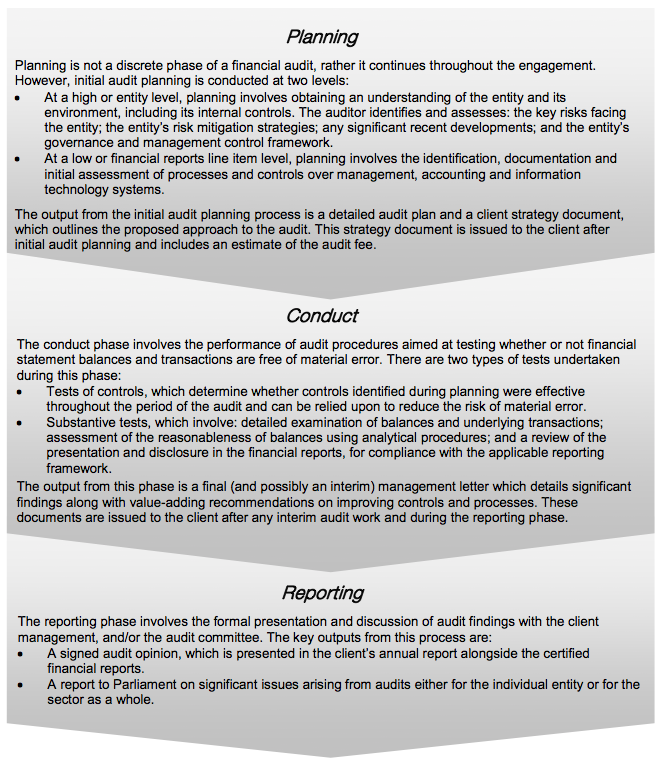
Source: Victorian Auditor-General’s Office.
1.2.2 Audit of internal controls
An entity’s governing body is responsible for developing and maintaining its internal control framework. Internal controls are systems, policies and procedures that help an entity reliably and cost effectively meet its objectives. Sound internal controls enable the delivery of reliable, accurate and timely reporting.
Figure 1C identifies the main components of an effective internal control framework.
Figure 1C
Components of an effective internal control framework
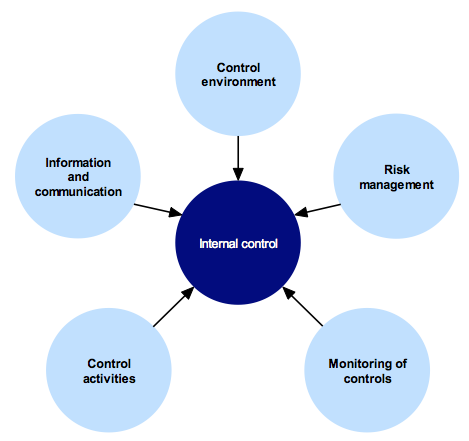
Source: Victorian Auditor-General’s Office.
In the diagram:
- the control environment provides the fundamental discipline and structure for the controls and includes governance and management functions and the attitudes, awareness and actions of those charged with governance and management of an entity
- risk management involves identifying, analysing and mitigating risks
- monitoring of controls involves observing the internal controls in practice and assessing their effectiveness
- control activities are policies, procedures and practices used by management to help meet an entity’s objectives
- information and communication involves communicating control responsibilities throughout the entity and providing information in a form and time frame that allows officers to discharge their responsibilities.
The annual financial audit enables the Auditor-General to form an opinion on an entity’s financial report. An integral part of this, and a requirement of Australian Auditing Standard 315 Identifying and Assessing the Risks of Material Misstatement through Understanding the Entity and Its Environment, is to assess the adequacy of an entity’s internal control framework and governance processes related to its financial reporting.
Internal control weaknesses identified during an audit do not usually result in a ‘qualified’ audit opinion. A qualification is usually warranted only if weaknesses cause significant uncertainty about the accuracy, completeness and reliability of the financial information being reported. Often, an entity will have compensating controls that mitigate the risk of a material error in the financial report.
Weaknesses we find during an audit are brought to the attention of an entity’s chairperson, chief executive officer and audit committee by way of a management letter.
Section 16 of the Audit Act 1994 empowers the Auditor-General to report to Parliament on the results of audits.
This report includes the results of our review of internal controls related to the financial reporting responsibilities of the public hospital sector.
1.3 Audit conduct
Audits of public hospitals were undertaken in accordance with Australian Auditing Standards.
The total cost of preparing and printing this report was $205 000.
1.4 Structure of this report
The structure of this report and details covered in each Part are set out in Figure 1D.
Figure 1D
Report structure
Part |
Description |
|---|---|
Part 2: Audit opinions and quality of reporting |
Covers the results of the audits of the 2011–12 financial reports of the 87 public hospitals and their 26 associated entities. It comments on the timeliness and accuracy of their financial reporting and compares practices in 2011–12 against better practice and past performance. |
Part 3: Financial results |
Illustrates the financial results of 87 public hospitals, including financial performance for 2011–12 and financial position at 30 June 2012. |
Part 4: Financial sustainability |
Provides insight into the financial sustainability of the 87 public hospitals, analysing the trends in financial sustainability indicators over a five-year period. |
Part 5: Internal controls |
Summarises the control weaknesses commonly identified for the 87 hospitals for the year-ended 30 June 2012. It also comments on the effectiveness of audit committees and the control procedures around capital project management and self-generated revenue. |
2 Audit opinions and quality of reporting
At a glance
Background
Independent audit opinions add credibility to financial reports by providing reasonable assurance that the information reported is reliable. The quality of an entity’s reporting can be measured by the timeliness and accuracy of the preparation of the reports. This Part covers the results of the 2011–12 audits of the 87 public hospitals and their 26 associated entities. It also compares financial reporting practices in 2011–12 against better practice, legislated time lines and 2010–11 performance.
Conclusion
Parliament can have confidence in the financial reports as all 111 completed audits were given clear audit opinions.
Overall, the financial report preparation processes of public hospitals and their associated entities were adequate. They produced accurate, complete and reliable information. However, opportunities for improvement have been identified.
Findings
- At 31 October 2012, clear audit opinions had been issued on 111 public hospitals and associated entities’ financial reports for the year-ended 30 June 2012—this included all 87 public hospitals.
- At 31 October 2012 the audits of two associated entities were outstanding.
- Compared with 2010–11, the timeliness of financial reporting in 2011–12 decreased slightly, however, was still within legislated time lines.
Recommendation
That public hospitals continue to review and further refine their financial reporting processes including the establishment of financial report preparation plans and the timely preparation of shell financial statements.
2.1 Introduction
This Part covers the results from the audits of 87 public hospitals and 26 associated entities for 2011–12.
2.2 Reporting framework
2.2.1 Financial reporting
Each of the audited entities must prepare its financial report in accordance with Australian Accounting Standards, including the Australian Accounting Interpretations.
The principal legislation governing financial reporting by public hospitals is the Financial Management Act 1994 (FMA) and the Corporations Act 2001. Figure 2A shows the legislative framework for each type of entity, and Appendix B provides details of the legislative framework for each entity.
Figure 2A
Legislative framework for public hospitals and associated entities
|
Legislative framework |
Public hospitals |
Entities controlled by public hospitals |
Other associated entities |
Total |
|---|---|---|---|---|
|
Financial Management Act 1994 |
85 |
8 |
1 |
94 |
|
Corporations Act 2001 |
2 |
13 |
2 |
17 |
|
No applicable legislative framework |
– |
2 |
- |
2 |
|
Total |
87 |
23 |
3 |
113 |
Source: Victorian Auditor-General’s Office.
2.3 Audit opinions issued
At 31 October 2012, clear audit opinions had been issued on the financial statements of 111 public hospitals and their associated entities for the year-ended 30 June 2012. The audits of two entities were still to be finalised.
Independent audit opinions add credibility to financial reports by providing reasonable assurance that the information reported is reliable and accurate. A ‘clear’ audit opinion confirms that the financial statements present fairly the transactions and balances for the reporting period, in accordance with the requirements of relevant accounting standards and legislation.
2.4 Quality of reporting
The quality of an entity’s financial reporting can be measured by the timeliness and accuracy of the preparation and finalisation of its financial report. Overall, the financial report preparation processes of public hospitals produced accurate, complete and reliable information in a timely manner.
Figure 2B shows that the overall quality of financial reporting in 2011–12 for hospitals showed some improvement over the previous year. The quality of reporting for controlled and other entities was substantially the same as for 2010–11.
Figure 2B
Quality of financial reporting in 2011–12
|
Quality of financial reporting |
Public hospitals |
Entities controlled by public hospitals |
Other associated entities |
All entities |
|---|---|---|---|---|
|
Improved from previous year |
17 |
0 |
0 |
17 |
|
Same as previous year |
68 |
20 |
3 |
91 |
|
Worse than previous year |
2 |
0 |
0 |
2 |
|
Total (a) |
87 |
20 |
3 |
110 |
(a) Three entities were added in 2011–12 and therefore could not be compared to the previous year.
Source: Victorian Auditor-General’s Office.
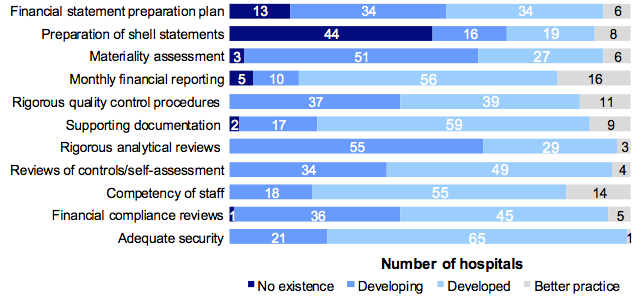
An assessment was conducted against the better practice elements detailed in Figure 2C. The better practice elements are designed to assist public hospitals to produce complete, accurate and compliant financial reports within the legislative time frame.
Figure 2C
Selected better practice: Financial report preparation
|
Key area |
Better practice |
|---|---|
|
Financial report preparation plan |
Establish a plan that outlines the processes, resources, milestones, oversight and quality assurance practices required in preparing the financial report. |
|
Preparation of shell statements |
Prepare a shell financial report and provide it early to the auditors to enable early identification of amendments, minimising the need for significant disclosure changes at year end. |
|
Materiality assessment |
Assess materiality, including quantitative and qualitative thresholds, at the planning phase in consultation with the audit committee. The assessment assists preparers in identifying potential errors in the financial report. |
|
Monthly financial reporting |
Adopt full accrual monthly reporting to assist in preparing the annual financial report. This allows for the year-end process to be an extension of the month-end process. |
|
Rigorous quality control and assurance procedures |
Require review of the supporting documentation, data and the financial report itself by an appropriately experienced and independent officer prior to providing it to the auditors. |
|
Supporting documentation |
Prepare high standard documentation to support and validate the financial report, and provide a management trail. |
|
Rigorous analytical reviews |
Undertake rigorous and objective analytical review during the financial report preparation process to help improve the accuracy of the report. |
|
Reviews of controls / self-assessment |
Establish sufficiently robust quality control and assurance processes to provide assurance to the audit committee on the accuracy and completeness of the financial report. |
|
Competency of staff |
Require preparers of the financial report to have a good understanding of, and experience in, applying relevant accounting standards and legislation. |
|
Financial compliance reviews |
Undertake periodic compliance reviews to identify areas of noncompliance or changes to legislation that impact the financial report. |
|
Adequate security |
Protect and safeguard sensitive information throughout the process to prevent inappropriate public disclosure. |
Source: Victorian Auditor-General’s Office and Australian National Audit Office Better Practice Guide: Preparation of Financial Statements, Canberra: 2009.
The assessment of the overall quality of financial reporting was conducted against better practice criteria using the following scale:
- no existence—function not conducted by the entity
- developing—partially encompassed in the entity’s financial reporting preparation processes
- developed—entity has implemented the process, however, it is not fully effective or efficient
- better practice—entity has implemented the processes which are effective and efficient.
The results of our assessment are summarised in Figure 2D.
Figure 2D
Results of assessment of report preparation processes against better practice elements
Source: Victorian Auditor-General’s Office.
The better practice elements that were considered to be well implemented across the sector included:
- monthly financial reporting
- competency of staff
- maintenance of supporting documentation.
However, further improvement is needed in:
- preparing and providing timely shell financial statements to auditors to enable issues to be identified and resolved earlier (not performed at 44 hospitals)
- establishing financial report preparation plans outlining the processes, resources, milestones and quality assurance practices required (none in place for 13 hospitals).
Improving these areas will assist the timely preparation of quality financial reports and the early detection and correction of errors. Overall the sector’s performance improved in 2011–12 against better practice elements.
2.5 Timeliness of reporting
Financial reports provide accountability for the use of public money, and so it is important that entities prepare and publish their financial information on a timely basis. The later the reports are published, the less useful they are for stakeholders and decision-making.
The FMA requires an entity to submit its annual report, including financial reports for the entity and any of its controlled entities, to its minister. The annual report is to be prepared and financial statements audited within 12 weeks of the end of the financial year, and tabled in Parliament within four months of the end of the financial year.
The Corporations Act 2001 requires entities to report to their members within four months of the end of the financial year. The need to consolidate the results of controlled entities into their parent entity’s financial report means that controlled entities reporting under the Corporations Act 2001 are, in effect, also required to report within 12 weeks of the end of the financial year.
Figure 2E summarises the legislated reporting time frames.
Figure 2E
Legislative reporting time frames
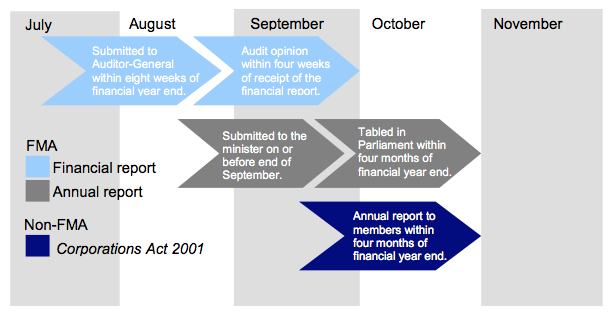
Source: Victorian Auditor-General’s Office.
The 2011–12 reporting time lines were consistent with those for the previous two years.
Figure 2F shows the average time taken by public hospitals to finalise their 2011–12 financial reports.
Figure 2F
Average time to finalise financial reports
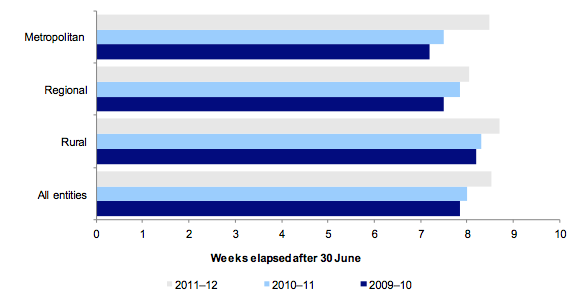
Source: Victorian Auditor-General’s Office.
The average time taken across all hospitals increased from 8 weeks in 2010–11 to 8.5 in 2011–12. This increase was in line with the time frame set by the Department of Treasury and Finance for 2011–12.
All public hospitals completed their financial reports within target dates set by the Department of Treasury and Finance. The two financial audits not completed by 31 October 2012 were associated entities of public hospitals.
2.6 Accuracy of reporting
The number and size of errors in draft financial statements requiring adjustment are direct measures of the accuracy of the drafts. Ideally, there should be no errors or adjustments required as a result of the audit process.
When the audit process detects errors in the draft financial statements they are raised with management. Material errors need to be corrected before a clear audit opinion can be issued. The entity itself may change its draft statements after submitting them for audit, if their internal procedures find that the draft statements are incorrect or incomplete.
Generally, there are two types of adjustments to draft financial statements:
- financial balance adjustments—being changes to the balances reported
- disclosure adjustments—being changes to the commentary or financial note disclosures within the financial statements.
The nature of the material financial balance and disclosure adjustments noted during the 2011–12 audits of hospitals and their associated entities were:
- revenue/receivables—adjustments to revenue recognised where entities had either incorrectly classified revenue items or had accounted for revenue in the wrong year
- financial instrument disclosures—adjustments to financial instrument disclosures where disclosures were incomplete or incorrect
- employee benefits provisions—adjustments across most employee benefit provisions generally due to enterprise bargaining agreement updates; incorrect application of on-costs, bond rates, wage inflation and probability factors on long service leave calculations; and the incorrect split of provisions between current and non-current liabilities
- executive remuneration—adjustments of errors in the note disclosures relating to executive remuneration. Common errors included not accounting for all relevant staff, classifying executives in the incorrect income brackets, miscalculating full time employee equivalents and understating executive remuneration totals.
All adjustments were made prior to the completion of the financial reports.
Recommendation
1. That public hospitals continue to review and further refine their financial reporting processes including the establishment of financial report preparation plans and the timely preparation of shell financial statements.
3 Financial results
At a glance
Background
Accrual-based financial statements enable an assessment of whether public hospitals are generating sufficient surpluses from operations to maintain services, fund asset maintenance and retire debt.
This Part analyses the financial results of Victoria’s public hospitals and their associated entities for the year-ended 30 June 2012.
Findings
The combined financial results for public hospitals in 2011–12 included:
- a total operating deficit of $43 million ($102 million in 2010–11)
- total assets of $11.7 billion at 30 June 2012 ($10.4 billion at 30 June 2011)
- total liabilities of $4.3 billion at 30 June 2012 ($3.1 billion at 30 June 2011).
The improved operating result is largely due to increased government funding during 2011–12 and the implementation of cost control measures across the sector. Despite the improved result, hospitals remain heavily reliant on continued and increasing government funding.
The increase in total assets and liabilities is mainly due to the completion of the new Royal Children’s Hospital building and its corresponding public private partnership liability.
3.1 Introduction
The preparation of accrual-based financial statements enables an assessment of whether public hospitals are generating sufficient surpluses from operations to maintain services, fund asset maintenance and retire debt.
Under the Health Services Act 1988, public hospital boards and the Department of Health (DH) share responsibility for the financial performance and management of public hospitals. The public hospital board has responsibility for the management and governance of day-to-day operations, as well as ensuring the hospital meets minimum service level requirements. DH maintains ultimate strategic responsibility, including the determination of funding levels to enable operations, required service levels and the funding of large scale capital projects.
The level of services to be delivered by each hospital is agreed between the hospital and DH each year, and is included in an annual health services agreement —known as a ‘statement of priorities’. The agreement specifies the volume, scope and quality of services to be provided by the hospital, and provides the basis for the funding DH provides to each hospital for their service delivery.
3.2 Financial results
3.2.1 Operating result
The overall operating result for all public hospitals improved from a $102 million deficit in 2010–11 to a $43 million deficit in 2011–12.
Figure 3A provides a comparison of the total operating results over the past three years for each category of public hospital—metropolitan, regional and rural.
Figure 3A
Total public hospital operating result, 2009–10 to 2011–12
|
Category |
2009–10 $’000 |
2010–11 $’000 |
2011–12 $’000 |
|---|---|---|---|
|
Metropolitan |
(108 982) |
(100 871) |
(29 175) |
|
Regional |
(17 801) |
15 544 |
19 373 |
|
Rural |
(29 564) |
(16 894) |
(33 187) |
|
All hospitals |
(156 347) |
(102 221) |
(42 989) |
Source: Victorian Auditor-General’s Office.
The improved result in each of the past two years highlights the continued effort by hospitals to contain costs, which has been demonstrated in costs increasing at a slower rate than revenue, increased self-generated revenue, and increased funding from government sources.
Expenditure increased 6 per cent during 2011–12, however, revenue increased by 7 per cent contributing to the reduction in total deficit for the year.
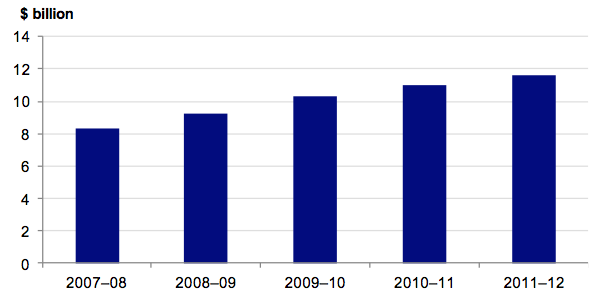
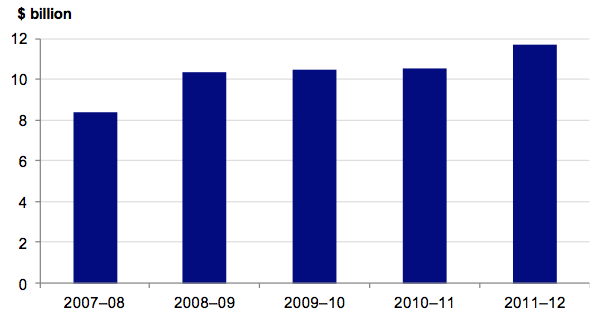
Revenue
Public hospitals received $11.6 billion in revenue in 2011–12. This was an increase of 7 per cent from 2010–11 ($10.8 billion) and was primarily due to increased government funding. Total revenue received has steadily increased over the past five years. Figure 3B highlights this trend.
Figure 3B
Total public hospital revenue, 2007–08 to 2011–12
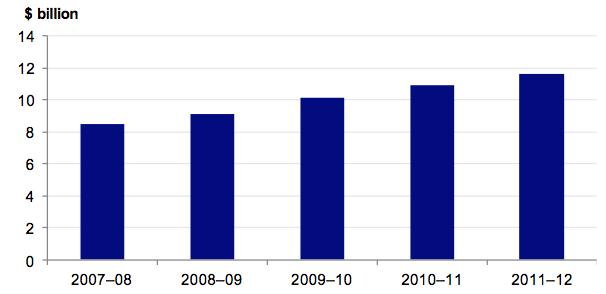
Source: Victorian Auditor-General’s Office.
Although total revenue has increased over the past five years, the composition of revenue received has remained consistent. Public hospitals generally derive and report revenue as either:
- revenue from services supported by the health services agreement (HSA income)
- revenue from services supported by hospital and community initiatives (H&CI income).
HSA income is substantially funded by DH. H&CI income typically comes from the hospital’s own activities, such as pharmacy sales, operation of car parks and income from investments. H&CI income is also referred to as non-HSA income or self‑generated revenue.
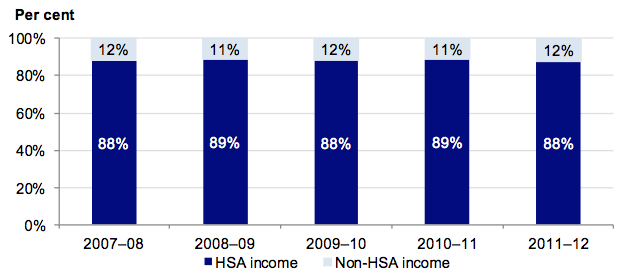
HSA income remains the largest revenue component comprising 88 per cent of total revenue in 2011–12. The composition of public hospital revenue over the past five years is presented in Figure 3C.
Figure 3C
Total revenue composition, 2007–08 to 2011–12
Source: Victorian Auditor-General’s Office.
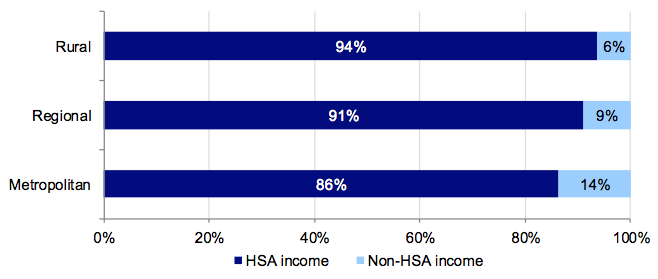
Revenue composition differs slightly across the three hospital categories. Rural hospitals derive 94 per cent of their revenue from HSAs, while metropolitan hospitals generate 86 per cent of their revenue from HSAs. This is because rural hospitals provide a larger rate of residential aged care service facilities that are mainly funded by the Commonwealth, and also typically generate less non-HSA income.
Figure 3D highlights the revenue composition for 2011–12, for each category of hospital.
Figure 3D
Revenue composition by hospital category, 2011–12
Source: Victorian Auditor-General’s Office.
Expenditure
In 2011–12 public hospitals collectively spent $11.6 billion—an increase of 6 per cent over the $10.9 billion spent in 2010–11. The increase in expenditure was mainly for employee benefits as a direct result of negotiated pay increases from new enterprise bargaining agreements. There was also an increase in the level of services provided, and an increase in the cost of providing these services.
Total expenditure by public hospitals has increased over the past five years, as shown in Figure 3E.
Figure 3E
Total public hospital expenditure, 2007–08 to 2011–12
Source: Victorian Auditor-General’s Office.
The composition of expenditure has been consistent over the past five years with total salaries and labour costs making up approximately 69 per cent of total expenditure each year.
The composition of expenditure over the past five years is presented in Figure 3F.
Figure 3F
Total expenditure composition, 2007–08 to 2011–12
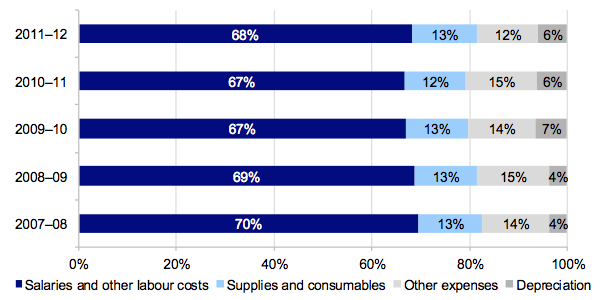
Source: Victorian Auditor-General’s Office.
There are no significant differences in expenditure composition between the metropolitan, regional and rural hospital sectors.
Figure 3G shows the breakdown between HSA and non-HSA expenditure in 2011–12.
Figure 3G
Expenditure composition for 2011–12
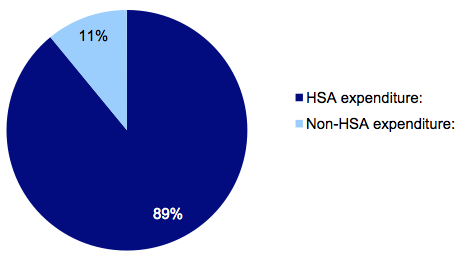
Source: Victorian Auditor-General’s Office.
The expenditure incurred in 2011–12 largely matches the proportion of revenue generated from these sources.
3.3 Financial position
Public hospitals have buildings, medical equipment and infrastructure assets of significant value on their balance sheets and require large amounts of money in order to operate, maintain and replace these assets. However, the revenue base for public hospitals is not tied to the value of their asset base and most of their assets cannot be sold to obtain funds.
An entity’s financial position is generally measured by reference to its net assets—the difference between its total assets and total liabilities. However, this measure is less appropriate for public hospitals, as they are not-for-profit entities, and generally do not hold assets that generate revenue. The objective for a public hospital should therefore be to maintain and improve its asset base and related service provision, while managing levels of debt.
Assets
In 2011–12 total public hospital assets increased from $10.4 billion to $11.7 billion. The increase was largely due to the finalisation of the new Royal Children’s Hospital building, which was opened in December 2011. The hospital was built under a public private partnership arrangement with a private sector consortium.
The total value of public hospital assets has remained relatively stable over the past five years, apart from the impact of the 2008–09 revaluation of land and buildings, and the completion of the new Royal Children’s Hospital building in 2011–12. Figure 3H shows the total value of assets over the past five years.
Figure 3H
Total assets, 2007–08 to 2011–12
Source: Victorian Auditor-General’s Office.
Liabilities
As at 30 June 2012, the total value of public hospital liabilities was $4.3 billion—an increase of 39 per cent from 30 June 2011 when total liabilities were $3.1 billion. This is in line with the increase in the asset base and is largely due to the finalisation of the Royal Children’s Hospital building and the subsequent take up of the associated liability payable to the private sector consortium.
Current liabilities—amounts that need to be paid within the next 12 months—increased by 13 per cent from $2.3 billion in 2010–11 to $2.6 billion in 2011–12. They were predominately made up of employee leave provisions and accounts payable. The movement was largely driven by higher wages; accruals for enterprise bargaining agreements; and the effect of lower interest rates on the calculation of the provisions.
Non-current liabilities more than doubled from $0.8 billion at 30 June 2011 to $1.7 billion at 30 June 2012, largely due to the additional liability related to the new Royal Children’s Hospital building.
3.4 National health reforms
In August 2011 the Commonwealth and all state and territory governments finalised an agreement setting out the architecture of national health reforms. Under the agreement, all state and territory governments have agreed to major reforms to the organisation, funding and delivery of health and aged care services across the country.
The reforms aim to deliver better access to services, reduce emergency department waiting times, improve responsiveness to local communities and provide a stronger financial basis for the national health system through increased funding.
Among other things, the agreement includes:
- a devolved system of hospital governance based on the existing Victorian model
- the injection of at least $16.4 billion nationally in efficient growth funding for hospitals from 2014–15 to 2019–20, providing up to $4.1 billion extra for Victoria
- the retention of state funding for hospitals, ensuring that state hospital funding remains in the state
- investment of up to $3.4 billion nationally to help meet new performance targets for elective surgery and emergency department access
- state government access to Commonwealth health data to assist in the planning of health services
- the creation of a national body to facilitate hospital funding.
The agreement introduces a new approach to financing, whereby the Commonwealth will provide funding on an activity basis. Block funding may be provided where appropriate—especially for rural hospitals. Block funding means funding is provided to support public hospital functions other than patient services, and public patient services provided by facilities that are not appropriately funded through activity based funding.
By 2017–18 it is expected that the Commonwealth will fund half of every dollar required to meet increases in the efficient cost of public hospital services.
The reforms aim to create nationally consistent and locally relevant reporting on the performance of health care providers. This is expected to give the public access to transparent and nationally comparable performance data and information on their local hospitals and health services—including emergency department and elective surgery waiting times.
State and territory governments will continue to be responsible for the performance of public hospitals in their jurisdictions. State and territory established Local Hospital Networks will be required to ensure individual hospitals are accountable and responsive to the needs of their local communities.
The agreement took effect from 1 July 2012, with an activity based funding system also introduced on that date.
The agreement had very little effect on the 2011–12 financial results of Victorian public hospitals. The effect going forward remains unclear, given the relatively recent implementation of the model. It is expected that the effects will become apparent towards the end of 2012–13.
4 Financial sustainability
At a glance
Background
To be financially sustainable, entities need to be able to meet current and future expenditure as it falls due. They also need the ability to absorb foreseeable changes and materialising risks without significantly changing their revenue and expenditure policies. This Part provides our insight into the financial sustainability of public hospitals based on our analysis of the trends in key financial indicators over a five-year period.
Conclusion
The overall financial sustainability risk for public hospitals in 2011–12 remained medium, consistent with 2010–11. The financial sustainability of individual hospitals improved for some and deteriorated for others during the period.
There was an improvement in the underlying result for hospitals and the volume of cash available at 30 June 2012 to meet short-term commitments. Liquidity and capital replacement indicators deteriorated across the sector indicating that hospitals remain under pressure to meet ongoing financial commitments from their own operations.
The hospital funding model has a direct and significant impact on the financial sustainability of public hospitals. It limits the ability of governing bodies and management to make decisions to renew and replace assets. These limitations have implications for the performance of the hospitals.
Findings
- The overall financial sustainability risk for public hospitals is medium.
- Thirty-nine per cent (34 of 87) of public hospitals were rated high risk.
- Fifty-six per cent (49 of 87) of public hospitals had cash holdings equivalent to less than 30 days operating cash outflows.
- Thirty-one public hospitals (29 in 2011) were provided with a letter of support from the Department of Health, which stated that it would provide financial support to enable these hospitals to meet their financial obligations, if required.
4.1 Introduction
To be financially sustainable, public hospitals need to meet their current and future expenditure as it falls due. They must also absorb foreseeable changes and financial risks that materialise, without significantly changing their revenue and expenditure policies.
Financial sustainability should be viewed from both the short-term and long-term perspective. Short-term indicators relate to the ability of an entity to maintain positive operating cash flows in the near future, or the ability to generate an operating surplus in the next financial year. Long-term indicators focus on strategic issues such as the ability to fund significant asset replacement or reduce long-term debt.
Insight into the financial sustainability of public hospitals is obtained from analysing trends in five key financial sustainability indicators over the past five years. The analysis reflects on the position of individual hospitals, the three categories of hospitals (metropolitan, regional and rural) and the sector as a whole. Appendix C describes the sustainability indicators and risk assessment criteria used and the significance of these.
The assessment of financial sustainability assists in identifying trends that either warrant attention or highlight positive results.
To form a definitive view of any entity’s financial sustainability, a holistic analysis that delves beyond financial indicators would be required. Such analysis would include an assessment of the entity’s operations and environment. These non-financial considerations are not examined in this report.
The results in this Part should be analysed in the context of the regulatory environment in which the hospitals operate.
4.2 Financial sustainability
4.2.1 Overall assessment
Thirty-four public hospitals had an overall sustainability risk rating of high at 30 June 2012 (29 in 2010–11) mainly because they were generating insufficient cash to adequately fund their operations. Twenty-seven of the 34 had cash at 30 June 2012 equivalent to less than 15 days of their operating expenses (24 of 35 in 2010–11).
At 30 June 2012, 49 of 87 hospitals (56 of 87 at 30 June 2011), including 15 major metropolitan and regional hospitals, had cash holdings equivalent to less than 30 days operating cash outflows. Sixteen hospitals have cash holdings of less than seven days operating cash flows (24 in 2010–11), and seven of these hospitals are major metropolitan or regional hospitals. These 16 hospitals, and the number of days operating cash flows available to them at 30 June 2012, are set out in Figure 4A.
Figure 4A
Hospitals with cash holdings of less than seven days operating cash outflow
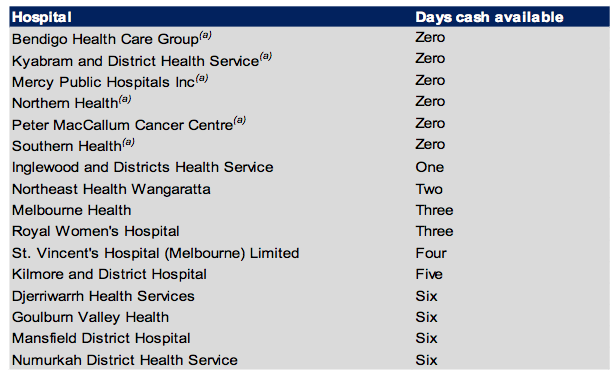
(a) Where a hospital’s unrestricted cash balance is less than zero it has been rounded to zero days cover.
Source: Victorian Auditor-General’s Office.
In 2012, 31 public hospitals (29 in 2011) had material uncertainty about their ability to continue operating as a going concern. To address this, the Department of Health (DH) has committed to providing financial support to each of these hospitals, via a letter of support, to enable the hospital to meet its financial obligations, if required.
Funding arrangements have a direct and significant impact on the financial sustainability of public hospitals. The current funding model continues to limit the ability of governing bodies and management to make decisions around asset maintenance and replacement. This has implications for the governing boards of public hospitals and their ability to fulfil their legislative responsibilities to effectively manage the entities.
Overall risk assessment
Thirty-four hospitals were assessed as having a high financial sustainability risk (29 in 2010–11).The increase in high risk hospitals was in the metropolitan and rural categories. Forty-six hospitals were assessed as having a medium financial sustainability risk (49 in 2010–11). This reduction was mainly noted for metropolitan hospitals. The results continue to be driven by poor liquidity, low cash reserves and limited ability for hospitals to fund long‑term debt.
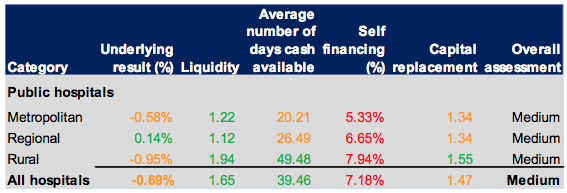
A summary of the overall financial sustainability risk assessment for each hospital category is provided in Figure 4B.
Figure 4B
Financial sustainability risk assessments by hospital category
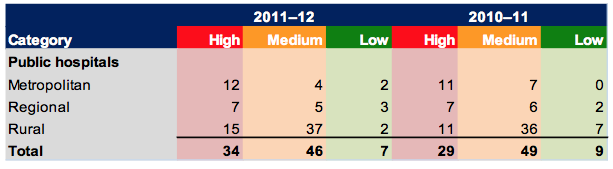
Source: Victorian Auditor-General’s Office.
It shows that the financial sustainability risk for rural hospitals increased the most during 2011–12.
Figure 4C shows the five-year average for each financial sustainability indicator, by public hospital category.
Figure 4C
Five-year average financial sustainability indicators
Source: Victorian Auditor-General’s Office.
The risk to the financial sustainability of the public hospital sector as a whole was assessed as medium. This was mainly due to their long-term financial indicators.
Figure 4D presents the five indicators by hospital category for 2011–12. When compared with the five-year averages in Figure 4C, the 2011–12 results indicate an overall deteriorating trend for all hospitals during the year, with most results below the five-year average.
Figure 4D
Average sustainability indicators by hospital category, 2011–12
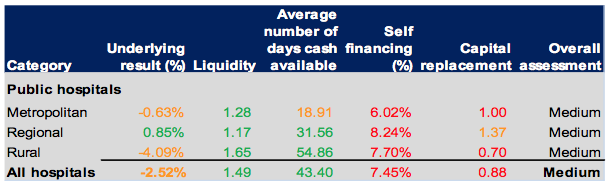
Source: Victorian Auditor-General’s Office.
The analysis shows that funding arrangements continue to affect the financial sustainability of public hospitals. This is particularly pronounced in relation to capital replacement as funding does not always align with the capital maintenance and renewal needs of hospitals.
4.2.2 Summary of trends in risk assessments over the five‑year period
When the risk assessments for each indicator are analysed individually they show the following trends over the five years to 2011–12:
- Underlying result—the underlying result risk for all hospitals deteriorated over the five-year period and has been largely influenced by the increased depreciation costs following the revaluation of assets in 2008–09. Risk assessments since 2009–10 have improved but remain below 2007–08 levels.
- Liquidity—the ability of public hospitals to repay their short-term financial obligations decreased over the past five years, however, most retain a risk assessment of low.
- Average number of days cash available—the average number of days cash available across all hospitals remained relatively stable over the period.
- Self-financing—the number of hospitals in the high- and medium-riskcategories increased slightly over the pastfiveyears.
- Capital replacement—the number of hospitals with a capital replacement assessment of high increased over the pastfive years, most notably effected in 2009–10 after the revaluation of assets in 2008–09.
In summary, hospitals are under continuing pressure to meet their long-term commitments from the proceeds of their own operations and in particular to maintain and replace their assets as and when necessary.
4.2.3 Impact of funding model on sustainability
For hospitals to maintain an adequate level of service, their assets need to be maintained and replaced when necessary. Public hospitals are almost solely dependent on additional government funding for their maintenance, upgrade and capital needs. The current funding arrangements play a significant role in, and greatly impact, the financial sustainability of public hospitals.
Sixty-six public hospitals (76 per cent) had a self-financing risk assessed as high in 2011–12. Forty-one hospitals received capital grants of less than 20 per cent of their depreciation expense for the year.
Under section 33 of the Health Services Act 1988, the functions of the board of a public hospital are to oversee and manage the hospital, and to make sure that services provided comply with the requirements of the Act and the hospital’s objectives. However, the funding model does not progressively provide funding to hospitals to match the depreciation of their assets.
Capital grants, which may be provided for asset renewal and replacement, are allocated by the government strategically across the sector. Management and the governing bodies of hospitals therefore have limited control over capital funding while remaining accountable for the impacts of ageing infrastructure and associated expenditure. The mismatch between the governance and funding models blurs accountability for the financial performance of individual hospitals.
At 30 June 2012, 33 of 87 hospitals had current asset balances less than current liabilities (29 in 2010–11). This indicates that there is short-term pressure on hospitals to fund amounts payable within the next twelve months. These hospitals, which included 15 of the major metropolitan and regional hospitals, incurred 81 per cent of the total costs incurred by all Victorian public hospitals during the year.
Reliance on letters of support for going concern uncertainties
At 30 June 2012, 31 public hospitals (29 in 2010–11) were showing signs of financial stress which indicated that there was a material uncertainty about their ability to continue as a going concern. To address this issue, DH provided a letter of support stating that it would provide adequate cash flows to enable them to meet their current and future obligations, as and when they fall due, for a period of 12 months up to September 2013, should it be required. This letter of support provides mitigating evidence that these hospitals are able to continue to report as a going concern, in accordance with Australian accounting standards.
Figure 4E provides a list of hospitals that relied upon a letter of support from DH at the date of signing their 2011–12 financial reports.
Figure 4E
Public hospitals relying upon a letter of support, 2011–12
|
Metropolitan |
Regional |
Rural |
|---|---|---|
|
Alfred Health* Austin Health* Eastern Health* Melbourne Health* Mercy Public Hospitals* Northern Health* Peter MacCallum Cancer Centre Royal Children’s Hospital* Royal Women’s Hospital* Southern Health* |
Albury Wodonga Health* Ballarat Health* Bendigo Health Care Group Central Gippsland Health* Echuca Regional Health* Goulburn Valley Health* Northeast Health Wangaratta* South West Healthcare Wimmera Health Care Group* |
Alpine Health* Bass Coast Regional Health* Beechworth Health* Castlemaine Health Colac Area Health* Djerriwarrh Health* Dunmunkle Health* East Wimmera Health* Kilmore and District Hospital* Kyneton District Health* Maryborough District Health Portland District Health* |
Note: * These hospitals also required a letter of support at 30 June 2011.
Source: Victorian Auditor-General’s Office.
We reviewed the results for the 29 hospitals that required support at 30 June 2011 to determine whether their financial sustainability had improved during 2011–12. We found that overall, they had not. Most reported poorer liquidity and average number of days cash available indicators for 2011–12 than they did for 2010–11. Three of the 29 identified in 2010–11 improved their financial performance during the year and did not need a letter of support for 2011–12, these were:
- Barwon Health
- Lorne Community Hospital
- Seymour Health.
Five hospitals requiring a letter of support at 30 June 2012 did not require a letter of support in 2010–11. These were:
- Bendigo Health Care Group
- Castlemaine Health
- Maryborough District Health
- Peter MacCallum Cancer Centre
- South West Healthcare.
We also analysed the trends in financial sustainability for the remaining 56 public hospitals to determine whether any were showing early indications of financial strain. While 16 of the 56 do not currently depend on a letter of support from DH, their financial sustainability indicators and trends in liquidity and average days cash available are in decline. Unless early action is taken to address the decline there is a risk that they too may need DH support in future years.
4.3 Five-year trend analysis
This section provides analysis and commentary on each indicator’s trends for the past five years.
4.3.1 Underlying result
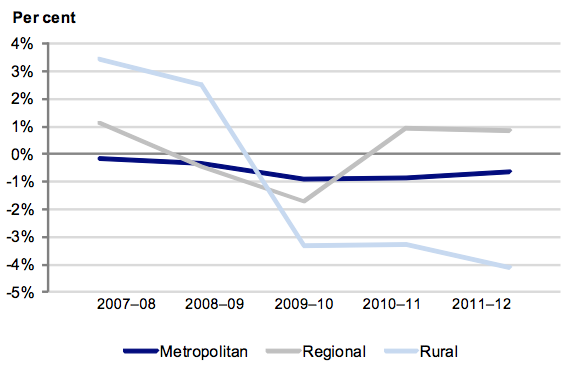
Figure 4F shows that the average underlying result for each public hospital category has fluctuated since 2007–08. The trends for regional and metropolitan hospitals have shown some recovery since the large decrease in 2009–10 following asset revaluations at 30 June 2009. However, the trend for rural hospitals has not shown the same recovery.
Figure 4F
Average underlying result
Source: Victorian Auditor-General’s Office.
In 2011–12, the number of hospitals with an underlying deficit decreased to 62 (63 in 2010–11). Although there was improvement across the sector, rural hospitals continued to incur the largest proportion of deficits of all hospitals. Eighty-three per cent of rural hospitals delivered a deficit in 2011–12—compared to 60 per cent for regional and 50 per cent for metropolitan hospitals.
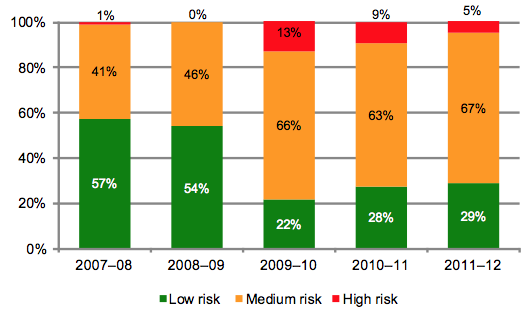
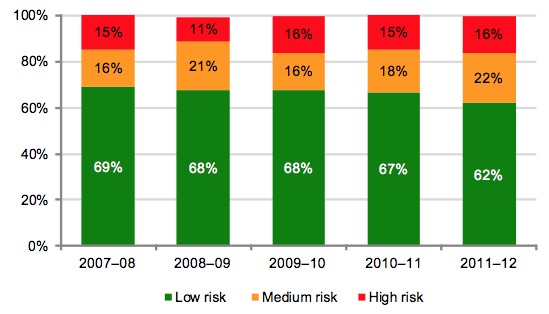
Figure 4G shows that 5 per cent of public hospitals (four hospitals) had an underlying result risk of high in 2011–12, an increase from 1 per cent in 2007–08. All hospitals in the high-risk category in 2011–12 were rural hospitals.
Figure 4G
Underlying result risk levels
Source: Victorian Auditor-General’s Office.
The proportion of hospitals with underlying result risk of medium remained relatively stable at 67 per cent in 2011–12 (63 per cent in 2010–11). The effect of the 2008–09 asset revaluations can be clearly seen in Figure 4G with a significant shift in the risk ratings in 2009–10, the year after the revaluations. This shift was largely due to the resulting increase in depreciation costs. Improvements noted since 2009–10 are an indication of the improved results hospitals are generating.
The results demonstrate the continuing difficult financial environment for all public hospitals.
Figure 4H shows the percentage of public hospitals with an underlying deficit, by category.
Figure 4H
Percentage of public hospitals with an underlying deficit
Source: Victorian Auditor-General’s Office.
The analysis highlights that the number of hospitals with an underlying deficit decreased in 2011–12 after a peak in 2010–11. This improvement is largely due to increased government funding received by hospitals in 2011–12 and a general focus on maintaining costs. While all hospitals operate in a tight financial environment and continue to monitor their results closely, they also continue to be affected by the higher depreciation charges that follow the revaluation of hospital buildings. Under the funding model, DH does not fund hospitals for depreciation. Consequently, it is expected that hospitals will continue to record operating deficits into the future.
Over time, a hospital’s revenue must equal or exceed its expenditure in order to sustain operations. If it doesn’t, there is a risk that cash reserves will be depleted and force the hospital to defer or abandon discretionary spending, such as for the maintenance or replacement of assets. In the case of public hospitals, recurring deficits put increased pressure on the state and individual hospitals to adequately maintain facilities, operations and service levels.
4.3.2 Liquidity
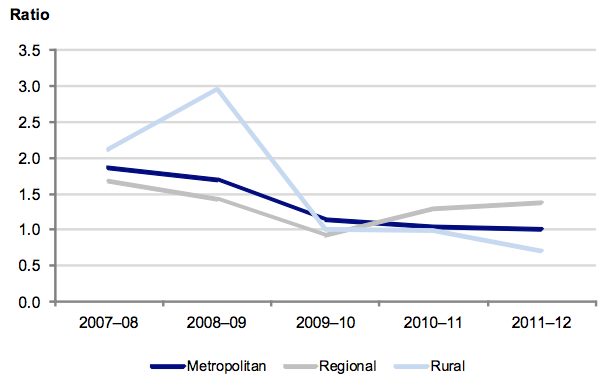
Figure 4I shows the average liquidity ratio by hospital category over the past five years and shows that rural hospitals had the highest average liquidity ratio over the period.
Figure 4I
Average liquidity ratio
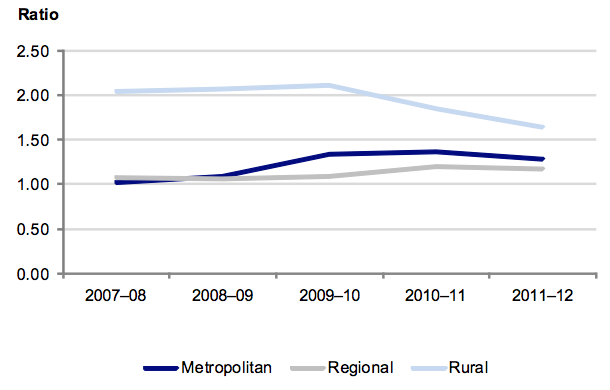
Source: Victorian Auditor-General’s Office.
The trend has been relatively stable for the regional hospitals over the past five years, with deterioration in the metropolitan and rural categories.
Figure 4J shows that the overall risk of public hospitals to repay their short-term financial obligations has increased over the past five years with a greater number of hospitals in the high- and medium-risk categories than in the preceding four years.
Figure 4J
Public hospital liquidity risk
Source: Victorian Auditor-General’s Office.
An entity’s ability to fund its liabilities in the short term is an indicator of its financial sustainability. Difficulty in meeting short-term debt may require redirection of funds from discretionary spending or, in the worst case scenario, cessation of operations. For public hospitals, recurring liquidity shortages puts pressure on both the government and the hospitals to adequately maintain facilities, operations and service levels while meeting short-term liabilities.
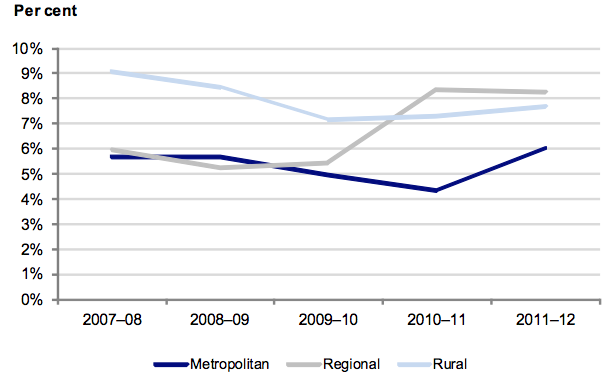
4.3.3 Average number of days cash available
Figure 4K shows that the average number of days of cash available at year end has improved across the sector as a whole over the past two years, although the position of metropolitan hospitals has deteriorated.
Figure 4K
Average number of days cash available
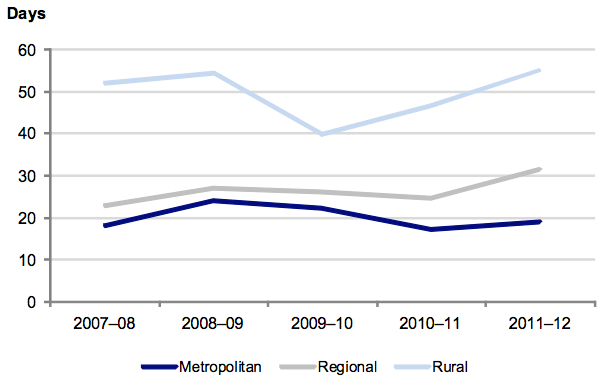
Note: Funds held in trust, unspent capital grants and restricted special purpose funds are excluded from this analysis as their use is restricted
Source: Victorian Auditor-General’s Office.
The improvement in the cash holdings of rural and regional hospitals in 2010–11 continued into 2011–12. This was due to the improved underlying results of hospitals, when depreciation is excluded.
Figure 4L highlights the steadily deteriorating cash balances across metropolitan hospitals over the past four years, while their average monthly operating cash outflows have steadily increased. Figure 4L highlights the continuing decreasing cash balances available to all metropolitan hospitals to cover an increasing level of costs. The gap between available cash and average monthly cash outflows has almost quadrupled over the past four years.
The lack of cash is further highlighted when the balance of cash available to metropolitan hospitals is analysed. At 30 June 2012, only seven metropolitan hospitals (39 per cent of all metropolitan hospitals) had cash available to cover more than two weeks of operating expenses. More concerning is that four metropolitan hospitals had no unrestricted cash available to them at 30 June 2012 and that the four hospitals incur expenditure of more than $2.2 billion a year.
Figure 4L
Metropolitan hospitals available cash compared to average monthly cash outflow
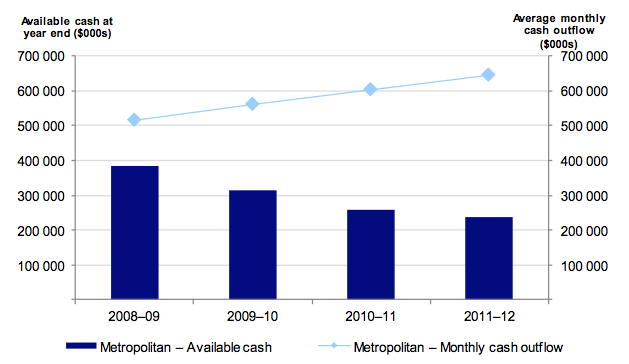
Source: Victorian Auditor-General’s Office.
Figure 4M shows that the risk for cash holdings at 2011–12 for 56 per cent of hospitals was assessed as high or medium (62 per cent in 2010–11). Their cash holdings were equivalent to less than 30 days operating cash outflows.
Figure 4M
Public hospital average number of days cash available risk assessment
Source: Victorian Auditor-General’s Office.
Sixteen hospitals had cash holdings equivalent to less than seven days operating cash flows at 30 June 2012 (24 in 2010–11). Seven of these were metropolitan hospitals.
Good financial management requires an entity to have the equivalent of at least one month’s operating cash outflows available as unrestricted cash holdings. Cash holdings of less than this may create, or indicate, ongoing liquidity issues.
Each hospital is responsible for its own cash management. However, given the funding arrangements, which include fortnightly payments from the department, a hospital’s ability to manage its cash is significantly affected by the funding cycle.
4.3.4 Self-financing
Figure 4N shows that the movement in the average self-financing ratio has been variable for each of the three hospital categories over the past five years.
Figure 4N
Average self-financing indicator
Source: Victorian Auditor-General’s Office.
The significantly improved result for regional hospitals in 2010–11 reversed slightly in 2011–12. However, the result for metropolitan and rural hospitals improved.
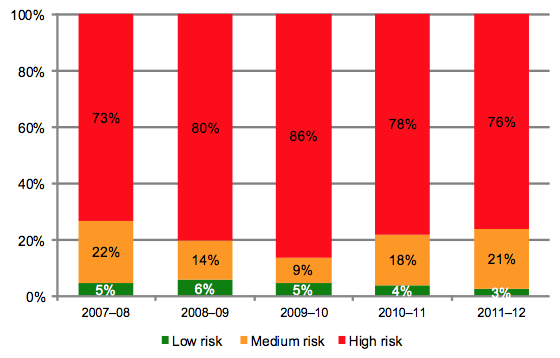
The self-financing indicator assesses operating cash flows against underlying revenue. The high risk benchmark level for this indicator is 10 per cent. Across the sector, the average self-financing ratio remains in the high-risk range. Hospitals may not be able to effectively replace their assets over the long term using income generated by their operations. These circumstances highlight the sector’s reliance on additional government funding for asset renewal and replacement.
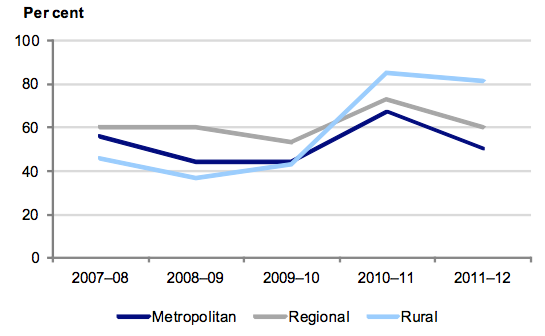
Figure 4O shows that 66 public hospitals (76 per cent) had a self-financing risk assessment of high for 2011–12, largely as a consequence of the capital funding model.
Figure 4O
Public hospital self-financing risk assessment
Source: Victorian Auditor-General’s Office.
Over the past five years, the mix of high-, medium- and low-risk ratings for this indicator has remained relatively stable.
4.3.5 Capital replacement
Figure 4P shows that the capital replacement ratio has deteriorated across all public hospital categories over the past five years, indicating that capital spending on fixed assets is either reducing or being deferred. This means that more spending may be required over the long term to replace ageing public hospital assets.
Figure 4P
Average capital replacement indicator
Source: Victorian Auditor-General’s Office.
The asset spending data used in Figure 4P includes spending on both new and existing facilities. As a result, the true level of underspending on renewing existing assets may be understated. The results, nevertheless, remain indicative and identify challenges for DH and a large portion of public hospitals to fund capital asset expenditure into the future.
The capital replacement indicator compares the rate of spending on infrastructure and assets with an entity’s depreciation. This is a long-term indicator as capital expenditure can be deferred in the short term if there are insufficient funds available from operations.
Current spending on capital assets is not sufficient to maintain and upgrade existing infrastructure and equipment. This poses a risk to the sector’s ability to keep up with the increasing demand for health services and maintain their assets. This assessment shows a result consistent with that of the self-financing indicator.
Figure 4Q shows the trend of annual cash expenditure on fixed assets compared to annual depreciation expense.
Figure 4Q
Cash spent on fixed assets compared to annual depreciation expense
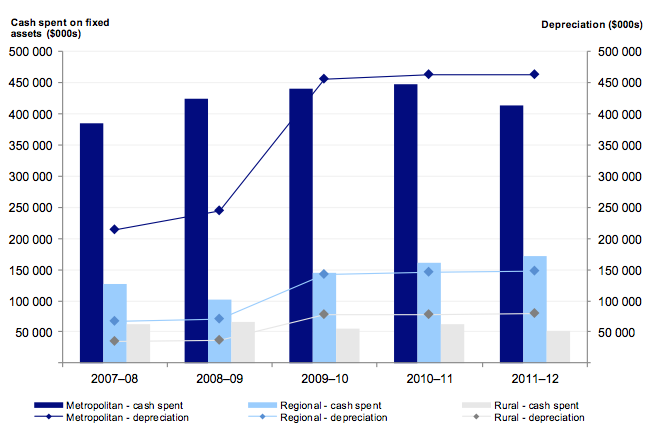
Source: Victorian Auditor-General’s Office.
Figure 4Q highlights the increasing depreciation expense across all sectors and the generally decreasing level of cash spent on fixed assets. The actual amount of cash spent on fixed assets was less than the total annual depreciation expense in both the metropolitan and rural sectors, in each of the past three years. This trend accords with the overall movements identified in Figure 4P.
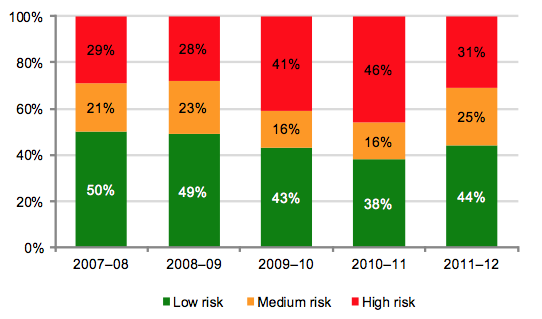
Figure 4R shows that number of hospitals with a capital replacement risk rating of high has remained steady between 2009–10 and 2011–12.
Figure 4R
Public hospital capital replacement risk assessment
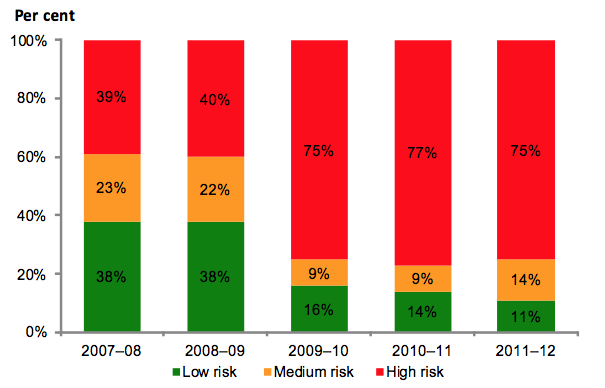
Source: Victorian Auditor-General’s Office.
The indicator was significantly impacted by the revaluation of hospital buildings and the reassessment of their useful lives in 2008–09. The revaluation increased the value of assets across the sector, increasing the amount of depreciation charged by hospitals annually, and directly affecting the capital replacement indicator.
The 2011–12 result also shows that the proportion of hospitals in the low-risk category reduced significantly, after a period of stability.
Figure 4S outlines the trend over the past five years for hospitals that received state capital grants of less than 20 per cent of their depreciation expense.
Figure 4S
Percentage of hospitals receiving state capital grants of less than 20 per cent of depreciation expense
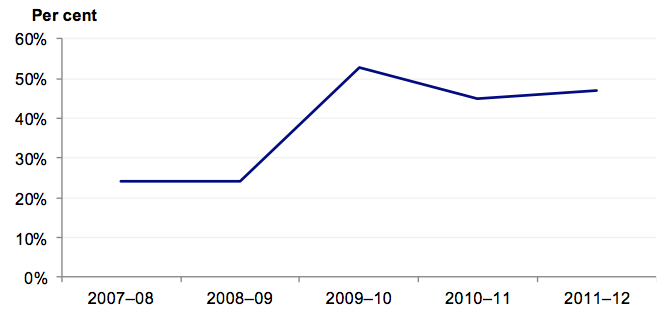
Source: Victorian Auditor-General’s Office.
The impact of the funding model is clearly evident in Figure 4S. For 2011–12, 47 per cent of public hospitals (41 hospitals) received capital grants from DH of less than 20 per cent of their depreciation for the financial year (45 per cent for 2010–11). This was most pronounced in rural hospitals where 63 per cent received capital grant funding of less than 20 per cent of their depreciation expense.
5 Internal controls
At a glance
Background
Effective internal controls enable entities to meet their financial and governance objectives and deliver reliable, accurate and timely financial reports. This Part presents the results of our assessment of general internal controls and controls over audit committees, capital projects and self-generated revenue.
Conclusion
Internal controls at public hospitals and their associated entities were adequate for producing reliable and accurate financial reports. Nevertheless, some common areas of internal control would benefit from further strengthening across the sector.
Findings
- All hospitals had audit committees with adequate membership, roles and experience. However, 12 did not have an independent chair or ministerial exemption from this requirement.
- Capital project management procedures at the majority of public hospitals were adequate. However, 76 per cent did not have a policy in place.
- Ninety-five per cent of hospitals generatednon-public hospital revenue. Policies, control frameworks and management practices for this revenue, while effective, need further development.
Recommendations
That public hospitals:
- assess policies and practices against identified general internal control weaknesses to determine the adequacy of their controls
- address instances of noncompliance of audit committee composition with the Minister for Finance’s Standing Directions
- develop, and submit to their board, capital project management and self‑generated revenue policies tailored to the hospital
- set and report against key capital project milestones and key performance indicators regularly to the board
- conduct, and distribute, post-project evaluations
- enhance use of internal audit, to review capital project and self-generated revenue policies, procedures and practices.
5.1 Introduction
Effective internal controls assist entities to reliably and cost-effectively meet their financial and governance objectives. Reliable internal controls are a prerequisite for the delivery of accurate and timely external and internal reports.
In our annual financial audits, we focus on the internal controls relating to financial reporting and assess whether entities have effectively managed the risk that their financial statements will not be complete and accurate. Poor internal controls diminish management’s ability to achieve an entity’s objectives, agreed service levels and compliance with relevant legislation. Poor internal controls also increase the risk of fraud, error and irregularity.
The board of each public hospital is responsible for developing and maintaining adequate systems of internal control to enable:
- preparation of accurate financial records and other information
- timely and reliable external and internal reporting
- appropriate safeguarding of public assets
- prevention or detection of fraud, errors and other irregularities.
The Standing Directions of the Minister for Finance require management to implement effective internal control structures.
In this Part we report on aspects of the internal controls across the state’s 87 public hospitals. We specifically address:
- general internal controls
- audit committees
- controls over capital project management
- self-generated non-public hospital revenue.
5.2 General internal controls
All public hospitals and their associated entities maintained adequate internal controls to ensure the reliability of financial reporting, the efficiency and effectiveness of their operations and compliance with relevant laws and regulations. Nevertheless, areas of internal controls that commonly need strengthening were identified and were reported to the relevant hospital board and management.
The commonly identified areas related to:
- assuring the effectiveness of controls at outsourced service providers
- preparing and reviewing key account reconciliations (reported last year)
- reviewing masterfile standing data changes (reported last year).
The incidence of control weaknesses was higher at regional and rural hospitals than in metropolitan ones.
Figure 5A sets out the financial areas and systems that had the highest occurrence of weaknesses in 2011–12.
Figure 5A
Occurrence of control weaknesses by account balance and system
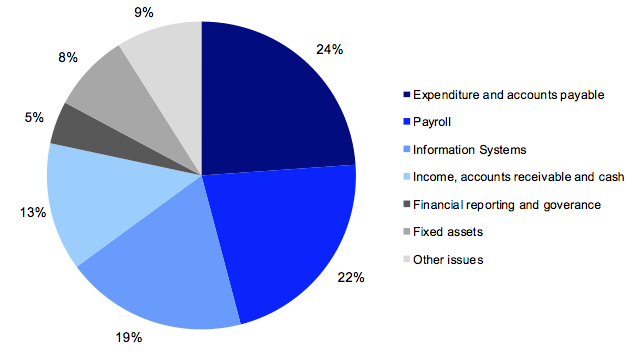
Source: Victorian Auditor-General’s Office.
Almost half of all findings related to expenditure—such as payroll or the purchase of supplies.
The common identified areas of control weakness are covered in more detail below.
5.2.1 Assuring the effectiveness of controls at outsourced service providers
Approximately one-third of all public hospitals outsourced a key part of their financial functions, such as payroll, general ledger or accounts payable, to third parties during 2011–12. Outsourcing key functions can be a cost-effective way to deliver day-to-day activities, however, there can be important risk management, control, security, and accountability implications.
Assurance over the effectiveness of the control environment at outsourced service providers is part of the overall internal control framework of an entity. When outsourcing key functions, hospital management does not forego its duty to ensure that controls are adequate, that the activities produce accurate outputs and that sensitive information is protected.
All public hospitals that outsourced one or more key financial functions in 2011–12 did not receive adequate confirmation from an independent auditor regarding the control environment of their outsourced providers by 30 June 2012.
5.2.2 Preparing and reviewing key account reconciliations
A financial report is compiled from information captured in an entity’s general ledger. Key general ledger balances are supported by subsidiary ledgers or systems such as accounts payable, fixed assets and payroll. Periodic reconciliation of the general ledger with subsidiary ledger balances enables confirmation of the completeness and accuracy of data recorded, and assists with the early identification of potential errors. Timely preparation and independent review of reconciliations decreases the risk of errors going undetected or not being resolved in a timely manner.
Twenty-three of 87 public hospitals (24 in 2011) had deficiencies in the preparation and review of reconciliations. They included reconciliations not being prepared, not being independently reviewed in a timely manner, or not being independently reviewed at all.
These weaknesses were identified in previous Auditor-General’s reports, most recently in the report Public Hospitals: Results of the 2010–11 Audits.
Hospitals need to act promptly to address this matter.
5.2.3 Review of masterfile standing data changes
Financial systems, such as accounts payable and payroll systems, rely on the maintenance of standing data in masterfiles to enable reliable processing of individual payments. Masterfile data can include details such as names, addresses, pay rates and bank account details.
It is important that all changes made to masterfile standing data are checked for completeness, accuracy and legitimacy. Without these checks, processing errors can be repeated many times over, reducing data integrity. Further, an independent review of masterfile standing data changes is important for the detection and timely correction of unintentional or fraudulent changes, and to guard against payments to fictitious parties.
Fourteen of 87 public hospitals (26 in 2011) had weaknesses around the maintenance of key system masterfiles. These issues included:
- a lack of independent review of changes made to masterfile standing data
- inadequate documentation to support changes to masterfile data.
These weaknesses were also reported in the Auditor-General’s report, Public Hospitals: Results of the 2010–11 Audits. While pleasing that the number of hospitals with issues around masterfile standing data changes almost halved from 2010–11 to 2011–12, the remaining hospitals need to resolve this issue.
5.3 Audit committees
A critical part of good governance is an effective audit committee. The audit committee can play a significant role by assisting the board to fulfil its governance and oversight responsibilities, as well as strengthening the financial accountability of the board and senior management.
Key responsibilities of the audit committee include overseeing an entity’s risk management framework, internal control environment and the accountability of senior management, engaging with internal and external audit and monitoring the status of actions to address audit recommendations. Its effective operation is therefore critical to the sound governance of a hospital.
We reviewed the policies, management practices and governance arrangements for public hospital audit committees.
Under the Health Services Act 1988, primary responsibility for establishing and appropriately using an audit committee rests with a hospital’s board. Boards should establish and monitor an audit committee to make sure appropriate governance practices are in place to comply with the Financial Management Act 1994.
5.3.1 Audit committee framework
In establishing controls, public hospitals should maintain an audit committee that incorporates:
- a comprehensive audit committee charter
- appropriate review practices
- sound governance and oversight.
Figure 5B outlines the key elements of an effective audit committee. It draws on the requirements of the Financial Management Act 1994, the Standing Directions of the Minister for Finance, the Queensland Department of Treasury’s 2009 report, Audit Committee Guidelines, as well as the Australian National Audit Office’s better practice guide on public sector audit committees, released in 2011.
Figure 5B
Key elements of an effective audit committee framework
|
Key area |
Key elements |
|---|---|
|
Audit committee charter |
Audit committee charter is in place and sets out:
|
|
Governance and oversight |
Charter approved by the governing body. Minutes of meetings prepared and provided to the board and chief executive. Advice received by the board and chief executive on matters of concern raised by the committee. Records of meetings held and attendances maintained. Annual self-assessment of performance conducted. |
|
Internal and external audit oversight |
Internal audit
External audit
|
Source: Victorian Auditor-General’s Office.
We assessed the audit committees of the 87 public hospitals against these elements. Primarily, and most importantly, we noted that all public hospitals had established an audit committee.
5.3.2 Audit committee charter
Every hospital’s audit committee had a board approved and published charter. The board regularly reviewed the audit committee charter at 81 hospitals (93 per cent), with most reviews completed within the past two years.
Many of the critical better practice elements were found to be in place across the sector. The following areas were typically covered:
- the role of the committee—100 per cent
- oversight of the risk management framework—100 per cent
- responsibilities relating to external and internal audit—100 per cent
- monitoring of compliance with laws and regulations—100 per cent
- reporting lines to the governing board—93 per cent
- attendance requirements for meetings and quorums—90 per cent
- membership qualification, experience and composition of the committee—82 per cent.
The following better practice elements were not well incorporated in audit committee charters across the sector. These elements, if not properly addressed, can impact on the effectiveness of an audit committee:
- rotation of membership—missing for 51 per cent of hospitals
- requirements for dealing with conflicts of interest—missing for 39 per cent of hospitals.
Committee role and composition
In all public hospitals, the audit committee oversaw matters of accountability and internal control and had direct access to the governing board. Most audit committees had at least four members. At 78 of 87 hospitals (90 per cent), at least two of the committee members were independent. Hospitals that did not have at least two independent members were either rural hospitals or those with a relatively small level of activity. Given these circumstances, this finding was not unexpected.
The audit committee chair was an independent member at 85 per cent of public hospitals. Hospitals are required to obtain an exemption from the Minister for Finance when the audit committee chair is not an independent member. This exemption was not evident at 12 hospitals.
Audit committee members were rotated periodically, although in many cases the basis for rotation was unclear. Committee membership was often reviewed in conjunction with board appointments. Across the sector, audit committee members were rotated at least every three years.
Skills and experience
At 86 of 87 hospitals (99 per cent) audit committee members possessed a broad range of business management skills and experience. The following key characteristics were noted at a majority of hospitals:
- a broad range of business and management skills and experiences aligned with the strategic direction of the hospital—99 per cent
- access to appropriate resources to assist understanding and dealing with complex and difficult matters in a timely manner—99 per cent
- financial and statutory reporting requirements—98 per cent
- training and briefing on emerging risks affecting the hospitals—98 per cent
- understanding of the hospital’s risk management framework—97 per cent
- financial reporting experience—96 per cent
- legislative compliance arrangements—96 per cent
- information technology experience—76 per cent.
On balance, audit committee members exhibited appropriate capabilities for their roles.
All audit committees had direct and clear access to their hospital’s governing body.
5.3.3 Governance and oversight
Record of meetings
Eighty-three of 87 hospitals (95 per cent) had structured audit committee meetings at least quarterly. Exceptions mainly related to newly formed committees. A meeting schedule was in place at 83 hospitals.
In all instances there was an expectation that formal minutes be provided to the governing board—this occurred for 82 of the 87 hospitals (94 per cent).
Review of performance
In 66 hospitals (76 per cent) the audit committee annually assessed its own performance against the charter. Key stakeholders—including the governing board—were consulted during the assessment process.
Internal and external audit oversight
Across the sector audit committees communicated with internal audit and were heavily involved with reviewing internal audit performance, coverage, annual work plans, and monitoring the implementation of internal audit recommendations.
All audit committees had appropriate communication protocols with external auditors including for the review of management letters, audit recommendations and audit reports.
5.4 Capital project management
There are a number of extensive capital projects underway across the public hospital sector aimed at replacing existing buildings and expanding facilities to improve the quality of services provided to the community. In 2011–12 the sector spent $636 million on capital projects.
Figure 5C provides a summary of the actual cash spent by hospitals on capital projects across the public hospital sector for the past three years.
Figure 5C
Cash spent on capital projects, by public hospitals
|
Category |
2009–10 $’000 |
2010–11 $’000 |
2011–12 $’000 |
|---|---|---|---|
|
Metropolitan |
440 289 |
447 986 |
413 109 |
|
Regional |
145 173 |
160 650 |
171 075 |
|
Rural |
55 626 |
62 541 |
52 133 |
|
All hospitals |
641 088 |
671 177 |
636 317 |
Source: Victorian Auditor-General’s Office.
Figure 5C highlights the significant level of cash spent on capital projects particularly in the metropolitan sector. It does not include expenditure of approximately $0.9 billion on the new Royal Children’s Hospital completed in December 2011. Although the new hospital is recorded in the Royal Children’s Hospital financial statements, the project was overseen and managed by the Department of Health (DH) outside the Royal Children’s Hospital’s ordinary capital program.
Fifteen hospitals had not incurred large amounts of capital expenditure over the past three years.
Effective management of capital projects is critical to the sector given the scale of the annual capital expenditure program. Inadequate management and control over capital projects can result in:
- budget and time overruns
- inefficient allocation of resources
- project benefits and outcomes not achieved.
Our review of capital expenditure programs across the public hospital sector revealed that significant budget overruns were not typical of public hospitals. At 30 June 2012, of all 624 projects underway across the sector, only seven projects were noted as being over budget.
In contrast, 53 projects were expected to be completed late. Most of these were at rural hospitals. The greater delays noted at rural hospitals is consistent with their generally weaker capital project management frameworks.
5.4.1 Capital project management framework
Figure 5D outlines the key components of an effective capital project management framework. It draws on the Department of Treasury and Finance’s Gateway Review Process, first introduced to Victoria in 2003, and the Standing Directions of the Minister for Finance under the Financial Management Act 1994. It provides a comprehensive approach to managing capital projects.
Figure 5D
Key elements of an effective capital projects management framework
|
Component |
Key elements |
|---|---|
|
Policy |
Capital project management policies established and include:
Policy regularly reviewed and approved by governing body or subcommittee. Policy and procedures comply with the directions and policy of state government. |
|
Management practices |
Management monitors capital projects checking that:
Project costs are processed accurately and in a timely manner within supporting ledgers. Maintenance and review of a central contracts register. Maintenance and implementation of capital project management systems that are capable of scheduling payments. Post-project evaluation completed and lessons consolidated and used in practice. Comprehensive and regular reporting to the governing body or subcommittee. |
|
Governance and oversight |
The governing body or subcommittee monitor:
Policies and procedures are regularly reviewed, updated and approved by the governing body or subcommittee. Internal audit used to review policy, processes and practice periodically. |
Source: Victorian Auditor-General’s Office.
We considered these elements in assessing the capital project management in the 87 public hospitals.
Capital project management frameworks in the sector were adequate overall. Management and governance oversight was strong, with the majority of entities implementing effective monitoring.
However, the extent of internal audit coverage over aspects of capital projects was limited, there were few capital project policies and the incidence of post-project evaluations could be improved.
5.4.2 Policies
Existence of policies
Twenty-one of 87 public hospitals (24 per cent) had a capital project management policy. A further 16 (18 per cent) were drafting a policy at 30 June 2012.
The remaining 50 hospitals did not have a policy. Thirteen of these believed they did not require one, given their low volume of capital project expenditure. Six hospitals relied on DH’s project governance guidelines, instead of preparing their own policies. While the DH guidelines are reasonably comprehensive, they are intended to assist hospitals and other entities to develop their own policies. They are not an alternative to a hospital developing its own policy.
Policies were more prevalent across the metropolitan and regional hospital sectors (56 per cent and 47 per cent respectively). This reflects the greater capacity of these hospitals to dedicate resources to overall governance structures.
Seven per cent of rural hospitals had a policy. This was despite that sector spending over $50 million on capital expenditure in 2011–12, with an average project cost of $0.8 million.
Figure 5E shows the status of capital project management policies across each of the public hospital categories.
Figure 5E
Status of capital project management policy
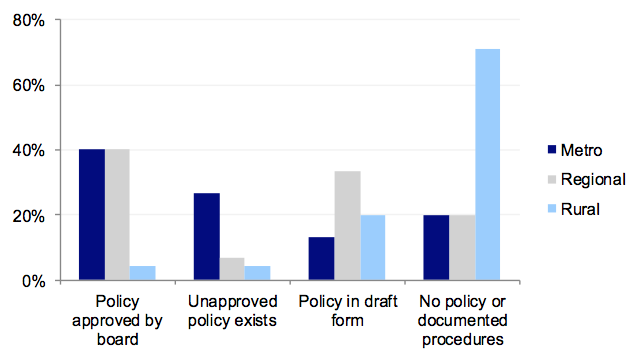
Source: Victorian Auditor-General’s Office.
Where a hospital had a policy, it commonly incorporated the following better practice elements:
- authorisation and approval arrangements—91 per cent of policies
- capital project objectives—86 per cent of policies
- budget setting and approvals—86 per cent of policies
- governing body responsibilities for oversight—81 per cent of policies.
The following better practice elements were typically not well incorporated into the policies:
- requirement for the preparation of post-project evaluations—not included in 52 per cent of policies
- requirements for risk assessment before project commencement—not included in 33 per cent of policies
- circumstances requiring the appointment of probity auditors or advisors—not included in 38 per cent of policies
- details of when to appoint a project manager/sponsor/champion—not included in 33 per cent of policies.
While policies were generally comprehensive, improvements can be made.
Board approval of policy
The board had approved the capital project management policy in 67 per cent of the 21 hospitals that had a policy, with approval otherwise completed by varying levels of management.
5.4.3 Management practices
Good management practices bridge the gap between a documented policy, board oversight and review of expenditure incurred. Management should monitor all aspects of capital programs regularly, and respond to changes as required. Regular monitoring of capital programs also allows management to identify whether accounting systems are able to handle and process key project information accurately.
These management practices should be in place at all hospitals, including those without current capital development programs.
Monitoring of capital projects
Executive management was generally monitoring the status of projects. Key project elements were reviewed at 68 of the 74 hospitals (92 per cent) that incurred capital expenditure in 2011–12.
Regular monitoring of capital projects was most prevalent in regional hospitals: all regional hospitals had regular monitoring of projects at an executive level. Monitoring was least prevalent at rural hospitals where 72 per cent of hospitals had regular monitoring of projects at an executive level.
Central contracts register and systems
Seventy-four hospitals (85 per cent) had a central contracts register that assisted the finance team in calculating work in progress and capital commitment amounts at month and year end.
Forty-nine hospitals (56 per cent) had a capital project management system capable of scheduling payments. Fifteen of the 38 hospitals without a system had not completed any significant capital projects during the past three years. The remaining 23 relied on other means to schedule payments and forecast their capital project cash flows.
Eighty-six per cent of hospitals had processes to assure timely and accurate processing of project costs within supporting ledgers.
Conduct of post-project evaluations
Forty-three of the 74 hospitals that had capital expenditure (58 per cent) conducted post-project evaluations on completion of each capital project. However, evaluations were not provided to the responsible project managers at 14 of these 43 hospitals that conducted post-project evaluations. This, in effect, eliminated the entity’s ability to learn from the evaluation.
5.4.4 Governance and oversight
The board is ultimately accountable for a hospital’s operations, and is therefore a crucial part of effective capital project management. Boards exercise governance and oversight by undertaking high-level reviews of capital activities, developing and signing off the overall capital program, and providing direction on the appropriateness of policies and procedures.
The majority of the governance and oversight components included in our review applied to each of the public hospitals, irrespective of whether the hospital had a capital program.
Reporting to the board
Seventy-five hospitals reported to their governing board on overall capital expenditure programs and specific projects either monthly or quarterly. The content of these reports varied greatly:
- performance against budget was reported to the board at 56 per cent of hospitals
- project risks were reported at 46 per cent
- key performance indicators were reported at 37 per cent.
It was concerning that key performance indicators were not set and reported against at 53 per cent of hospitals, and milestones not set at the commencement of the project in 40 per cent of hospitals.
For the rural sector specifically, where time delays in capital projects were more prevalent, 54 per cent of hospitals set key milestone dates at the commencement of the project. However, only 33 per cent of all rural hospitals reported against established key performance indicators. Improvement by rural hospitals in both these areas could reduce budget and time overruns on their capital projects.
Post-project evaluations were distributed to the board at 80 per cent of hospitals that conducted such evaluations.
Board oversight
The adequacy of capital project policies had not been reviewed within the past three years at 68 per cent of hospitals.
Generally, budget variations were approved by the governing board.
Risk management
Project risks were monitored by either the board or a sub-committee of the board at 50 of the 87 hospitals (57 per cent), with metropolitan hospitals (78 per cent) doing this more than regional (60 per cent) and rural hospitals (50 per cent).
Only 40 of the 87 public hospitals (46 per cent) included risks associated with their capital expenditure program in their risk register. This is concerning, given the significant size of these capital expenditure programs, and average project costs incurred.
Internal audit
Seventy-five of the 87 public hospitals (86 per cent) had not had an internal audit of their capital project policies or practices during the past three years. This included 12 metropolitan hospitals that incurred the largest proportion of capital expenditure across the sector.
5.5 Self-generated revenue
Public hospitals are under increasing pressure to generate revenue to fund their operations. Revenue reported as ‘Non-Hospital Service Agreement income’ (non-HSA income) is being generated outside the hospital service agreement that provides funding agreed with DH. As it is generated by the hospital, non-HSA income is also referred to as ‘self-generated’ revenue.
Self-generated revenue can come from many sources such as commercial diagnostic services, cafeteria services, facility fees paid by private practitioners and car parking fees. It provides hospitals with added flexibility when managing service delivery budgets, and supplements the income generated from typical government sources in times of increasing budgetary pressure.
In 2011–12, 83 of 87 Victorian public hospitals (95 per cent) generated revenue from non-HSA sources. Income from non-HSA sources in 2011–12 totalled approximately $1.4 billion ($1.2 billion in 2010–11), or 12 per cent of total revenue (11 per cent of total revenue in 2010–11) generated across the entire public hospital sector. This composition has remained consistent over the past five years. Eighty per cent of hospitals that generate this type of income are actively looking to increase their percentage of income from non-HSA sources.
Accordingly, the adequacy of the related policies, management practices and governance and oversight are important and are likely to become more so as hospitals increase their levels of non-HSA income.
Aside from state government capital grants that provided 31 per cent of total non-HSA income generated during 2011–12, the four most significant sources of non-HSA income over the past five years were private practice fees, car park fees, research funding and donations. These four sources generated approximately 25 per cent of total non-HSA income in 2011–12.
Figure 5F provides the composition of non-HSA income sources for 2011–12.
Figure 5F
Non-HSA income composition, 2011–12
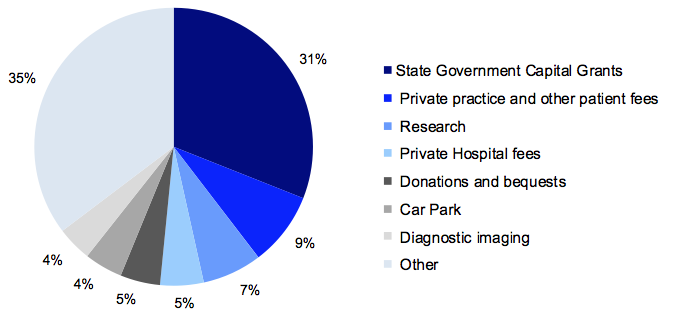
Source: Victorian Auditor-General’s Office.
5.5.1 Self-generated revenue framework
Figure 5G outlines the key components of an effective revenue framework. It draws on the Standing Directions of the Minister for Finance under the Financial Management Act 1994. It provides a comprehensive approach to managing revenue.
Figure 5G
Key elements of an effective revenue framework
|
Component |
Key elements |
|---|---|
|
Policy |
Revenue policy established and includes:
Policy reviewed and approved by the board. Policy reviewed regularly. |
|
Management practices |
Adherence to revenue policies. Actual or perceived conflicts of interest identified and declared. Rigorous budget setting process. Revenue processed accurately and in a timely manner. Regular monitoring of budget to actuals. Ensuring adequate segregation of duties is in place. Timely reconciliation process. Management review of policies, practices and processes. Comprehensive and regular reporting to executive and board. |
|
Governance and oversight |
Monitoring compliance with policy requirements. Reviewing performance of revenue streams. Policies and procedures are regularly reviewed, updated and approved by the governing body or subcommittee. Providing direction to management on opportunities and areas of concern. Engaging internal audit to review policy compliance and processes. |
Source: Victorian Auditor-General’s Office.
We considered these elements in assessing the self-generated revenue processes in the 87 public hospitals.
The self-generated revenue frameworks across the sector were adequate overall. While only a few hospitals had specific self-generated revenue policies in place and many did not have regular internal audit reviews of self-generated revenue sources, management and governance oversight was strong with the majority of entities implementing effective monitoring.
5.5.2 Policies
It is important that hospitals have adequate policies and procedures in place to document the type of revenue to be sought, and the required method for recording and controlling each of these sources. Good governance suggests that all hospitals with significant sources of self-generated revenue—which are recorded differently to normal revenue—should have a specific policy to cover each source of revenue.
Existence and review of policies
Of the 83 hospitals with self-generated revenue, 12 (14 per cent) had a policy for each revenue source. A further 19 maintained separate policies for significant sources of self-generated revenue.
The remaining 52 hospitals (63 per cent) did not have documented policies or procedures for self-generated revenue sources. Of these 52, only 11 identified an intention to implement such a policy.
The risks associated with not having a specific policy in place for self-generated revenue have been partly mitigated by hospitals having general revenue and cash handling policies in place that cover billing and collection, as well as maintaining strong management oversight and reporting functions.
Where policies were in place for sources of self-generated revenue, the governing body had approved the policy in 77 per cent of cases. Of the policies that had been approved by the board, 94 per cent had been approved or reviewed in the past three years.
5.5.3 Management practices
Internal controls
Segregation of duties in relation to self-generated revenue sources was satisfactory at 82 of 83 hospitals (99 per cent) with this type of income. Self-generated revenue sources were also regularly reconciled at 79 of the 83 hospitals (95 per cent).
Monitoring was adequate across each of the 83 public hospitals with self-generated revenue. Forty-five of these hospitals (54 per cent) had a designated officer directly responsible for overseeing these income sources, while the remaining hospitals relied on their general revenue monitoring processes.
Reporting
Reporting of self-generated revenue was strong across the sector, with most hospitals providing monthly information to both the board and the chief finance officer or finance manager. Figure 5H highlights the various lines of reporting for each of the hospital sectors.
Figure 5H
Lines of reporting
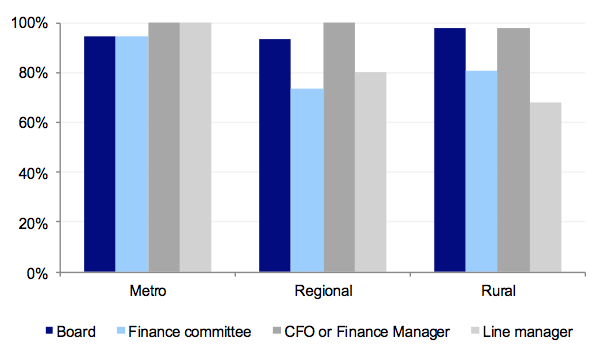
Source: Victorian Auditor-General’s Office.
As shown in Figure 5H, the vast majority of hospitals had strong management reporting practices in place.
5.5.4 Governance and oversight
Use of Hospital Service Agreement revenue for self-generated revenue purposes
Sound governance and oversight by the board (or their delegated authority) should provide direction to management on what sources of self-generated revenue can be pursued and the best allocation of hospital funds. Hospital Service Agreement (HSA) funding is currently provided to hospitals based on the level of patient care provided. Accordingly it would be expected that this funding is used for patient care and not for the generation or promotion of non-HSA revenue.
Eighty-two per cent of public hospitals that generated revenue from their own sources had controls in place to prevent HSA funds being used to increase self-generated revenue activities. These methods principally included cost-centre monitoring, monthly performance reporting, detailed budget setting and review of year-to-date amounts.
However, 13 of the hospitals that generate non-HSA income, incurred more expenditure (after excluding depreciation and finance costs) in relation to self‑generated services, than they generated from them. In these cases, management should reconsider the viability of such activities and the appropriateness of continuing to fund them.
Monitoring of compliance and performance
Forty-seven of the 83 public hospitals (57 per cent) with self-generated revenue had direction from the board on what it deemed an acceptable source of ancillary income.
Management at 61 hospitals also received guidance on how to deal with real or perceived conflicts of interest in relation to the generation of this type of income.
Internal audit program
Forty-four of the 83 hospitals (53 per cent) had some form of internal audit over significant sources of self-generated revenue in the past three years. The internal audits identified high- or moderate-risk issues with the processes in place in 23 of the 44 hospitals. In each instance, the issues were appropriately dealt with by management in a timely manner.
Internal audit programs of only 41 of the 83 hospitals (49 per cent) indicated that internal audit was planning to review the controls around self-generated revenue sources.
Recommendations
That public hospitals:
- assess policies and practices against the identified general internal control weaknesses to determine the adequacy of their controls, and whether they are operating reliably, efficiently and effectively
- address instances of noncompliance of audit committee composition with the Minister for Finance’s Standing Directions
- develop capital project management policies tailored to the scope and size of their capital expenditure programs and submit them to the board for approval and regular review
- develop policies for self-generated revenue and submit them to the board for approval and regular review
- set and report against key capital project milestones and key performance indicators regularly to the board
- conduct and distribute post-project evaluations in order to facilitate improvements in processes
- enhance use of internal audit, to review capital project and self-generated revenue policies, procedures and practices.
Appendix A. VAGO reports on the results of financial audits
This report is second of six reports to be presented to Parliament covering the results of our audits of public sector financial reports. The reports are outlined in Figure A1.
Figure A1
VAGO reports on the results of the 2011–12 financial audits
Report |
Description |
|---|---|
Auditor-General’s Report on the Annual Financial Report of the State of Victoria, 2011–12 |
The report provided the result of the audit of the state’s annual financial report. It addressed the quality and timeliness of financial reporting, explained significant financial results for the state and financial implications of significant projects and developments that occurred during 2011–12 and subsequent to year end. Tabled in Parliament on 14 November 2012. |
Public Hospitals: Results of the 2011–12 Audits This report |
The report provides the results of the audits of approximately 110 entities, addresses the timeliness of their financial reporting, their financial sustainability, reviewed the operations of their audit committees, aspects of how they managed capital projects and analysed self-generated hospital revenue. Tabled in Parliament on 14 November 2012. |
Water Entities: Results of the 2011–12 Audits |
This report provides the results of the audits of 20 entities and addresses the timeliness of their financial and performance reporting, their financial sustainability, aspects of how they manage risks and an analysis of water tariff revenue. Tabled in Parliament on 14 November 2012. |
Portfolio Departments and Associated Entities: Results of the 2011–12 Audits |
The report will provide the results of the annual financial statement audits of approximately 210 entities. The report will comment on the timeliness of their financial reporting, financial sustainability and reporting developments, and aspects of how the departments manage risks, appropriations and trust funds. Proposed to be tabled in Parliament in November 2012. |
Local Government: Results of the 2011–12 Audits |
The report will provide the results of the audits of approximately 100 entities in the local government sector. The report will address the timeliness of their financial and performance reporting, their financial sustainability, and aspects of how they manage their budget processes and outsourced arrangements. Proposed to be tabled in Parliament in November 2012. |
Tertiary Education and Other Entities: Results of the 2012 Audits |
The report will provide the results of the annual financial audits of approximately 120 entities with a financial year other than 30 June 2012. The report will address the timeliness of their financial and performance reporting, their financial sustainability, a review of their utilisation of internal audit, and credit card security controls and usage. Proposed to be tabled in Parliament in May 2013. |
Source: Victorian Auditor-General’s Office.
Appendix B. Completed audit listing
Metropolitan hospitals and associated entities
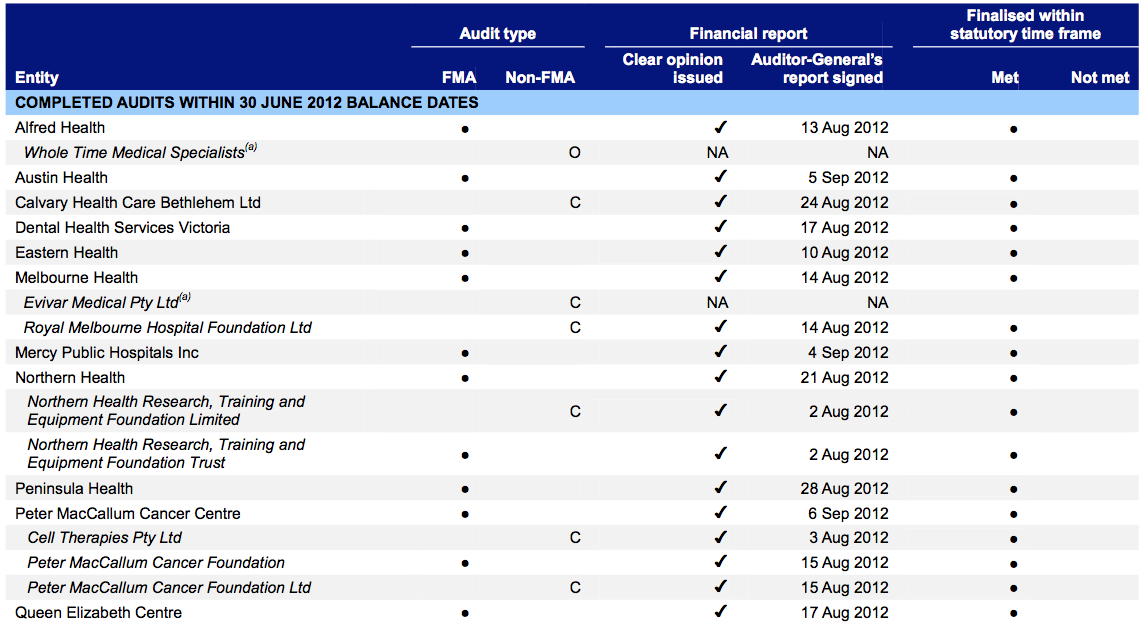
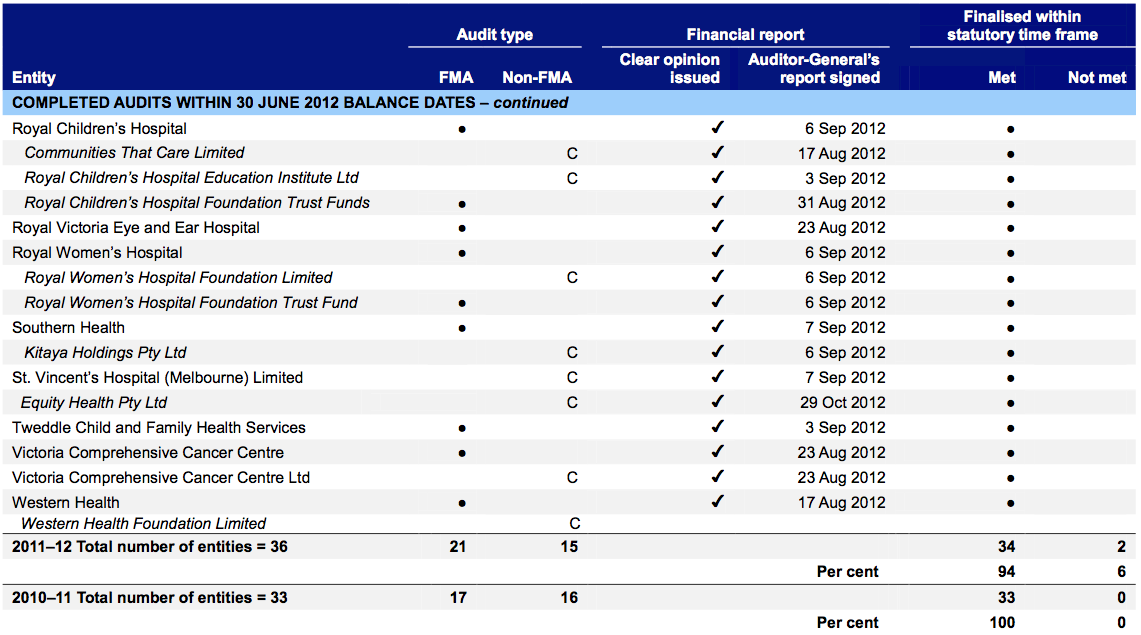
(a) At the date of this report, the financial audit of this entity was not complete and was not included as part of the statutory time frame metric.
Note: Non-FMA audit types: C – Corporations Act 2001 and O – other reporting framework.
Source: Victorian Auditor-General’s Office.
Regional hospitals and associated entities
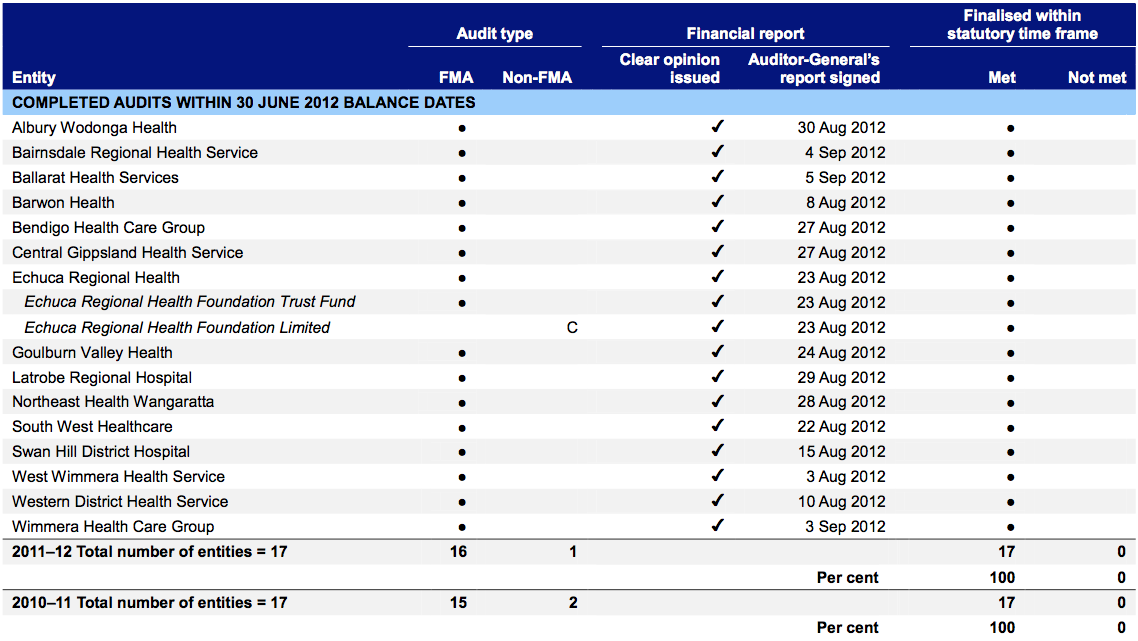
Note: Non-FMA audit types: C – Corporations Act 2001 and O – other reporting framework.
Source: Victorian Auditor-General’s Office.
Rural hospitals and associated entities
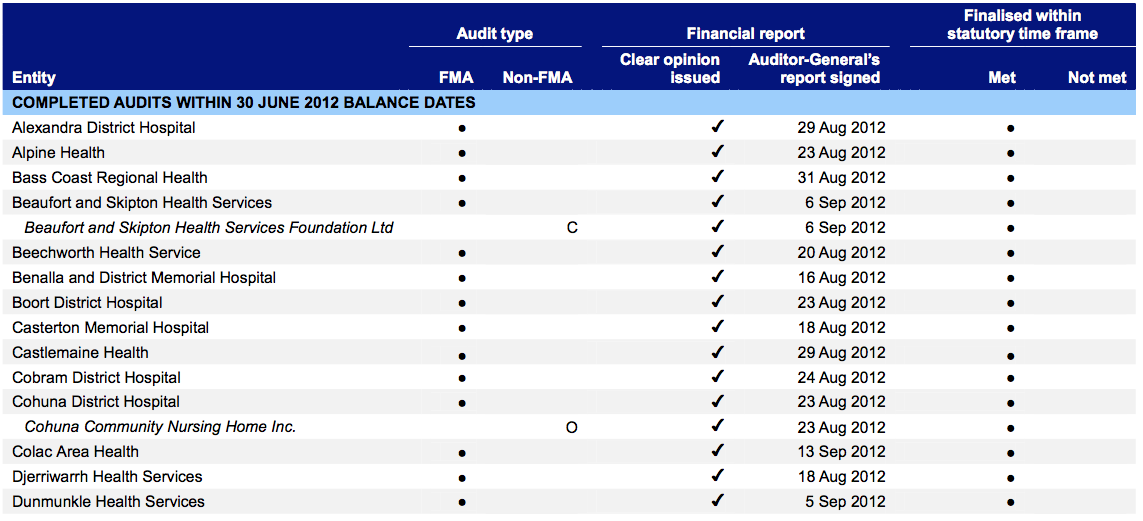
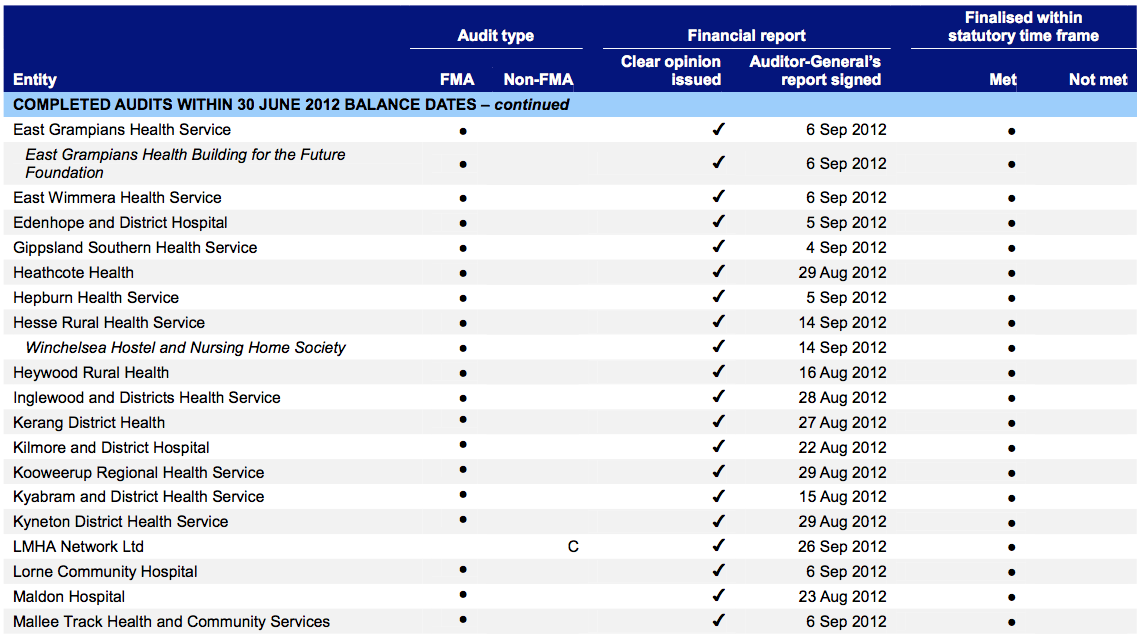
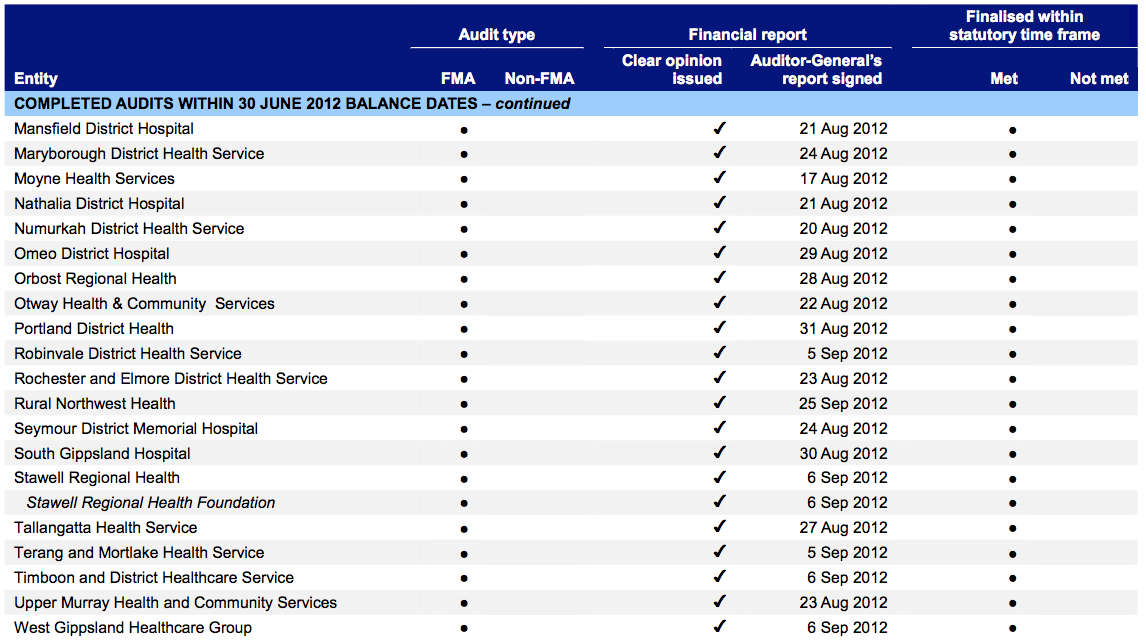
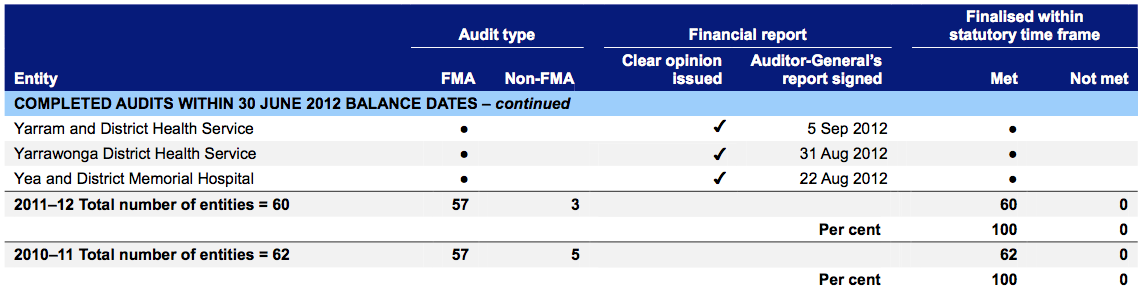
Note: Non-FMA audit types: A – Associations Incorporation Act 1981, C – Corporations Act 2001 and O – other reporting framework.
Source: Victorian Auditor-General’s Office.
Appendix C. Financial sustainability indicators and criteria
Indicators of financial sustainability
This Appendix sets out the financial indicators used in this report. The indicators should be considered collectively and are more useful when assessed over time, as part of a trend analysis. The indicators have been applied to the published financial information of the 87 public hospitals for the five year period 2007–08 to 2011–12.
The analysis of financial sustainability in this report reflects on the position of each individual hospital, the sector as a whole and on the basis of the three categories of public hospital—metropolitan, regional and rural.
The financial sustainability indicators are outlined in Figure C1.
Figure C1
Financial sustainability indicators
|
Indicator |
Formula |
Description |
|---|---|---|
|
Underlying result (%) |
Adjusted net result / Total underlying revenue |
A positive result indicates a surplus, and the larger the percentage, the stronger the result. A negative result indicates a deficit. Operating deficits cannot be sustained in the long term. Underlying revenue does not take into account one-off or non-recurring transactions. Net result and total underlying revenue is obtained from the comprehensive operating statement. |
|
Liquidity (ratio) |
Current assets / Current liabilities |
This measures the ability to pay existing liabilities in the next 12 months. A ratio of one or more means there are more cash and liquid assets than short-term liabilities. Current liabilities exclude long-term employee provisions and revenue in advance. |
|
Average number of days cash available (days) |
Unrestricted cash / (Total annual operating cash outflows / 365) |
This measures the number of days of operating expenses that a hospital could pay with its current cash available. Unrestricted cash available includes cash equivalents that can be easily converted to cash and excludes cash held where the use has been restricted–such as patient money held in trust or cash required to be used for a specific purpose. |
|
Self-financing (%) |
Net operating cash flows / Total underlying revenue |
This measures the ability to replace assets using cash generated by the entity’s operations. The higher the percentage the more effectively this can be done. Net operating cash flows are obtained from the cash flow statement. |
|
Capital replacement (ratio) |
Cash outflows for property, plant and equipment / Depreciation |
Comparison of the rate of spending on infrastructure with an entity’s depreciation. Ratios higher than 1:1 indicate that spending is greater than the depreciating rate. This is a long-term indicator, as capital expenditure can be deferred in the short term if there are insufficient funds available from operations, and borrowing is not an option. Cash outflows for infrastructure are taken from the cash flow statement. Depreciation is taken from the comprehensive operating statement. |
Source: Victorian Auditor-General’s Office.
Financial sustainability risk assessment criteria
The financial sustainability of public hospitals has been assessed using the risk assessment criteria outlined in Figure C2.
Figure C2
Financial sustainability indicators–risk assessment criteria
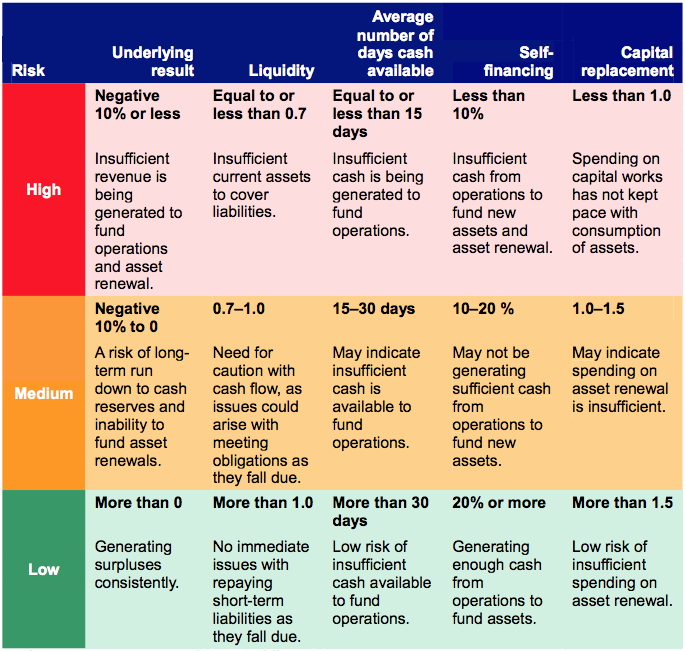
Source: Victorian Auditor-General’s Office.
The overall financial sustainability risk assessment is calculated using the ratings determined for each indicator as outlined in Figure C2. This assessment is performed at the sector level, at the metropolitan, regional and rural category level and at the individual hospital level.
Figure C3
Overall financial sustainability risk assessment
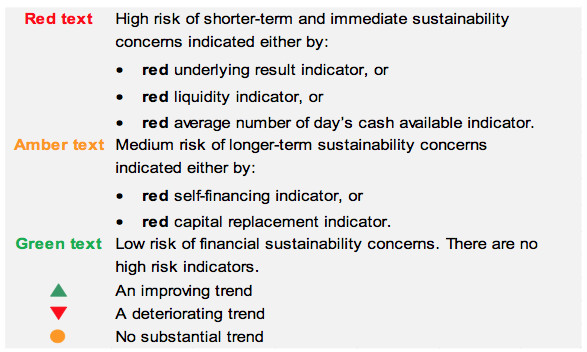
Source: Victorian Auditor-General’s Office.
To be financially sustainable, hospitals must be able to meet their short-term financial obligations, and maintain some excess capacity to finance future capital and infrastructure development. As detailed in Figure C3, shorter-term and immediate sustainability concerns are assessed as high risk, and longer-term sustainability concerns are assessed as medium risk.
Metropolitan hospitals
Figure C4
Underlying result 2008–2012
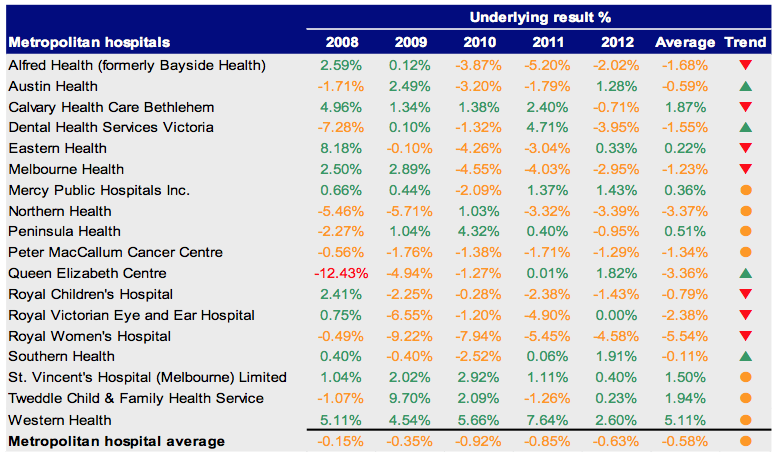
Source: Victorian Auditor-General’s Office.
Figure C5
Liquidity 2008–2012
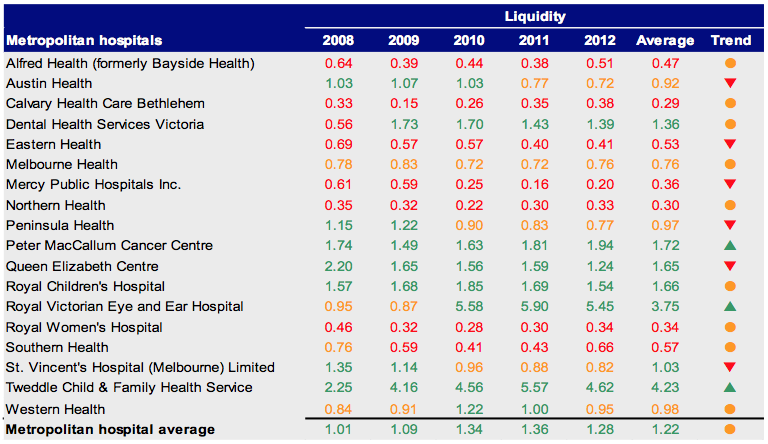
Source: Victorian Auditor-General’s Office.
Figure C6
Average number of days cash available 2008–2012
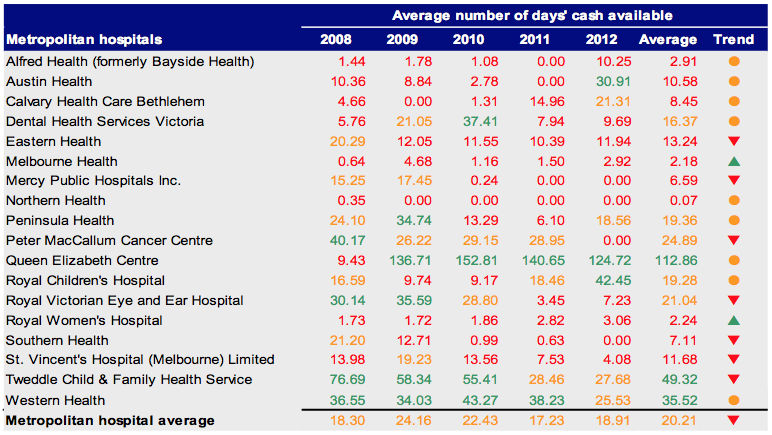
Source: Victorian Auditor-General’s Office.
Figure C7
Self-financing 2008–2012
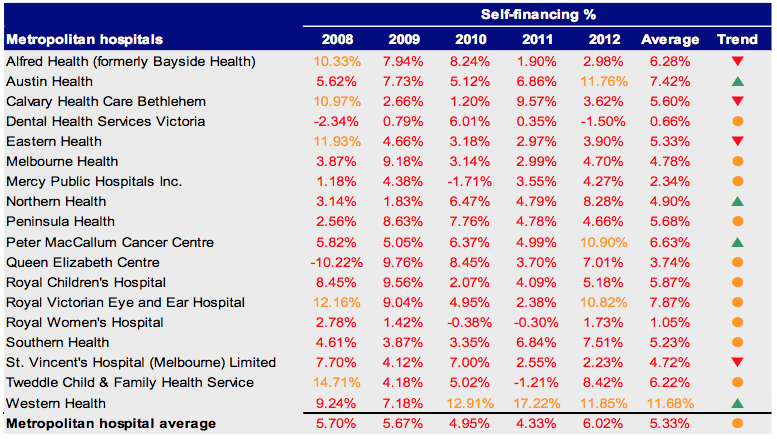
Source:Victorian Auditor-General’s Office.
Figure C8
Capital replacement 2008–2012
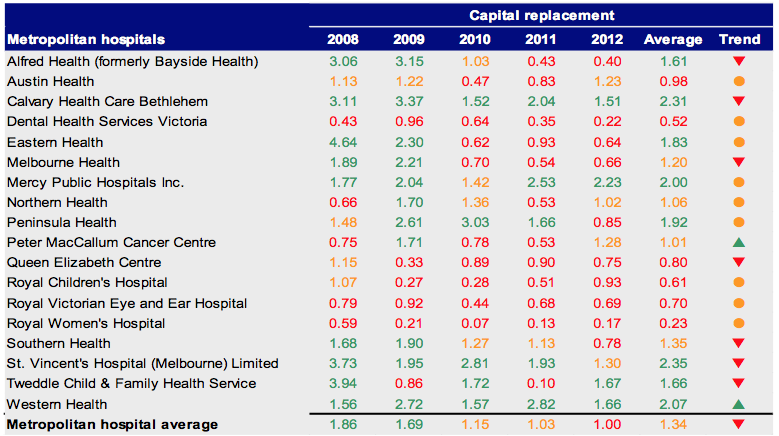
Source: Victorian Auditor-General’s Office.
Regional Hospitals
Figure C9
Underlying result 2008–2012
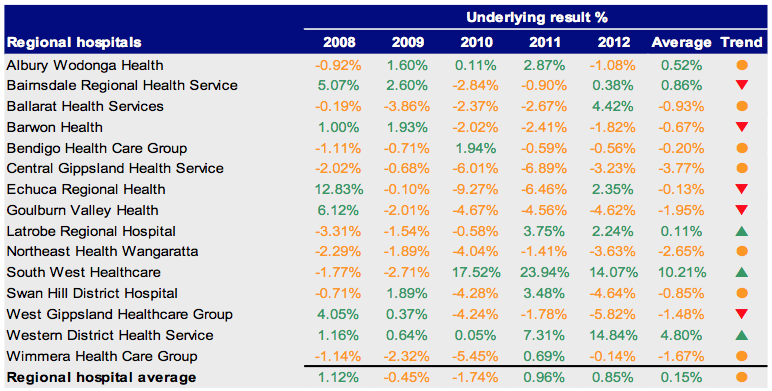
Source: Victorian Auditor-General’s Office.
Figure C10
Liquidity 2008–2012
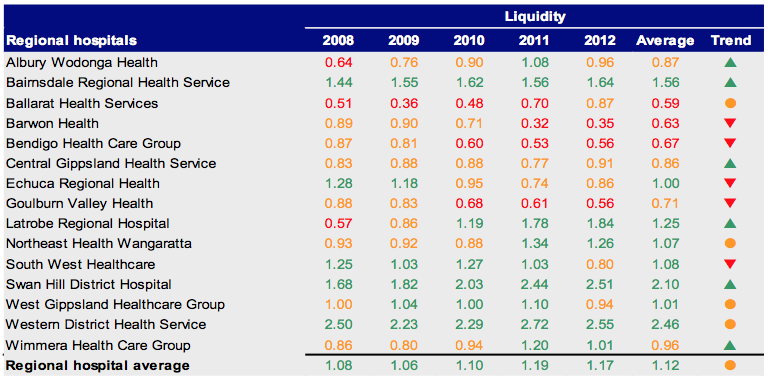
Source: Victorian Auditor-General’s Office.
Figure C11
Average number of days cash available 2008–2012
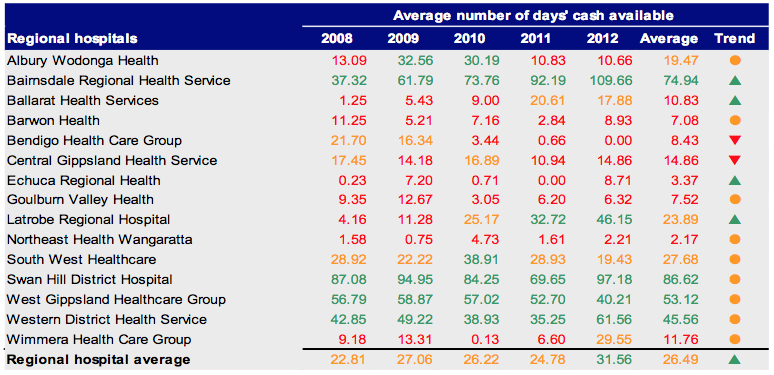
Source: Victorian Auditor-General’s Office.
Figure C12
Self-financing 2008–2012
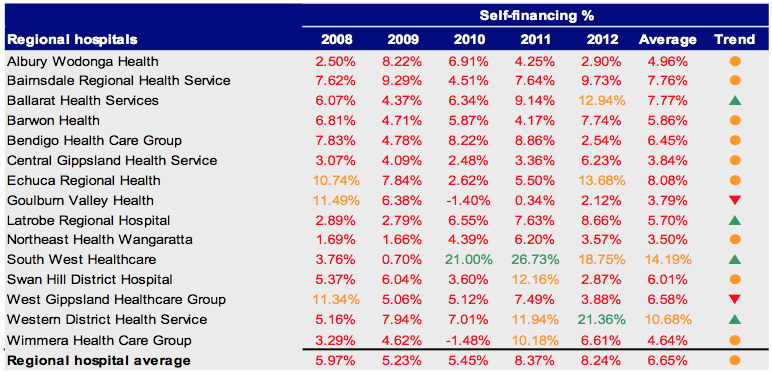
Source: Victorian Auditor-General’s Office.
Figure C13
Capital replacement 2008–2012
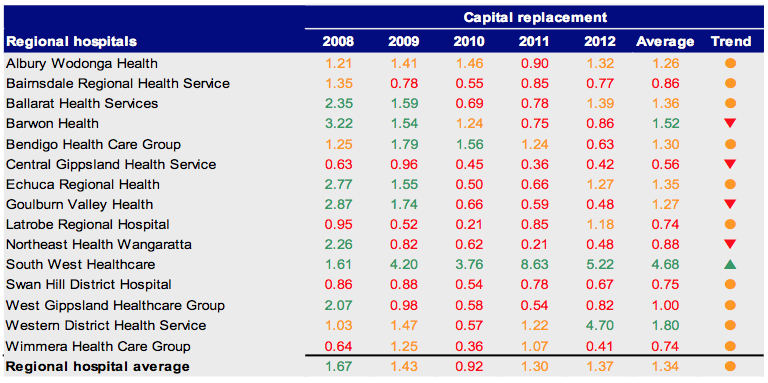
Source: Victorian Auditor-General’s Office.
Rural Hospitals
Figure C14
Underlying result 2008–2012
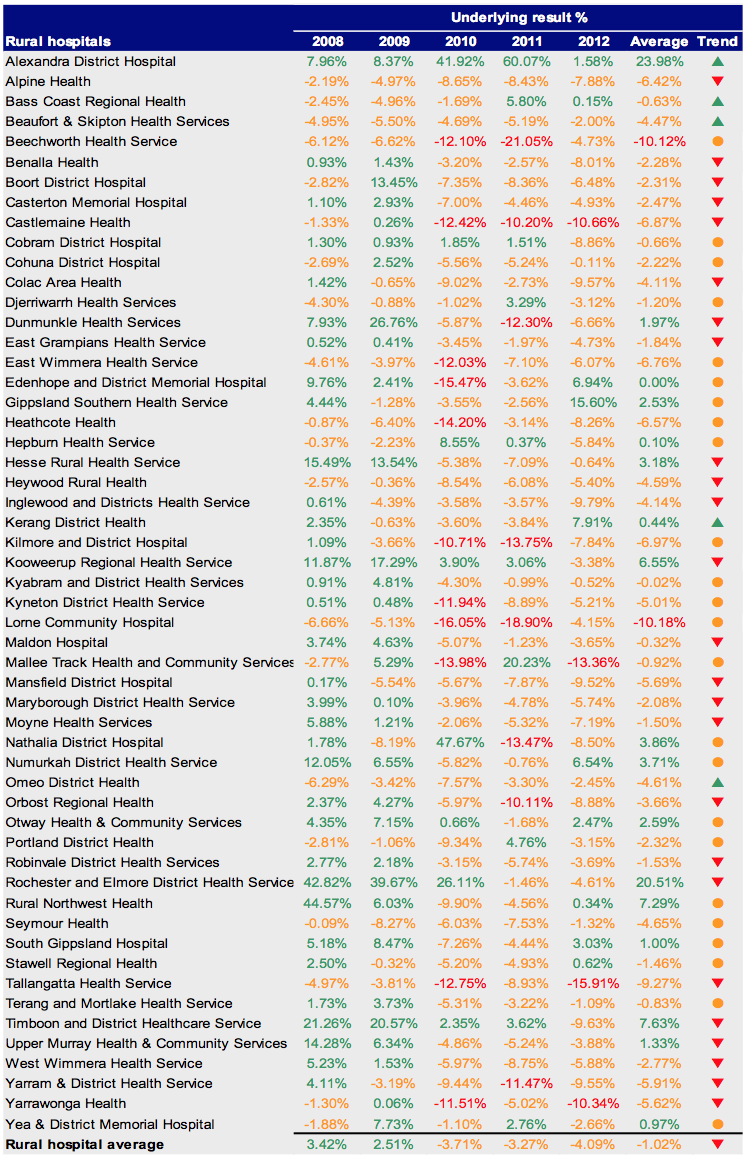
Source: Victorian Auditor-General’s Office.
Figure C15
Liquidity 2008–2012
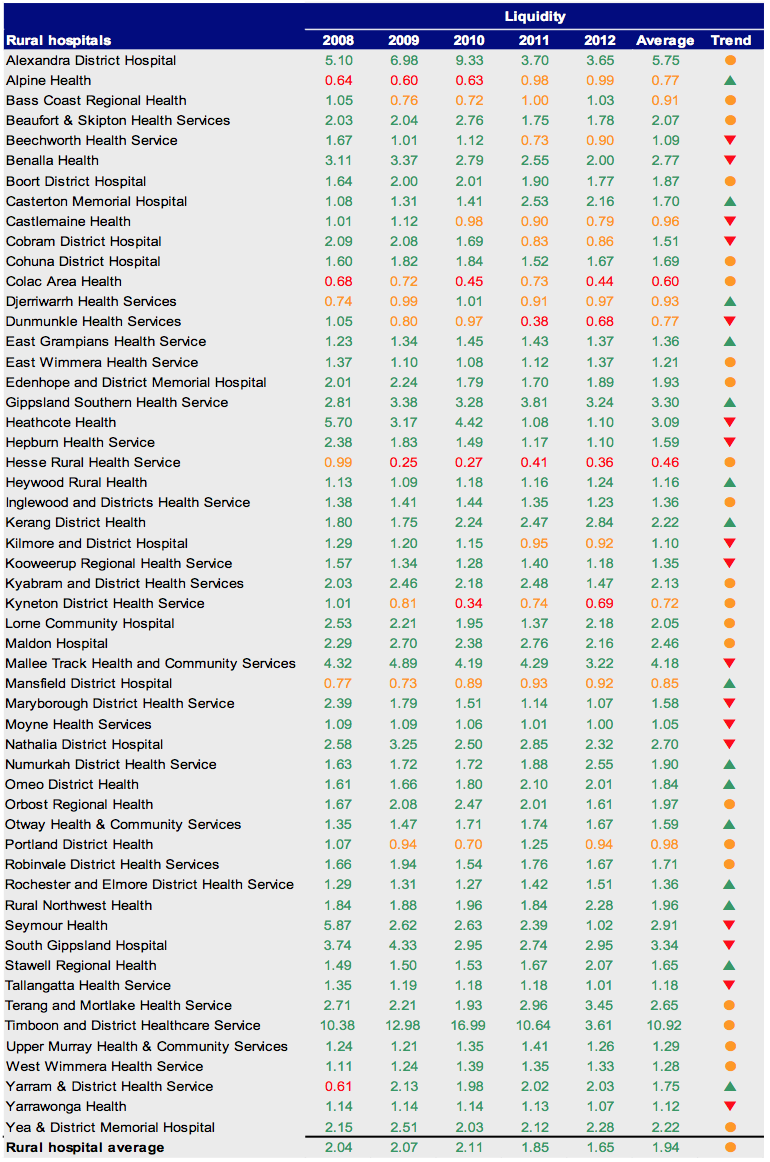
Source: Victorian Auditor-General’s Office.
Figure C16
Average number of days cash available 2008–2012
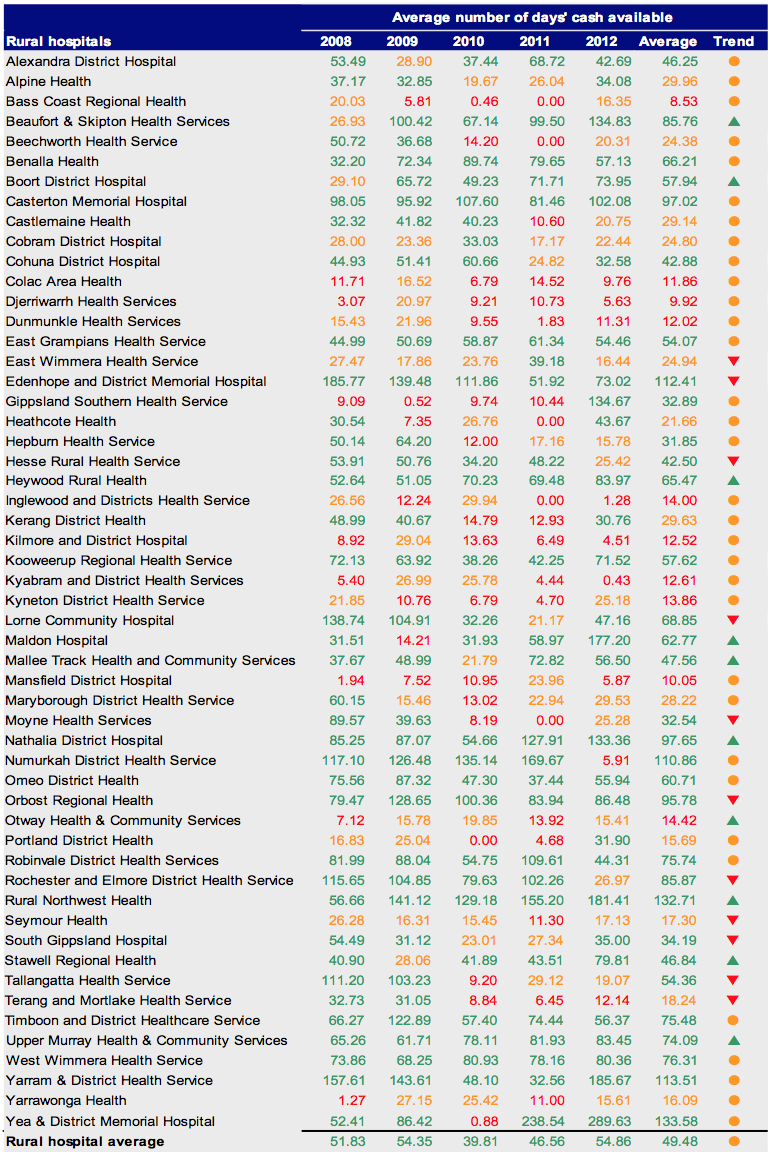
Source: Victorian Auditor-General’s Office.
Figure C17
Self-financing 2008–2012
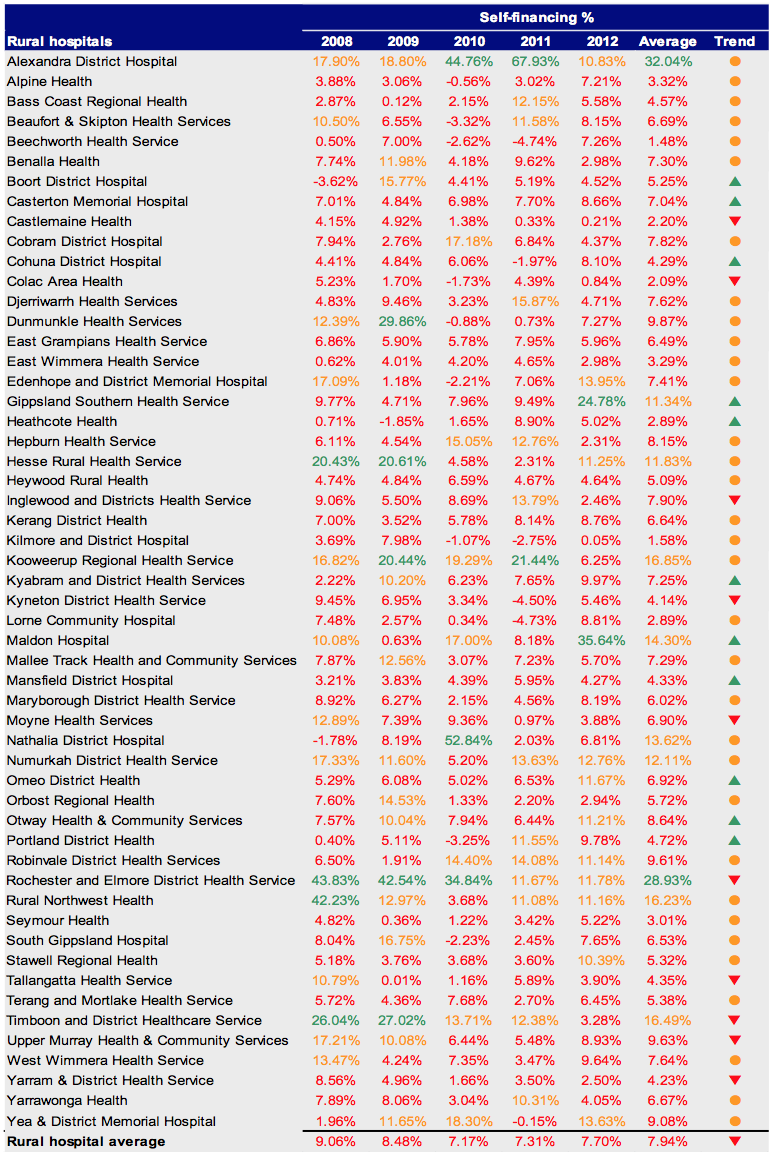
Source: Victorian Auditor-General’s Office.
Figure C18
Capital replacement 2008–2012
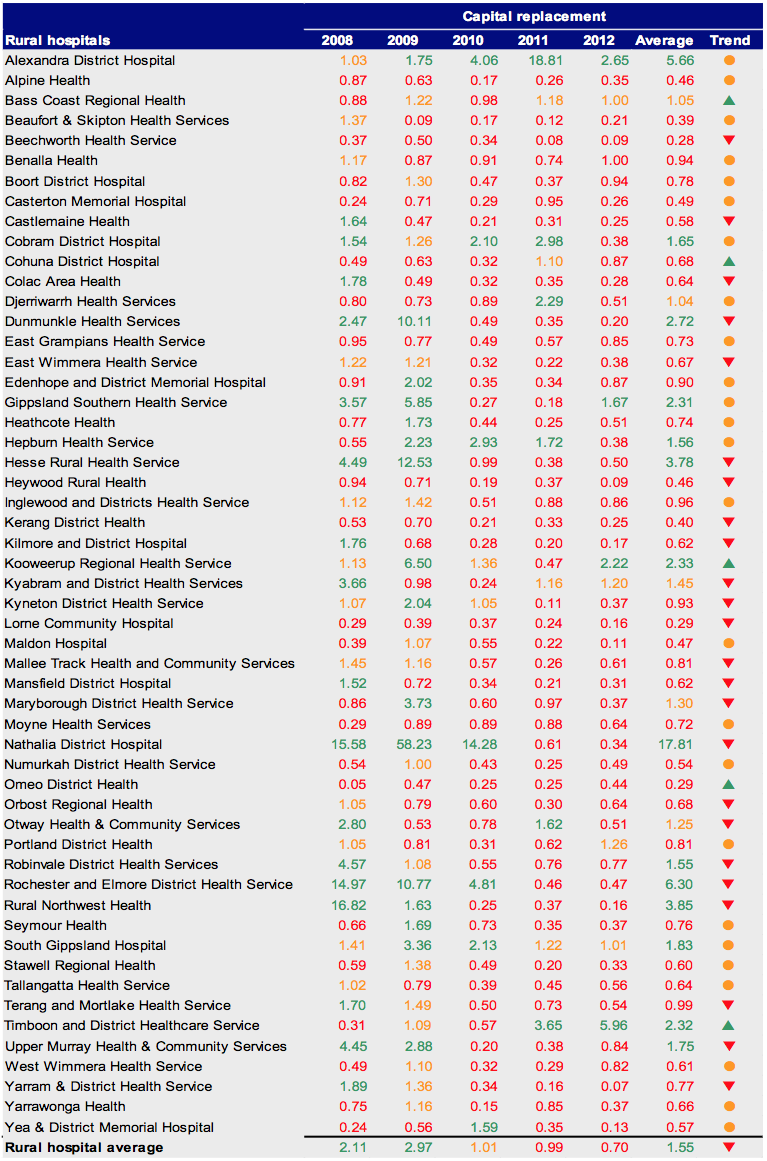
Source: Victorian Auditor-General’s Office.
Appendix D. Glossary
Accountability
Responsibility of public sector entities to achieve their objectives, with regard to reliability of financial reporting, effectiveness and efficiency of operations, compliance with applicable laws, and reporting to interested parties.
Acquisition
Establishing control of an asset, undertaking the risks, and receiving the rights to future benefits, as would be conferred with ownership, in exchange for the cost of acquisition.
Asset useful life
The period over which an asset is expected to provide the entity with economic benefits. Depending on the nature of the asset, the useful life can be expressed in terms of time or output.
Asset valuation
The fair value of a non-current asset on a particular date.
Asset
A resource controlled by an entity as a result of past events, and from which future economic benefits are expected to flow to the entity.
Audit Act 1994
An Act of the State of Victoria that establishes the:
- operating powers and responsibilities of the Auditor-General
- the operation of his office – the Victorian Auditor-General’s Office (VAGO)
- nature and scope of audits conducted by VAGO
- relationship of the Auditor-General with the Public Accounts and Estimates Committee as the representative body of Parliament
- Auditor-General’s accountability to Parliament for discharge of the position’s responsibilities.
Auditor’s opinion
Written expression within a specified framework indicating the auditor’s overall conclusion on the financial (and performance) reports based on audit evidence obtained.
Capital expenditure
Amount capitalised to the balance sheet for contributions by a public sector entity to major assets owned by the entity, including expenditure on:
- capital renewal of existing assets that returns the service potential or the life of the asset to that which it had originally
- capital expansion which extends an existing asset at the same standard to a new group of users.
Capital grant
Government funding given to an agency for the purpose of acquisition of capital assets such as buildings, land or equipment.
Clear audit opinion
A positive written expression provided when the financial report has been prepared and presents fairly the transactions and balances for the reporting period in accordance with the requirements of the relevant legislation and Australian accounting standards.
Also referred to as an unqualified audit opinion.
Contributions from the state
Transactions in which one public sector entity provides goods, services, assets (or extinguishes a liability) or labour to another public sector entity without receiving approximately equal value in return. Grants can either be of a current or capital nature.
Deficit
Total expenditure exceeds total revenue resulting in a loss.
Depreciation
The systematic allocation of a fixed asset’s capital value as an expense over its expected useful life to take account of normal usage, obsolescence, or the passage of time.
Employee leave liabilities
Employees’ accrued service entitlements, including all accrued costs related to employment comprising of wages and salaries, leave entitlements, redundancy payments and superannuation contributions.
Entity
A body whether corporate or unincorporated that has a public function to exercise on behalf of the state or is wholly owned by the state, including: departments, statutory authorities, statutory corporations and government business enterprises.
Equity or net assets
Residual interest in the assets of an entity after deduction of its liabilities.
Expense
Outflows or other depletions of economic benefits in the form of incurrence of liabilities or depletion of assets of the entity, other than those relating to contributions by owners, that results in a decrease in equity during the reporting period.
Financial Management Act 1994
An Act of the State of Victoria that establishes the financial administration and accountability of the public sector, as well as annual reporting to the Parliament by all departments and public sector entities.
Financial report
Structured representation of the financial information, which usually includes accompanying notes, derived from accounting records and intended to communicate an entity’s economic resources or obligations at a point in time or the changes therein for a period in accordance with a financial reporting framework.
Financial reporting direction
A direction issued by the Minister for Finance to achieve consistent application of accounting treatments across the Victorian public sector in compliance with a particular Australian Accounting Standard or Interpretation issued by the Australian Accounting Standards Board. Generally issued when a standard or interpretation provides accounting treatment options.
Financial sustainability
An entity’s ability to manage financial resources so it can meet spending commitments, both at present and into the future.
Financial year
The period of 12 months for which a financial report (and performance report) is prepared.
Going concern
An entity which is expected to be able to pay its debts as and when they fall due, and continue in operation without any intention or necessity to liquidate or otherwise wind up its operations.
Governance
The control arrangements in place at an entity that are used to govern and monitor its activities, in order to achieve its strategic and operational goals. (It includes the oversight role of the board of management at public hospitals.)
Internal audit
A function of an entity’s governance framework that examines and reports to management on the effectiveness of risk management, control and governance processes.
Independent auditors report
An expression of the independent auditor’s opinion on an entity’s financial report.
Internal control
Processes affected by an entity’s structure, work and authority flows, people and management information systems, designed to assist the entity accomplish specific goals and objectives. Internal controls are a means by which an entity’s resources are directed, monitored and measured. It plays an important role in preventing and detecting error and fraud and protecting the entity’s resources.
Investment
The expenditure of funds intended to result in medium to long-term service and/or financial benefits arising from the development and/or use of infrastructure assets by either the public or private sectors.
Liability
A present obligation of the entity arising from past events, the settlement of which is expected to result in an outflow of resources from the entity.
Masterfile
A database of records pertaining to one of the main subjects of an information system, such as customers, employees, and vendors. Masterfiles contain descriptive data that does not often change, such as name and address and bank account details.
Net assets or equity
Residual interest in the assets of the entity after deduction of its liabilities.
Net result
Calculated by subtracting an entity’s total expenses from its total revenue, to show what the entity has earned or lost in a given period of time.
Other contributions
Transactions in which one non-government entity provides goods, services, assets (or extinguishes a liability) or labour to another non-government entity without receiving approximately equal value in return. Grants can either be of a current or capital nature.
Public private partnership
A public private partnership (PPP) is a long-term contract between the public and private sectors where government pays the private sector to deliver infrastructure and related services on behalf, or in support, of government’s broader service responsibilities. PPPs typically make the private sector parties who build infrastructure responsible for its condition and performance on a whole-of-life basis.
Revaluation
Recognising a reassessment of values for non-current assets at a particular point in time.
Revenue
Inflows of funds or other enhancements or savings in outflows of service potential, or future economic benefits in the form of increases in assets or reductions in liabilities of the entity, other than those relating to contributions by owners which result in an increase in equity during the reporting period.
Risk
The chance of a negative impact on the objectives, outputs or outcomes of the entity.
Stakeholder
A person, group, or organisation that has direct or indirect stake in an organisation because it can affect or be affected by the organisation’s actions, objectives and policies.
Surplus
Total revenue exceeds total expenditure resulting in a profit.
Wage on-costs
The additional costs incurred as a consequence of employing personnel. Examples include workcover, payroll tax and superannuation contributions.
Appendix E. Audit Act 1994 section 16—submissions and comments
In accordance with section 16(3) of the Audit Act 1994 a copy of this report, or relevant extracts from the report, was provided to the Department of Health and named hospitals with a request for submissions or comments.
The submission and comments provided are not subject to audit nor the evidentiary standards required to reach an audit conclusion. Responsibility for the accuracy, fairness and balance of those comments rests solely with the agency head.