Water Entities: Results of the 2011–12 Audits
Overview
This report covers the results of our financial audits of 20 entities, comprising 19 water entities and one controlled entity.
The report informs Parliament about significant issues arising from the audits of financial and performance reports and augments the assurance provided through audit opinions included in the respective entities’ annual reports.
The report comments on the quality and timeliness of financial and performance reporting, the financial sustainability of water entities and the effectiveness of internal controls over risk management and water tariff revenue.
Parliament can have confidence in the adequacy of financial and performance reporting and the internal controls of the entities audited.
Six entities were rated a high financial sustainability risk at 30 June 2012 due to the magnitude of their operating losses. An analysis of the trends in the financial sustainability indicators shows a deteriorating position for the industry over the five years to 2011–12.
The internal controls were adequate for producing reliable, accurate and timely financial reports. However, controls over information technology, fixed assets, revenue and accounts receivable, payroll and reconciliations can be improved. A number of internal control weaknesses reported to management of 10 entities in 2010–11 or earlier are yet to be resolved by management.
Risk management practices are considered mature with all entities regularly reporting to their governing bodies on risk management matters.
There were adequate internal controls over water tariff revenue. However, poor security controls over point of sale technology and noncompliance with the requirements for processing of credit and debit card payments increases the risk of identity theft and fraud.
Water Entities: Results of the 2011–12 Audits: Message
Ordered to be printed
VICTORIAN GOVERNMENT PRINTER November 2012
PP No 194, Session 2010–12
President
Legislative Council
Parliament House
Melbourne
Speaker
Legislative Assembly
Parliament House
Melbourne
Dear Presiding Officers
Under the provisions of section 16AB of the Audit Act 1994, I transmit my report on Water Entities: Results of the 2011–12 Audits.
Yours faithfully

D D R PEARSON
Auditor-General
14 November 2012
Audit summary
This report presents the results of our financial audits of 20 entities, comprising 19 water entities and one controlled entity. It provides a detailed analysis of financial and performance reporting, their internal controls, financial results and sustainability.
Clear audit opinions were issued on 19 financial reports for the financial year-ended 30 June 2012. At 2 November 2012 the financial report of Watermove was yet to be finalised.
Clear audit opinions were issued on all 16 performance reports for the year.
Conclusion
Notwithstanding some areas for improvement, Parliament can have confidence in the adequacy of financial and performance reporting and the internal controls of the entities audited.
Findings
Financial results and sustainability
The 19 water entities generated a combined net profit before income tax of $605 million for the year-ended 30 June 2012, an increase of $195 million or 48 per cent from the prior year, predominantly due to increased service and usage charges. Dividend payments to the state government increased by $198 million or 278 per cent in 2011–12.
The four metropolitan water entities continue to generate strong profits year-on-year. However, four of the 13 regional urban water entities (31 per cent) reported a lower net profit before tax in 2011–12 relative to the prior year and eight reported a net loss before tax (five in 2010–11). The two rural water entities continue to report losses.
Most entities are in the low- and medium-risk categories for financial sustainability, however, the data shows a deteriorating trend for the industry as a whole over the five‑year period to 2011–12. The number of entities with a poor underlying result has doubled over the five-year period while the liquidity ratio has shown no sign of improvement in recent years. While the interest cover ratio is strong for many entities, indicating they are able to service their interest payments, the debt service cover for two metropolitan water entities indicates their ability to repay debt is low. Due to the overbilling issue of 2011–12 following delays with commissioning of the desalination plant, the 2012–13 price freeze will impact revenue and operating cash flows of the metropolitan water entities in the short term. In turn this further impacts their ability to repay debt.
Our analysis of capital expenditure for the period 2008–09 to 2011–12 revealed that actual expenditure is likely to differ from the regulatory target as outlined in the Essential Service Commission price determinations. Therefore the prices levied may result in significant under or over recovery of costs by the water entities during the regulatory period.
Performance reporting
The absence of targets continues to reduce the usefulness of performance reports because a comparison of actual performance against targets cannot be made.
A performance reporting working group was established in 2011–12 to develop a consistent and contemporary performance reporting framework for the water industry. Its intention is that the new performance reporting framework will apply from 1 July 2013.
Internal controls
The internal controls were adequate for producing reliable, accurate and timely financial reports. Nevertheless, a number of areas for improvement were identified.
Information technology control weaknesses were identified at 53 per cent of entities (10 of 19) which is concerning given the sensitivity of information captured by the entities, and the heavy reliance on information systems.
A number of internal control weaknesses reported to management of 10 entities in 2010–11 or earlier are yet to be resolved by management. The governing bodies need to take more timely action to rectify this situation and to demonstrate a commitment to ensuring sound internal controls are in place and that they are operating effectively.
Risk management practices are considered mature with all entities regularly reporting to their governing bodies on risk management matters.
Overall, there were adequate internal controls over water tariff revenue. However, poor security controls over point of sale technology and noncompliance with the requirements for processing of credit and debit card payments increases the risk of identity theft and fraud.
Recommendations
- 1 & 2. Water entities should further refine their financial and performance reporting processes by developing plans, preparing shell statements, performing materiality assessments, conducting analytical and compliance reviews, having adequate security to protect and safeguard sensitive information and improving their quality assurance processes.
- 3. The performance reporting working group should continue to develop and implement a consistent and contemporary performance reporting framework, in line with its time lines and our proposed expanded opinions from 2013–14.
- 4. Water entities should set targets for all indicators in their performance reports to enable meaningful assessment of performance.
- 5. The Essential Services Commission should revisit the duration of the water plans and the funding model's flexibility to deal with situations where the actual financial outcomes differ significantly from what was proposed in the approved water plans due to changed circumstances and/or environmental conditions.
Water entities should:
- 6. assess their policies and procedures against the common general internal control weaknesses and the better practices identified, and act in a timely manner to address shortcomings
- 7. take timely action to address identified information technology, fixed assets, payroll, billings system and accounts receivable and general ledger reconciliation control weaknesses
- 8. address long outstanding internal control weaknesses immediately, to demonstrate a commitment to management's responsibilities for ensuring sound internal controls are in place and are operating effectively
- 9. strengthen their oversight of credit notes by generating reports that detail the number and dollar value, key reason, action taken or planned and a trend analysis
- 10. develop and maintain comprehensive credit/debit card policies and procedures which are appropriately approved and subject to regular review
- 11. assess compliance against the requirements of the Payment Card Industry–Data Security Standard and act quickly to achieve compliance in order to protect the security of customer credit and debit card information and data
- 12. change the default security settings on their key information systems and databases, including point of sale systems, immediately.
Submissions and comments received
In addition to progressive engagement during the course of the audit, in accordance with section 16(3) of the Audit Act 1994 a copy of this report, or relevant extracts from the report, was provided to the Department of Treasury and Finance, the Department of Sustainability and Environment, the Essential Services Commission, VicWater and the 20 entities with a request for submissions or comments.
Agency views have been considered in reaching our audit conclusions and are represented to the extent relevant and warranted in preparing this report. Their full section 16(3) submissions and comments however, are included in Appendix H.
1 Background
1.1 Introduction
The Victorian water industry consists of 20 entities, comprising 19 water entities and one controlled entity. All entities are wholly owned by the state. The entities are stand‑alone businesses responsible for their own management and performance. Each governing board appoints a managing director responsible for the day-to-day operating activities of the entity. An overview of the accountability arrangements of the water industry is provided in Appendix B.
The entities are expected to adopt sustainable management practices which give due regard to environmental impacts and which allow water resources to be conserved, properly managed, and sustained.
The water industry can be categorised into the metropolitan, regional urban and rural sectors. Figure 1A details the number of entities by sector.
Figure 1A
Water industry sectors
|
Sector |
Water entities |
Controlled entities |
Total |
|---|---|---|---|
|
Metropolitan |
4 |
0 |
4 |
|
Regional urban |
13 |
0 |
13 |
|
Rural |
2 |
1 |
3 |
|
Total |
19 |
1 |
20 |
Source: Victorian Auditor-General’s Office.
Figure 1B lists the legal and trading names of the 20 entities.
Figure 1B
Water entities and the controlled entity
|
Legal name |
Trading name |
|---|---|
|
Metropolitan sector |
|
|
Wholesaler |
|
|
Melbourne Water Corporation |
Melbourne Water |
|
Retailers |
|
|
City West Water Corporation South East Water Corporation Yarra Valley Water Corporation |
City West Water South East Water Yarra Valley Water |
|
Regional urban sector |
|
|
Barwon Region Water Corporation |
Barwon Water |
|
Central Gippsland Region Water Corporation |
Gippsland Water |
|
Central Highlands Region Water Corporation |
Central Highlands Water |
|
Coliban Region Water Corporation |
Coliban Water |
|
East Gippsland Region Water Corporation |
East Gippsland Water |
|
Goulburn Valley Region Water Corporation |
Goulburn Valley Water |
|
Grampians Wimmera Mallee Water Corporation |
GWMWater |
|
Lower Murray Urban and Rural Water Corporation |
Lower Murray Water |
|
North East Region Water Corporation |
North East Water |
|
South Gippsland Region Water Corporation |
South Gippsland Water |
|
Wannon Region Water Corporation |
Wannon Water |
|
Western Region Water Corporation |
Western Water |
|
Westernport Region Water Corporation |
Westernport Water |
|
Rural sector |
|
|
Gippsland and Southern Rural Water Corporation |
Southern Rural Water |
|
Goulburn-Murray Rural Water Corporation |
Goulburn-Murray Water |
|
Controlled entity |
|
|
Watermove Pty Ltd |
Watermove |
Note: Watermove is a controlled entity of Goulburn-Murray Water.
Source: Victorian Auditor-General’s Office.
This report addresses issues arising from the 2011–12 financial audits of the water industry, and augments the assurance provided through audit opinions on financial and performance reports included in the respective entities’ annual reports.
The report comments on the financial sustainability of the entities and their financial management and reporting activities. It also comments on the effectiveness of internal controls, in particular, controls over risk management and water tariff revenue.
The other VAGO reports on the results of our 2011–12 financial audits are outlined in Appendix C.
1.2 Recent water industry reform
1.2.1 Changes to the metropolitan water retailers
The metropolitan water sector comprises four entities; a wholesaler and three retailers.
The three retailers, namely City West Water, South East Water and Yarra Valley Water were established under the State Owned Enterprises Act 1992. They commenced operations on 1 January 1995 with licences issued by the Minister for Water under the Water Industry Act 1994. The retailers were also subject to the requirements of the Corporations Act 2001.
Until 30 June 2012 the three retailers were public companies, with their shares held by State Trustees Limited on behalf of the state. Their primary reporting relationship was to the Treasurer of Victoria. They were also accountable to the Minister for Water.
The Water Amendment (Governance and Other Reforms) Act 2012 (Governance Act), which received royal assent on 3 April 2012, established three new statutory authorities, City West Water Corporation, South East Water Corporation and Yarra Valley Water Corporation. These bodies are the successors in law to the former bodies.
While the legal form of the three retailers changed, effective 1 July 2012, there was no change to the boundaries, operations, functions and services of the pre-existing entities. The pre-existing property, rights and liabilities were also transferred to the new statutory corporations.
The Governance Act contained transitional provisions dealing with matters such as:
- cessation of old licensees
- appointment of members of the board of directors
- appointment of authorised water officers
- transfer of assets and liabilities
- transfer of staff
- Statement of Obligations.
The three retailers now operate under the provisions of the Water Act 1989. From a financial reporting perspective they must also comply with the requirements of the Financial Management Act 1994 and the Financial Reporting Directions issued by the Minister for Finance. However, because the previous arrangements were in place at 30 June 2012, the 2011–12 financial report of each of the three entities was prepared according to the requirements of the Corporations Act 2001.
The three public companies are being voluntarily wound up. An administrator has been appointed to oversee that process.
Special resolutions to voluntarily wind up the companies and to appoint a liquidator were passed by all three companies at extraordinary general meetings. The liquidation process has commenced.
Deregistration of the companies by the Australian Securities and Investments Commission is expected to occur in December 2012.
1.2.2 Integration of the Northern Victorian Irrigation Renewal Project and Goulburn-Murray Water
The State Owned Enterprise for Irrigation Modernisation in Northern Victoria, which traded as the Northern Victorian Irrigation Renewal Project (NVIRP), was established in 2007 to plan, design and deliver the food bowl modernisation project. The project, with a budget of $2.063 billion, is now being delivered by Goulburn-Murray Water (G‑MW), following a decision during 2011–12 to integrate the operations of NVIRP with G-MW.
To facilitate the transfer of functions, activities and all the property, assets and liabilities of NVIRP to G-MW, NVIRP was declared a reorganising body under the provisions of the State Owned Enterprise Act 1992. NVIRP employees were transferred to G‑MW under the provisions of the Public Administration Act 2004. The changes were effective from 1 July 2012.
A new executive management team was announced at G-MW in July 2012, with the former NVIRP interim chief executive appointed to head the business unit responsible for day-to-day management of the food bowl modernisation project.
As a result of the NVIRP Board being disbanded on 30 June 2012 the G-MW Board was responsible for the preparation, finalisation and certification of the NVIRP financial report for 2011–12. The financial reports of NVIRP and G-MW for 2011–12 contained details of the integration.
The former chairman of NVIRP was appointed to the G-MW Board by the Minister for Water.
1.2.3 Watermove to cease operations
Watermove, a controlled entity of G-MW, commenced trading on 1 November 2009. It generated an operating loss each year since inception.
With G-MW keen to focus on its core business, the directors of Watermove resolved at a board meeting on 10 August 2012 to discontinue the operations. G-MW is investigating the sale of the business and assets and has agreed to take full responsibility for the repayment of all outstanding Watermove debts.
1.3 Financial audit framework
1.3.1 Audit of financial reports
An annual financial audit has two aims:
- to give an opinion consistent with section 9 of the Audit Act 1994, on whether financial reports are fairly stated
- to consider whether there has been wastage of public resources or a lack of probity or financial prudence in the management or application of public resources, consistent with section 3A(2) of the Audit Act 1994.
The financial audit framework applied in the conduct of the 2011–12 is set out in Figure 1C.
Figure 1C
Financial audit framework
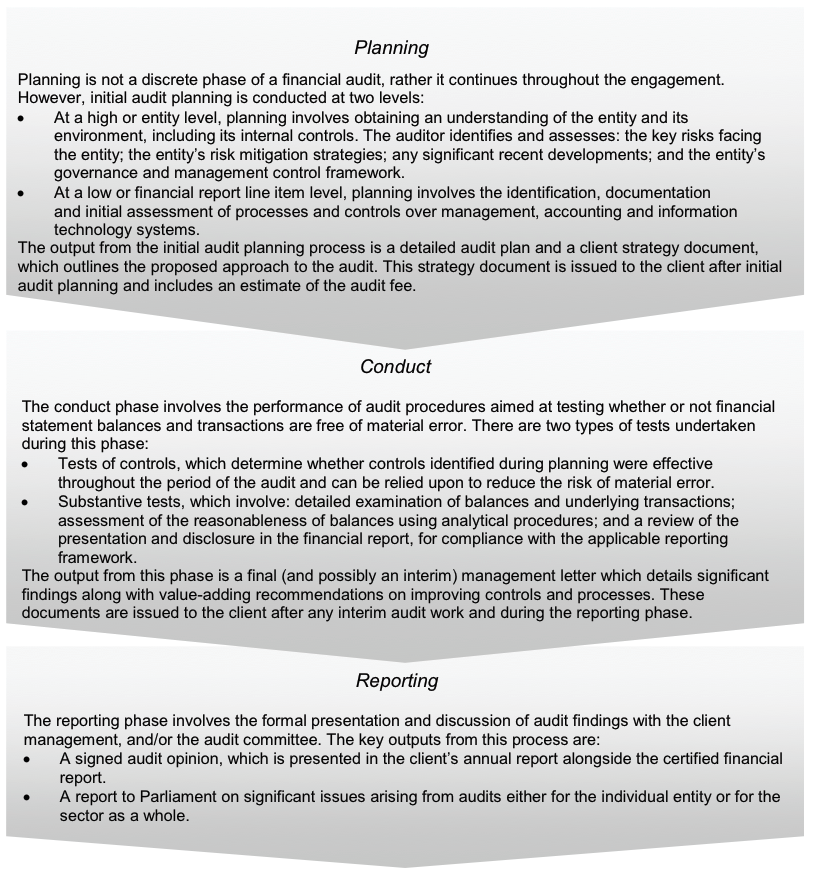
Source: Victorian Auditor-General’s Office.
1.3.2 Audit of performance reports
Section 8(3) of the Audit Act 1994 authorises the Auditor-General to audit performance indicators included in the annual reports of a public sector entity to determine whether they fairly represent the entity’s actual performance.
The Auditor-General uses this authority to audit the performance reports prepared by the water industry under Financial Reporting Direction 27B Presentation and Reporting of Performance Information.
1.3.3 Audit of internal controls
An entity’s governing body is responsible for developing and maintaining its internal control framework. Internal controls are systems, policies and procedures that help an entity to reliably and cost-effectively meet its objectives. Sound internal controls enable the delivery of reliable, accurate and timely external and internal reporting.
Figure 1D identifies the main components of an effective internal control framework.
Figure 1D
Components of an internal control framework
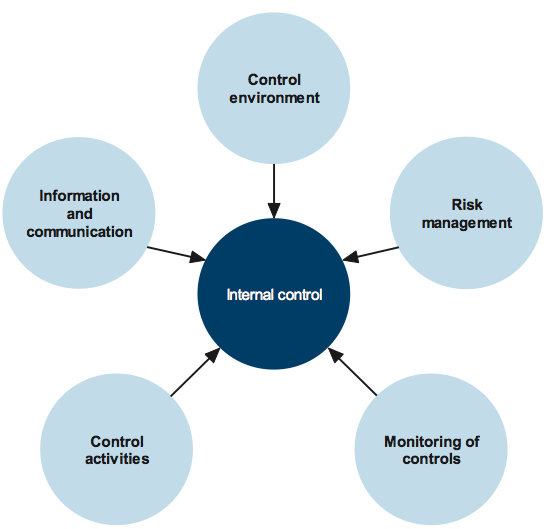
Source: Victorian Auditor-General’s Office.
In the diagram:
- the control environment provides the fundamental discipline and structure for the controls and includes governance and management functions and the attitudes, awareness, and actions of those charged with governance and management of an entity
- risk management involves identifying, analysing and mitigating risks
- monitoring of controls involves observing the internal controls in practice and assessing their effectiveness
- control activities are policies, procedures and practices prescribed by management to help meet an entity’s objectives
- information and communication involves communicating control responsibilities throughout the entity and providing information in a form and time frame that allows officers to discharge their responsibilities.
The annual financial audit enables the Auditor-General to form an opinion on an entity’s financial report. Integral to this, and a requirement of Australian Auditing Standard 315 Identifying and Assessing the Risks of Material Misstatement through Understanding the Entity and Its Environment, is to assess the adequacy of an entity’s internal control framework and governance processes related to its financial reporting.
Internal control weaknesses we identify during an audit do not usually result in a ‘qualified’ audit opinion. A qualification is usually warranted only if weaknesses cause significant uncertainty about the accuracy, completeness and reliability of the financial information being reported. Often, an entity will have compensating controls that mitigate the risk of a material error in the financial report.
Weaknesses we find during an audit are brought to the attention of an entity’s chairperson, managing director and audit committee by way of a management letter.
Section 16 of the Audit Act 1994 empowers the Auditor-General to report to Parliament on the results of audits. This report includes the results of our review of internal controls related to the financial reporting responsibilities of the water industry.
1.4 Audit conduct
The audits were undertaken in accordance with the Australian Auditing Standards.
The total cost of preparing and printing this report was $190 000.
1.5 Structure of this report
Figure 1E outlines the structure of this report.
Figure 1E
Report structure
|
Part |
Description |
|---|---|
|
Part 2: Financial reporting |
Outlines the financial reporting framework and comments on the timeliness and accuracy of financial reporting by 19 water entities and the controlled entity. It compares practices in 2011–12 against better practice, legislated time lines and past performance. |
|
Part 3: Performance reporting |
Outlines the performance reporting framework, comments on the timeliness and accuracy of performance reporting and compares practices in 2011–12 against better practice and past performance. It also details work underway to influence the development of indicators included in performance reports and reiterates our intention to further develop our audit of the performance reports in future periods. |
|
Part 4: Financial results |
Illustrates the financial results of the 19 water entities, including financial performance for 2011–12, and financial position at 30 June 2012. |
|
Part 5: Financial sustainability |
Provides insight into the financial sustainability of the 19 water entities obtained from analysing the trends in seven financial sustainability indicators over a five-year period. |
|
Part 6: Internal controls |
Assesses internal controls at the 19 entities and summarises the control weaknesses commonly identified for the year‑ended 30 June 2012. |
Source: Victorian Auditor-General’s Office.
2 Financial reporting
At a glance
Background
Independent audit opinions add credibility to financial reports by providing reasonable assurance that the information reported is reliable. The quality of an entity’s reporting can be measured by the timeliness and accuracy of the preparation of the reports. This Part covers the results of the 2011–12 audits of the 19 water entities and one controlled entity. It also compares financial reporting practices in 2011–12 against better practice, legislated time lines and 2010–11 performance.
Conclusion
Parliament can have confidence in each of the 19 financial reports that received clear audit opinions. Financial reporting preparation processes were adequate although opportunity for improvement exists. The entities generally produced complete, accurate and reliable information.
Findings
- Clear audit opinions were issued on 19 financial reports.
- At 2 November 2012 the financial report of Watermove was yet to be finalised.
- All entities, except for Watermove, met the legislated 12-week financial reporting time frame.
Recommendation
Water entities should further refine their financial reporting processes by developing plans, preparing shell statements, performing materiality assessments, conducting analytical reviews and having adequate security to protect and safeguard sensitive information.
2.1 Introduction
This Part covers the results from the audits of the 19 water entities and one controlled entity for 2011–12.
2.2 Financial reporting framework
Each of the audited water entities, including the controlled entity, must prepare its financial report in accordance with Australian Accounting Standards (AAS), including the Australian Accounting Interpretations. The AAS prescribe the accounting treatment to be adopted by for-profit and not-for-profit entities.
For financial reporting purposes the four metropolitan entities are designated as for‑profit entities under Financial Reporting Direction (FRD) 108 Classification of Entities as For-Profit.
The principal legislation that governed financial reporting by water entities in 2011–12 was the Financial Management Act 1994 (FMA) and the Corporations Act 2001. Figure 2A summarises the number of entities reporting under each Act.
Figure 2A
Legislative framework for water entities and controlled entities
|
Legislative framework |
Water corporations |
Retail distribution companies |
Controlled entities |
Total |
|---|---|---|---|---|
|
Financial Management Act 1994 |
16 |
0 |
0 |
16 |
|
Corporations Act 2001 |
0 |
3 |
1 |
4 |
|
Total |
16 |
3 |
1 |
20 |
Source: Victorian Auditor-General’s Office.
The FMA requires an entity to submit its annual report to its minister. The report should include financial reports for the entity and is to be prepared and audited within 12 weeks of the end of the financial year. The annual report should be tabled in Parliament within four months of the end of the financial year.
The Corporations Act 2001 requires a company to report to its members within four months after the end of the financial year. However, the need to consolidate the results of controlled entities into their parent entity’s financial reports means that controlled entities reporting under the Corporations Act 2001 are in effect also required to report within 12 weeks of the end of the financial year.
Figure 2B summarises the legislative reporting time frames for the water industry entities.
Figure 2B
Legislative reporting time frames
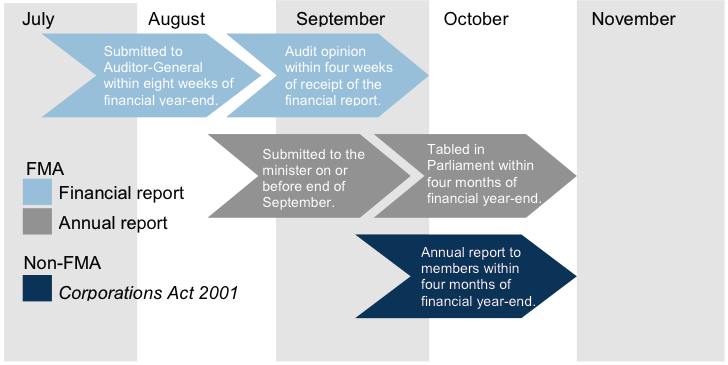
Source: Victorian Auditor-General’s Office.
To achieve more timely reporting, more consistent with current community standards, on 10 February 2012 the Premier issued a circular requiring annual reports to be tabled within three months after the end of the financial year. Ministers and government departments were to work with their portfolio public sector entities with a view of progressively tabling annual reports in Parliament from the end of the second month after year end.
2.3 Audit opinions issued
Clear audit opinions were issued on the financial reports of the 19 water entities for the financial year-ended 30 June 2012.
Independent audit opinions add credibility to financial reports by providing reasonable assurance that the information presented is reliable. A clear audit opinion confirms that the financial report presents fairly the transactions and balances for the reporting period, in accordance with the requirements of relevant accounting standards and legislation.
At 2 November 2012 the financial report of Watermove, a controlled entity of Goulburn-Murray Water, was yet to be finalised. The directors of Watermove resolved to discontinue the operations of the company on 10 August 2012. This decision has resulted in significant changes to the financial statements to reflect the intended orderly winding up of the company. Goulburn-Murray Water has resolved to take full responsibility for the repayment of all outstanding Watermove debts.
2.4 The quality of reporting
The quality of an entity’s financial reporting can be measured by the timeliness and accuracy of the preparation and finalisation of its financial reports. To achieve cost-effective financial reporting, entities need to have well planned and managed financial report preparation processes.
In assessing the quality of the financial reports an assessment was made against better practice criteria. The following rating scale was used:
- non-existent—function not conducted by the entity
- developing—partially encompassed in the entity’s financial statements preparation processes
- developed—entity has implemented the process, however, it is not fully effective or efficient
- better practice—entity has implemented the processes which are effective and efficient.
Entities should aim for the better practice elements detailed in Figure 2C to assist them to produce a complete, accurate and compliant financial report within the legislative time frame.
Figure 2C
Selected better practice—financial report preparation
|
Key area |
Better practice |
|---|---|
|
Financial report preparation plan |
Establish a plan that outlines the processes, resources, milestones, oversight, and quality assurance practices required in preparing the financial report. |
|
Preparation of shell statements |
Prepare a shell financial report and provide it to the auditors early to enable early identification of amendments, minimising the need for significant disclosure changes at year-end. |
|
Materiality assessment |
Assess materiality, including quantitative and qualitative thresholds, at the planning phase in consultation with the audit committee. The assessment assists preparers to identify potential errors in the financial report. |
|
Monthly financial reporting |
Adopt full accrual monthly reporting to assist in preparing the annual financial report. This allows the year-end process to be an extension of the month-end process. |
|
Quality control and assurance procedures |
Require rigorous review of the supporting documentation, data and the financial report itself by an appropriately experienced and independent officer prior to providing it to the auditors. |
|
Supporting documentation |
Prepare high-standard documentation to support and validate the financial report and provide a management trail. |
|
Analytical reviews |
Undertake rigorous and objective analytical review during the financial report preparation process to help to improve the accuracy of the report. |
|
Reviews of controls/ self-assessment |
Establish sufficiently robust quality control and assurance processes to provide assurance to the audit committee on the accuracy and completeness of the financial report. |
|
Competency of staff |
The preparers of the financial report have a good understanding of, and experience in, applying relevant accounting standards and legislation. They also have effective project management and interpersonal skills. |
|
Financial compliance reviews |
Undertake periodic compliance reviews to identify areas of noncompliance or changes to legislation that impact the financial report. |
|
Adequate security |
Protect and safeguard sensitive information throughout the process to prevent inappropriate public disclosure. |
Source: Victorian Auditor-General's Office, and Australian National Audit Office Better Practice Guide: Preparation of Financial Statements by Public Sector Entities, June 2009.
We assessed the 20 entities against the better practice elements and the results are summarised in Figure 2D.
Figure 2D
Results of assessment of financial report preparation processes against better practice elements
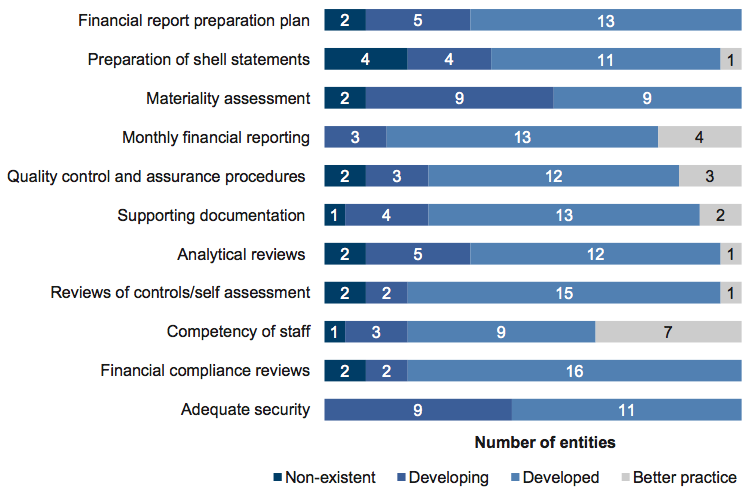
Source: Victorian Auditor-General's Office.
The developed or better practice elements commonly shared by the 20 entities included:
- monthly financial reporting
- quality control and assurance procedures
- supporting documentation
- reviews of controls/self-assessment
- competency of staff
- financial compliance reviews.
However, further improvement was needed in relation to:
- the financial report preparation plan
- preparation of shell statements
- materiality assessment
- analytical review
- adequate security.
Improving these areas will assist the timely preparation of quality financial reports, resource allocation planning and the early detection and correction of errors.
Based on our assessment of the financial reporting process, the overall quality of financial reporting in 2011–12 is consistent with 2010–11.
2.5 Timeliness of reporting
Recognising the importance of financial reports in providing accountability for the use of public monies, entities should prepare and publish their reports on a timely basis. The later the reports are produced and published after year end, the less useful they are for stakeholders and for informing decision-making.
Appendix D specifies when the financial reports were finalised.
2.5.1 Water corporations
Figure 2E shows that the average time taken by the 16 water corporations to finalise their 2011–12 financial reports decreased from the prior year. The average time was 8.5 weeks in 2011–12 compared to 9.0 weeks in 2010–11.
Figure 2E
Average time to finalise the financial reports
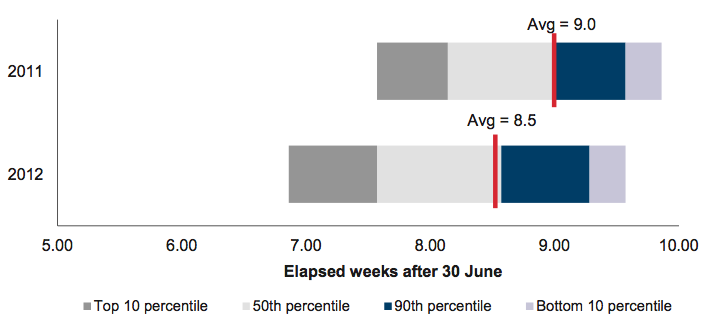
Source: Victorian Auditor-General's Office.
2.5.2 Companies
Under the Corporations Act 2001 the three metropolitan retail distribution companies and the one controlled water entity were required to finalise financial reports within four months of the end of the financial year. However, because the results of controlled entities need to be consolidated into the annual financial report of the state, the reporting provisions of the FMA also apply to the four entities.
The three metropolitan retail distribution companies met the FMA requirements in 2011–12, consistent with last year. The average time taken to finalise their financial reports was 8.2 weeks in 2011–12 and in 2010–11. At 2 November 2012, the financial report of Watermove was yet to be finalised. In 2010–11 this took 16.6 weeks.
2.6 Accuracy
The frequency and size of errors requiring adjustment are direct measures of accuracy of draft financial reports. Ideally, there should be no errors or adjustments arising through the audit.
When our staff detect errors in the draft financial reports they are raised with management. Material errors need to be corrected before a clear audit opinion can be issued. The entity itself may also change its draft financial reports after submitting them to audit, if their quality assurance procedures identify that reported information is incorrect or incomplete.
Overall, there are two types of adjustments:
- financial balance adjustments—changes to the balances being reported
- disclosure adjustments—changes to the commentary or financial note disclosures within the financial report.
There were 41 material financial balance adjustments required in 2011–12 compared to 11 in the prior year. The adjustments resulted in changes to the net result and/or the net asset position of an entity. On average, there were two material financial balance adjustments per entity.
In addition to the financial balance adjustments, there were 23 disclosure errors that required adjustment in the 2011–12 (29 in 2010–11). On average, there was one material disclosure adjustment per entity.
Two events caused the increase in material financial reporting adjustments for 2011–12:
- An industry defined benefit superannuation fund advised the water entities prior to balance date that the latest actuarial investigation resulted in an unfunded liability. Employers with staff who are members of the fund were required to meet their share of the funding shortfall. Water entities were notified of the unfunded amount and their required funding contribution subsequent to year end with the shortfall subsequently recognised as an expense and liability at balance date.
- An environmental contribution levy has been paid by the 19 water entities since 2004–05. The levy was payable until 30 June 2012. The government extended the levy for a further four years prior to balance date. Water entities were informed of the amount that was required to be paid over the next four years subsequent to balance date and disclosed the amount as a commitment in the notes to the financial report.
While the water entities were dependent on information from third parties, they also have a responsibility to be aware of developments that have the potential to impact their financial report.
A large number of water entities were required to amend their financial statements to account for these two events.
Recommendation
- Water entities should further refine their financial reporting processes by developing plans, preparing shell statements, performing materiality assessments, conducting analytical reviews and having adequate security to protect and safeguard sensitive information.
3 Performance reporting
At a glance
Background
Sixteen of the 19 water entities are required to include an audited statement of performance in their annual report. The three metropolitan retailers are encouraged to include an audited statement of performance.
This Part outlines the performance reporting framework, comments on the timeliness and accuracy of performance reporting and compares practices in 2011–12 against better practice and past performance. It also details work underway to influence the development of indicators included in performance reports and reiterates our intention to further develop our audit of the performance reports in future periods.
Conclusion
A contemporary performance reporting framework is yet to be developed for the water industry. The usefulness of current performance reports is limited as targets were not set for a number of indicators and the relevance and appropriateness of indicators being used requires review.
Findings
- Clear audit opinions were issued on the 16 performance reports.
- Ten of 16 (12 of 16 in 2010–11) performance reports included indicators without targets.
- A performance reporting working group was established in 2011–12 to develop a consistent and contemporary performance reporting framework for the water industry.
Recommendations
- The performance reporting working group should continue to develop and implement a consistent and contemporary performance reporting framework, in line with its time lines and our proposed expanded opinions from 2013–14.
- Water entitiesshould set targets for all indicators in their performance reports to enable meaningful assessment of performance.
3.1 Introduction
The Audit Act 1994 provides the Auditor-General with a mandate to audit performance indicators in the report of operations of an audited entity to determine whether they:
- are relevant to the stated objectives of the entity
- are appropriate for the assessment of the entity’s actual performance
- fairly represent the entity’s actual performance.
The annual attest audit on the performance report of water entities is currently limited to an opinion on whether the actual results reported are presented fairly and in compliance with the legislative requirements.
This Part outlines the performance reporting framework, comments on the timeliness and accuracy of performance reporting by the water entities and compares practices in 2011–12 against better practice and past performance. It also details work underway to influence the development of indicators included in performance reports and reiterates our intention to further develop our audit of the performance reports in future periods.
3.2 Elements of effective performance reporting
Effective performance measurement and monitoring enables managers and the governing boards of entities to evaluate performance against a set of key indicators, and facilitates appropriate and timely action to achieve organisational objectives and outcomes. Reporting on performance to senior management and the community is an important part of a performance management framework and public sector accountability.
Central to effective performance measurement, management and reporting is a comprehensive suite of relevant and appropriate performance measures or indicators, and targets.
Relevant indicators have a logical and consistent relationship to an entity’s objectives and are linked to the outcomes to be achieved. Ideally they should take into account immediate deliverables and long-term sustainability.
Appropriate indicators give enough information to assess the extent to which the entity has achieved a predetermined target, goal or outcome. They can include the trends in performance over time, performance relative to the performance of similar agencies, and performance relative to predetermined benchmarks.
Fair presentation of performance results requires that the information provided is capable of measurement, represents what it purports to indicate consistently and without bias, and is accurate and auditable.
3.3 Performance reporting by the water entities
Financial Reporting Direction (FRD) 27B Presentation and Reporting of Performance Information requires water entities subject to the Financial Management Act 1994 (FMA) to include an audited statement of performance in their annual report.
The three metropolitan retailers, City West Water, South East Water and Yarra Valley Water were subject to the Corporations Act 2001 in 2011–12. They were encouraged, but not required, to comply with the direction.
Water entities introduced performance reports for audit over the following time line:
- the 13 regional urban water entities from 2003–04
- the two rural water entities since 2005–06
- Melbourne Water since 2010–11.
Directives under section 51 of the FMA specify the required format, content, and indicators to be included in the performance report. The indicators vary across the three water sectors. Figure 3A summarises the number and nature of indicators by sector.
Figure 3A
Number and nature of performance indicators by sector
|
Water sector |
Financial indicators (no.) |
Non-financial indicators (no.) |
Total (no.) |
|---|---|---|---|
|
Metropolitan |
|||
|
Wholesaler |
6 |
10 |
16 |
|
Retailers |
6 |
12 |
18 |
|
Regional urban |
4 |
12 |
16 |
|
Rural |
4 |
– |
4 |
Source: Victorian Auditor-General's Office.
Appendix G provides further detail on the financial and non-financial indicators reported against by the entities.
3.4 Audit opinions issued
Clear audit opinions were issued on the 16 performance reports audited for 2011–12.
The three metropolitan retail distribution companies did not prepare and submit a performance report for audit. Performance information was included within their annual reports; however, this was not subject to audit.
3.5 The quality of reporting
The performance report should be subject to the same level of internal quality assurance as the financial report.
In assessing the quality of the performance reports an assessment was made against better practice criteria. The following rating scale was used:
- non-existent—function not conducted by the entity
- developing—partially encompassed in the entity’s performance report preparation processes
- developed—entity has implemented the process, however, it is not fully effective or efficient
- better practice—entity has implemented the processes which are effective and efficient.
Figure 3B sets out the best practice elements entities should aim for to assist them to produce a complete, accurate and compliant performance report within the legislative time frame.
Figure 3B
Selected better practice—performance report preparation
|
Key area |
Better practice |
|---|---|
|
Performance report preparation plan |
Establish a plan that outlines the processes, resources, milestones, oversight, and quality assurance practices required in preparing the performance report. |
|
Preparation of shell statements |
Prepare a shell performance report and provide to the auditors early to enable early identification of amendments, minimising the need for significant disclosure changes at year end. |
|
Materiality assessment |
Assess materiality, including quantitative and qualitative thresholds, at the planning phase in consultation with the audit committee. The assessment assists preparers to identify potential errors in the performance report. |
|
Quality control and assurance procedures |
Require rigorous review of the supporting documentation, data and the performance report itself, by an appropriately experienced and independent officer prior to providing it to the auditors. |
|
Supporting documentation |
Prepare high-standard documentation to support and validate the performance report, and provide a management trail. |
|
Reviews of controls/ self-assessment |
Establish sufficiently robust quality control and assurance processes to provide assurance to the audit committee on the accuracy and completeness of the performance report. |
|
Competency of staff |
The preparers of the performance report have a good understanding of, and experience in, applying relevant requirements and legislation. They also have effective project management and interpersonal skills. |
|
Performance compliance reviews |
Undertake periodic compliance reviews to identify areas of noncompliance or changes to ministerial directives that impact the performance report. |
|
Adequate security |
Protect and safeguard sensitive information throughout the process to prevent inappropriate public disclosure. |
Source: Victorian Auditor-General's Office.
An assessment of performance against better practice criteria was undertaken for the 16 entities that prepared and submitted a performance report for audit. The results of our assessment are summarised in Figure 3C.
Figure 3C
Results of assessment of performance report preparation processes against better practice elements
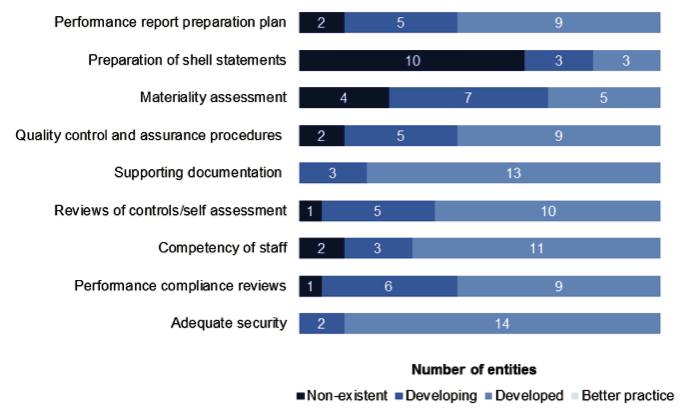
Source: Victorian Auditor-General's Office.
The developed or better practice elements commonly shared by the 16 entities include:
- supporting documentation
- reviews of controls/self-assessment
- competency of staff
- adequate security.
However, further improvement is needed in relation to:
- the performance report preparation plan
- preparation of shell statements
- quality control and assurance procedures
- materiality assessment
- performing compliance reviews.
Based on our assessment of the performance reporting process, the overall quality of performance reporting in 2011–12 has not improved over 2010–11.
3.6 Timeliness of reporting
Performance reports are generally prepared and finalised in conjunction with financial reports and the common time line is provided at paragraph 2.5.1.
Appendix D sets outs when the performance report for each entity was finalised.
3.7 Accuracy
The frequency and size of errors requiring adjustment are direct measures of accuracy of draft performance reports. Ideally, there should be no errors or adjustments arising through the audit.
The key observations in 2011–12 in regard to the accuracy of the draft performance reports were:
- two of 16 entities (13 per cent) prepared and submitted a performance report that included indicators not specified in the directives issued under section 51 of the FMA
- 10 of 16 performance reports included indicators without targets (12 of 16 in 2010–11)
- commentary was not always provided for significant variations between targets and actual performance or between prior year and current year actual performance
- commentary for some significant variations in performance focused on the value of the change rather than the factors that led to it.
A particular concern was that 31 non-financial indicators reported did not have targets, although this was an improvement on the previous year (72 in 2010–11). The absence of targets reduces the usefulness of performance reports because a comparison of actual performance against targets cannot be made.
Westernport Water was required to process a large number of adjustments to its performance report, namely:
- removing indicators not specified in the directive
- including indicators that were missing
- recalculating the variance between actual performance and target on a consistent basis
- providing commentary for significant variations.
The adjustments indicate that the preparation and quality assurance processes at Westernport Water are ineffective and inefficient. A contributing factor was the lack of accountability for the performance report. Management has agreed to critically review its performance reporting processes and assign responsibility for the performance report in order to drive improved quality.
3.8 Performance reporting developments and future audit approach
When performance reporting for the sector was being established, VAGO focused on auditing whether the reports fairly presented performance, and complied with the legislative requirements. However, last year’s report titled Water Entities: Results of the 2010–11 Audits indicated our intention to progress to the stage where the Auditor‑General expresses an opinion on the relevance and appropriateness of the indicators, consistent with his audit mandate.
Recognising the growing importance of performance reporting to public sector resource management and accountability, and in response to our 2010–11 report, a performance reporting working group was established by the Department of Sustainability and Environment (DSE) during 2011–12. It has responsibility for developing a contemporary framework that facilitates the inclusion of relevant and appropriate financial and non-financial indicators in the sector's future performance reports.
The working group, led by DSE, comprises representatives from DSE, the Department of Treasury and Finance, VicWater and the water entities.
A project plan was developed and the working group has met five times since November 2011.
The working group has identified and summarised the performance indicators currently reported on by the water entities, whether they be to internal or external stakeholders. Three discussion papers were prepared and considered by the working group during the year. These were:
- performance reporting in other jurisdictions
- performance reporting and financial performance indicators utilised by utility businesses in the private sector
- criteria for selection of performance indicators.
The working group proposed a time frame for completing key tasks taking into account the water industry’s corporate planning process. This allows entities time to set targets and gather data for any new indicators. The intention is that the framework and indicators will apply to the first year of Water Plan 3, which covers the period from 2013–14 to 2018–19.
Figure 3D sets out the proposed time frame for the completion of the key tasks.
Figure 3D
Project time frame
|
Task |
Timing |
|---|---|
|
Draft criteria to assess the relevance and appropriateness of performance indicators and present to the working group for comment/consultation. |
June 2012 |
|
Release a discussion paper on the criteria for assessing the relevance and appropriateness of performance indicators. |
July 2012 |
|
Apply criteria used on existing and potential reporting indicators to determine a set of proposed reporting indicators for the new framework. |
August 2012 |
|
Present the proposed set of performance reporting indicators to the working group for comment/consultation. |
August 2012 |
|
Release a discussion paper on the performance reporting framework. |
September 2012 |
|
Consult with stakeholders on the draft performance reporting framework. |
October / November 2012 |
|
Finalise performance reporting indicators and the new framework. |
December 2012 |
|
Include the new performance reporting framework requirements in the Corporate Plan guidelines for 2013–14. |
December 2012 |
|
Corporate plan submissions by water businesses to include new performance reporting framework requirements. |
May 2013 |
|
Performance reporting framework operational. |
July 2013 |
|
Post implementation review. |
June 2014 |
Source: Victorian Auditor-General's Office.
Given the time lines, it is intended that audit opinions relating to the performance report will conclude on the relevance and appropriateness of the performance indicators and whether they fairly present performance, from 2013–14 onwards.
Recommendations
- Water entities should further refine their performance reporting processes by developing plans, preparing shell statements, performing materiality assessments, conducting compliance reviews and improving their quality assurance processes.
- The performance reporting working group should continue to develop and implement a consistent and contemporary performance reporting framework, in line with its time lines and our proposed expanded opinions from 2013–14.
- Water entities should set targets for all indicators in their performance reports to enable meaningful assessment of performance.
4 Financial results
At a glance
Background
Accrual-based financial statements enable an assessment of whether water entities are generating sufficient surpluses and positive cash flows from operations to maintain services, fund assets maintenance and retire debt. This Part analyses the financial results of the 19 water entities for the year-ended 30 June 2012.
Findings
- The 19 water entities generated a combined net profit before income tax of $605 million for the year-ended 30 June 2012, an increase of $195 million or 48 per cent from the prior year.
- Dividends paid to the state increased by $198 million or 278 per cent in 2011–12.
- At 30 June 2012 the 19 water entities controlled $36.3 billion in total assets ($35.2 billion at 30 June 2011) and had total liabilities of $14.8 billion ($13.9 billion at 30 June 2011).
- Interest-bearing liabilities increased by $931 million or 11.4 per cent in 2011–12, with new borrowings financing the construction of infrastructure assets and the payment of dividends.
- For many customers, especially for the regional urban and rural sectors, fixed charges represent 64 and 87 per cent respectively of their water charges. Reducing water consumption will not substantially lower their water bills.
- Capital expenditure for the past four years of twoentities was less than 70 per cent of the target set in their five-year water plan expiring 2012–13, while six entities have already exceeded their capital expenditure targets.
Recommendation
- The Essential Services Commission should revisit the duration of the water plans and the funding model's flexibility to deal with situations where the actual financial outcomes differ significantly from what was proposed in the approved water plans due to changed circumstances and/or environmental conditions.
4.1 Introduction
Accrual-based financial statements enable an assessment of whether water entities are generating sufficient surpluses and positive cash flows from operations to maintain services, fund assets maintenance and retire debt. Their ability to generate surpluses is subject to the regulatory environment in which they operate, and their ability to minimise costs and maximise revenue.
An entity’s financial performance is measured by its net operating result—the difference between its revenues and expenses. An entity’s financial position is generally measured by reference to its net assets—the difference between its total assets and total liabilities.
Appendix E provides information on the composition of revenue, expenses, assets and liabilities for the 19 water entities, by sector for 2011–12.
4.2 Financial results
4.2.1 Financial performance
The 19 water entities are subject to the National Tax Equivalent Regime administered by the Australian Taxation Office. Therefore their net result both before and after income tax is addressed in this section of the report.
Net result before income tax
The water industry generated a net profit before income tax of $605 million for the year‑ended 30 June 2012. This was an increase of $195 million or 48 per cent over the prior year. This was predominantly due to an increase in:
- service charges of $178 million or 14 per cent
- usage charges of $279 million or 29 per cent
- developer contributions of $99 million or 36 per cent.
The net profit before income tax was strong, and continued to be driven by the four metropolitan water entities. Four of the 13 regional urban water entities reported a lower net profit before tax in 2011–12 relative to the prior year (eight in 2010–11), and eight reported a net loss before tax (five in 2010–11). The two rural water entities continued to report losses.
Figure 4A shows the net profit or loss before income tax for each entity for the past two years. It shows that 10 entities delivered a loss before income tax for 2011–12.
Figure 4A
Net profit/(loss) before income tax, by water entity
|
Entity |
2011–12 |
2010–11 |
|---|---|---|
|
Metropolitan sector |
||
|
Wholesaler |
||
|
Melbourne Water |
372.8 |
214.1 |
|
Retailer |
||
|
City West Water |
71.7 |
87.7 |
|
South East Water |
129.3 |
99.7 |
|
Yarra Valley Water |
87.1 |
86.3 |
|
Regional urban sector |
||
|
Barwon Water |
50.6 |
23.9 |
|
Central Highlands Water |
(6.1) |
(1.3) |
|
Coliban Water |
(20.3) |
(24.3) |
|
East Gippsland Water |
3.7 |
(0.2) |
|
Gippsland Water |
(4.2) |
1.3 |
|
Goulburn Valley Water |
(6.8) |
0.3 |
|
GWMWater |
(8.3) |
(22.1) |
|
Lower Murray Water |
(12.7) |
(9.5) |
|
North East Water |
(2.4) |
0.4 |
|
South Gippsland Water |
(1.1) |
1.4 |
|
Wannon Water |
4.9 |
1.4 |
|
Western Water |
5.2 |
4.3 |
|
Westernport Water |
3.0 |
2.2 |
|
Rural sector |
||
|
Goulburn-Murray Water |
(52.2) |
(52.9) |
|
Southern Rural Water |
(9.0) |
(2.5) |
|
Total |
605.2 |
410.2 |
Source: Victorian Auditor-General's Office.
Unrequired desalination payments collected
Melbourne Water generated a substantial increase in its net result for 2011–12. Delays in commissioning the desalination plant meant that expenses during the period were lower than anticipated. Six months of estimated costs did not eventuate. Higher bulk water and sewerage charges were levied on the metropolitan water retailers as per Melbourne Water's approved price determination, generating additional revenue.
City West Water, South East Water, Yarra Valley Water and Western Water increased their water prices, as per their approved price determinations, as they anticipated increased operating costs due to the desalination plant. Because of the commissioning delays, the four entities collected more revenue than required from their customers.
The Minister for Water announced on 19 June 2012 that:
- all unrequired desalination payments collected will be returned to customers
- Melbourne Water and the retailers were freezing prices and price increases of 9.6 per cent scheduled for 2012–13 will not be implemented until all monies collected from customers are returned and interest paid.
The government requested that the Essential Services Commission (ESC) oversee and independently verify the return of payments, adjusted for interest and inflation. The ESC will also conduct an audit of customer bills with the audit findings to be published on its website.
The ESC is to report on the progress of the return of unrequired desalination payments through a quarterly report published on its website, which is to summarise:
- the amount of money returned to customers
- the amount of money expected to be returned by the end of 2012–13
- a forecast of any remaining amounts to be returned in 2013–14.
In late September 2012, the ESC released the Opinion Report – Return of Additional Desalination Payments. The ESC estimated that the additional amounts that might be returned to customers in 2012–13 could range from $23 million to $243 million, depending on the desalination plant's cost and completion date.
Net result after income tax
The sector reported a combined net profit after income tax of $434.4 million in 2011–12, an increase of $114.9 million or 36 per cent from the prior year.
Ten entities delivered a loss after income tax for 2011–12.
Revenue
In 2011–12, the 19 entities collectively generated revenue of $4.4 billion, an increase of $751.7 million, or 20.4 per cent from the prior year. The increase was driven by higher service and usage charges.
Service and usage charges
Excluding revenue from transactions between Melbourne Water and the three retail distribution companies, service and usage charges accounted for 76.8 per cent of total revenue generated in 2011–12. They were the largest sources of revenue for the entities.
Figure 4B shows service and usage charges revenue in 2011–12 as a percentage of the total service and usage charges per entity for the year. The service charge is a fixed charge levied on each property. The usage charge is a variable charge with the level of water consumption driving the amount the customer pays.
The service charge for rural customers also includes a volumetric entitlement charge.
Figure 4B
Service and usage charges as a percentage of the total service and usage charges revenue, 2011–12
|
Entity |
Service charge |
Usage charge |
|---|---|---|
|
Metropolitan sector |
||
|
City West Water |
34 |
66 |
|
South East Water |
41 |
59 |
|
Yarra Valley Water |
41 |
59 |
|
Average |
39 |
61 |
|
Regional urban sector |
||
|
Barwon Water |
56 |
44 |
|
Central Highlands Water |
71 |
29 |
|
Coliban Water |
58 |
42 |
|
East Gippsland Water |
74 |
26 |
|
Gippsland Water |
67 |
33 |
|
Goulburn Valley Water |
53 |
47 |
|
GWMWater |
66 |
34 |
|
Lower Murray Water |
73 |
27 |
|
North East Water |
43 |
57 |
|
South Gippsland Water |
59 |
41 |
|
Wannon Water |
53 |
47 |
|
Western Water |
71 |
29 |
|
Westernport Water |
85 |
15 |
|
Average |
64 |
36 |
|
Rural sector |
||
|
Goulburn-Murray Water |
77 |
23 |
|
Southern Rural Water |
97 |
3 |
|
Average |
87 |
13 |
Note: Service and usage charges include water and wastewater charges.
Melbourne Water does not levy service and usage charges as it sells water to the metropolitan water bodies rather than individual customers.
Source: Victorian Auditor-General's Office.
While charges relating to water comprise a fixed and variable charge, the sewerage charges levied by some entities comprise a fixed charge only.
As the proportion of the charge that is fixed is higher in many cases, for many customers, reducing water consumption will not substantially lower their water bill.
An entity's decision about the ideal tariff structure, including the split between fixed and variable can be influenced by whether or not the entity is subject to seasonal fluctuations in consumption. For example, coastal towns that experience an increase in visitor numbers during the summer holiday period. To generate sufficient revenue over the financial year to cover their operating costs such entities may set a higher proportion of a customer's bill as a fixed rather than variable charge.
Developer contributed infrastructure assets
Developers are required to provide water supply and sewerage facilities in the new subdivisions they develop. Once built, the infrastructure is gifted to the water entities, which assume responsibility for ongoing maintenance and eventual replacement of the facilities.
The fair value of developer contributions is recognised as income in the financial report of water entities once the facilities are gifted to them, that is, when they gain control of the assets. This non-cash income is recorded as 'developer contributed assets'. Over the past five years, water entities have recognised $716 million in developer contributions.
In the absence of developer contributions, the number of entities reporting a net loss before income tax in 2011–12 would have increased from 10 to 12.
Expenses
In 2011–12, the 19 entities collectively incurred $3.8 billion in operating expenses, an increase of $556 million or 17 per cent from the prior year. The increase was predominantly because:
- depreciation and amortisation increased by $136.0 million or 20.5 per cent
- employee benefits increased by $84.1 million or 18.4 per cent
- finance costs increased by $65.5 million or 12.7 per cent.
The largest expense items for the water entities in 2011–12 were depreciation and amortisation, and employee benefits.
Dividends
The 19 entities are obliged to pay a dividend to the state if the Treasurer after consultation with the governing board and responsible minister makes a formal determination to do so.
Until 2009–10 the four metropolitan water entities paid an interim and final dividend within a particular financial year. The interim dividend was based on the half-yearly result of that particular financial year and the final dividend was linked to the full-year result for the prior financial year.
During 2010–11 only a final dividend in relation to 2009–10 was paid and the payment of interim dividends based on the 2010–11 half-yearly result was deferred by the state.
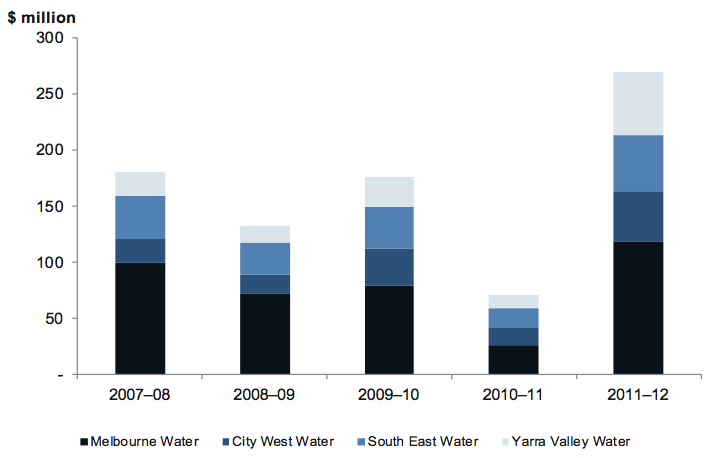
In 2011–12, the four metropolitan water entities paid dividends of $270 million, an increase of $198 million or 278 per cent over with those paid in 2010–11. The increase in part reflects the impact of deferring the payment of an interim dividend in 2010–11 until 2011–12. Like the prior year, there were no interim dividends paid based on the 2011–12 half-yearly results.
To pay the dividends in 2011–12, the four metropolitan water entities borrowed funds from the Treasury Corporation of Victoria.
Figure 4C shows the dividends paid by the four metropolitan water entities over the past five years.
Figure 4C
Dividends paid by metropolitan water entities, 2007–08 to 2011–12
Source: Victorian Auditor-General’s Office.
4.3 Financial position
The ability of water entities to maintain their infrastructure assets depends on the adequacy of their asset and debt management policies or the level of surpluses achieved. Their effectiveness is reflected in the composition and rate of change of the value of their assets and liabilities over time.
4.3.1 Assets
At 30 June 2012, the 19 entities had combined assets valued at $36.3 billion, an increase of $1.04 billion or 3.0 per cent compared to the prior year. Property, plant, equipment and infrastructure assets represented 96 per cent of total assets.
An $814 million or 2.4 per cent increase in the value of property, plant, equipment and infrastructure assets at 30 June 2012, was predominantly driven by the construction of infrastructure assets.
Receivables also increased by $86 million or 17 per cent due to higher service and usage charges levied by the water entities.
Asset Revaluation and Depreciation Guidelines Working Group
The four metropolitan water entities recorded infrastructure assets at fair value for the first time in 2009–10, with the fair value of infrastructure assets determined using an income approach. The regional urban and rural water entities transitioned to fair value at 30 June 2011. The fair value of their assets was determined using a depreciated replacement cost approach.
Both approaches comply with Australian Accounting Standard AASB 116 Property, Plant and Equipment. The variation in approach is driven by an entity’s designation as ‘for-profit’ or ‘not for profit’ for financial reporting purposes.
As a result of difficulties experienced during the 2010–11 revaluation of infrastructure assets, a Victorian water industry working group has been formed. Its focus is on long‑lived water infrastructure assets and asset revaluation impacts on depreciation. Its purpose is to determine the best method for allocating economic value to long-lived infrastructure assets and developing guidelines for the revaluation of all assets.
The working group includes representatives from:
- VicWater
- Metropolitan sector water entities
- Regional urban sector water entities
- Rural sector water entities
- the Department of Sustainability and Environment
- the Department of Treasury and Finance.
The working group has proposed time frames for completing tasks as set out in Figure 4D.
Figure 4D
Working group time frames
|
Task |
Timing |
|---|---|
|
Prepare draft guidance on useful lives for use in the industry |
March 2013 |
|
Test and analyse impacts of assumptions on depreciation |
September 2013 |
|
Consult with the water industry |
October 2013 |
|
Obtain water industry agreement and finalise guidelines |
December 2013 |
|
Working group endorses and government agencies approve guidelines |
February 2014 |
|
Implement guideline |
July 2014 |
Source: Victorian Auditor-General’s Office.
The time frames are subject to change pending consultation with the water industry.
4.3.2 Liabilities
At 30 June 2012, the water industry had combined liabilities of $14.8 billion, an increase of $870 million or 6.3 per cent in comparison with the prior year.
Deferred tax liabilities decreased by $82 million or 1.7 per cent in 2011–12.
Interest-bearing liabilities increased by $931 million or 11.4 per cent in 2011–12. The new borrowings financed the construction of infrastructure assets and facilitated the payment of dividends.
The profitability of the 19 water entities will continue to be impacted by higher depreciation expense and finance costs in the future, as a result of higher asset values and increased borrowings.
4.4 Performance against the 2008–09 to 2012–13 water plan
In approving the price an entity can charge its customers, the ESC considers an entity’s water plan. The plan specifies the outcomes the entity plans to deliver, how they will be achieved, and the revenue needed to deliver them over the life of the plan. It also outlines the entity’s proposed operating and capital expenditure over the period of the plan.
A range of assumptions underpin the proposed revenue and expenditure forecasts. If the assumptions prove wrong, actual financial outcomes can differ significantly from what was proposed in the approved water plan. This in turn can also result in the customer being under or overcharged. The ESC has the ability to re-open or review prices in the event of unforeseen circumstances if a water entity makes a submission.
The current water plans cover the period from 2008–09 to 2012–13. They provide for substantial increases in water prices to fund significant capital works, with price increases generally higher in the early years.
4.4.1 Capital expenditure
The ESC reviewed the 2008–09 to 2012–13 water plans submitted by the 19 water entities. The price determinations approved by the ESC indicate a regulatory target of $8.5 billion for capital expenditure for the industry as a whole over the five-year period.
Our analysis of actual capital expenditure for the period 2008–09 to 2011–12 revealed that as at 30 June 2012:
- actual capital expenditure over the four-year period by the water industry was $8.05 billion or 95 per cent of the five-year regulatory target
- six entities had already exceeded their five-year capital expenditure regulatory target
- two entities may not reach their regulatory target given their capital expenditure was less than 70 per cent of their regulatory target.
This indicates that the actual expenditure is likely to differ from the forecast expenditure as outlined in the ESC price determination. Therefore the prices levied may result in significant under or over recovery of costs by the water entities during the regulatory period.
Figure 4E summarises capital expenditure to date compared to the target specified in the ESC price determinations.
Figure 4E
Capital expenditure, comparison between five-year target per ESC price determination and actual expenditure for the period 2008–09 to 2011–12
|
Entity |
Regulatory Target |
Actual |
Variance |
Actual against target |
|---|---|---|---|---|
|
Metropolitan sector |
||||
|
Melbourne Water |
3 361.9 |
3 345.8 |
(16.1) |
99.5 |
|
City West Water |
623.7 |
479.8 |
(143.9) |
76.9 |
|
South East Water |
787.8 |
659.3 |
(128.5) |
83.7 |
|
Yarra Valley Water |
1 254.8 |
938.8 |
(316.0) |
74.8 |
|
Regional urban sector |
||||
|
Barwon Water |
437.4 |
562.5 |
125.1 |
128.6 |
|
Central Highlands Water |
169.9 |
168.5 |
(1.4) |
99.2 |
|
Coliban Water |
196.4 |
187.8 |
(8.6) |
95.6 |
|
East Gippsland Water |
56.2 |
58.9 |
2.7 |
104.8 |
|
Gippsland Water |
233.0 |
225.0 |
(8.0) |
96.6 |
|
Goulburn Valley Water |
113.1 |
102.5 |
(10.6) |
90.6 |
|
GWMWater |
341.5 |
368.7 |
27.2 |
108.0 |
|
Lower Murray Water |
115.0 |
137.2 |
22.2 |
119.3 |
|
North East Water |
109.8 |
67.3 |
(42.5) |
61.3 |
|
South Gippsland Water |
54.0 |
49.2 |
(4.8) |
91.1 |
|
Wannon Water |
125.4 |
124.5 |
(0.9) |
99.3 |
|
Western Water |
129.5 |
138.6 |
9.1 |
107.0 |
|
Westernport Water |
29.4 |
28.2 |
(1.2) |
95.9 |
|
Rural sector |
||||
|
Goulburn-Murray Water |
222.4 |
375.8 |
153.4 |
169.0 |
|
Southern Rural Water |
116.5 |
36.5 |
(80.0) |
31.3 |
|
Total |
8 477.7 |
8 054.9 |
(422.8) |
95.0 |
(a) The target figures represent the gross capital expenditure as specified in the ESC price determinations for 2008 and 2009, as applicable. The targets are expressed in 2007 dollars; they exclude the impact of CPI.
(b) The actual figures reflect payments made from 1 July 2008 to 30 June 2012.
Note: The price determination of rural sector entities can include projects which are dependent on government funding. In the absence of government funding the projects may not be delivered.
Source: Victorian Auditor-General’s Office.
On face value, it appears that many entities are at risk over overspending against their regulatory capital expenditure target. While true in some cases, in others the figures may be misleading.
Factors contributing to the variations outlined in Figure 4E may include:
- planned capital works program over the five-year period not optimally scheduled
- favourable and unfavourable weather conditions impacting the timing of the capital works program's delivery
- decisions by governing boards to deliver capital projects not included in the regulatory target to manage or mitigate business risks
- completion of projects relating to the first regulatory period during the current regulatory period
- completion of projects intended to be delivered during the current regulatory period during the next regulatory period
- whether the full cost of a project has or has not been included in the price determination
- actual asset renewal and replacement less than needed over the period as the assets maintained more efficiently than planned
- projects completed early
- intentional delivery of the majority of the five-year capital works program during the water plan's early years.
Specific comments
Figure 4E shows that Barwon Water has exceeded its capital expenditure target. The water plan submitted to the ESC for approval excluded a number of infrastructure projects.
Lower Murray Water has exceeded its target in part as result of the Koorlong Wastewater Treatment Plant Augmentation and Recycled Water Project. The final cost for this project was greater than the original budget due to major re-scoping of the project to upgrade the capacity of the plant to include trade waste and flows from decommissioning of the Red Cliffs Waste Water Treatment Plant.
Goulburn-Murray Water has exceeded its capital expenditure budget significantly. At the time of preparing its water plan there was insufficient detail available for projects such as the Central Shepparton Modernisation Project 1, 2, 3 and 4.
North East Water's level of capital expenditure is less than target due to delays in selecting a site for the Bright Off-stream Storage project. In addition, the construction of a new regional head office is scheduled for the final year of the current Water Plan.
Southern Rural Water's capital expenditure is significantly below its budget. This is due to the delay of the Macalister Irrigation District supply infrastructure modernisation project. Whilst the price determination assumed the project would have commenced during the regulatory period the project was subject to the receipt of Commonwealth and state funding. Construction has not commenced as the project is yet to receive government approval.
These differences between the budgeted and actual capital expenditure along with the impact of delays in commissioning the desalination plant, add strength to the recommendation in last year's Water Entities: Results of the 2010–11 Audits report to revisit:
- the duration of water plans
- the appropriateness of the funding model and its flexibility in times of changed circumstances
- the rigour of the planning and forecasting by water entities.
Recommendation
- The Essential Services Commission should revisit the duration of the water plans and the funding model's flexibility to deal with situations where the actual financial outcomes differ significantly from what was proposed in the approved water plans due to changed circumstances and/or environmental conditions.
5 Financial sustainability
At a glance
Background
To be financially sustainable, entities need to be able to meet current and future expenditure as it falls due. They also need the ability to absorb foreseeable changes and materialising risks without significantly changing their revenue and expenditure policies. This Part provides our insight into the financial sustainability of the 19 water entities based on our analysis of the trends in seven indicators over a five-year period. Our financial sustainability risk assessment criteria was reviewed and revised during 2011–12. Debt service cover has been included in our assessment this year for the first time.
Conclusion
Six entities were rated a high financial sustainability risk at 30 June 2012 due to the magnitude of their operating losses. An analysis of the trends in the financial sustainability indicators shows a deteriorating position for the industry over the five years to 2011–12.
Findings
- The timing and magnitude of price increases has a direct impact on the financial performance and position of an entity over time.
- The industry’s underlying result decreased in 2011–12 with 53 per cent of entities (10 of 19) reporting a net loss, 16 per cent more than in 2010–11.
- While consistent with the past three years, the number of entities with poor liquidity has increased by 11 per cent since 2007–08.
- The debt service cover ratio indicates that the ability of two metropolitan water entities to repay debt is low. As a result the entities will need to refinance their maturing debt.
5.1 Introduction
To be financially sustainable, entities need the capacity to meet their current and future expenditure as it falls due. They also need the ability to absorb foreseeable changes and financial risks as they materialise.
In this Part we provide insight into the financial sustainability of Victoria’s water entities through analysis of the trends in each of seven financial sustainability indicators over a five-year period. The seven indicators are the:
- underlying result percentage
- liquidity ratio
- interest cover ratio
- debt service cover ratio
- debt-to-assets ratio
- self-financing percentage
- capital replacement ratio.
Our financial sustainability risk assessment criteria was reviewed and revised during 2011–12. Debt service cover has been included in our assessment this year for the first time.
The revised criteria provide a more meaningful insight into the financial sustainability of the industry, sector and the 19 water entities. The changes have been applied to the financial data for the five-year period 2007–08 to 2011–12. Appendix F describes the sustainability indicators and risk assessment criteria used.
We examine the seven indicators as a basket of indicators for each entity, and for each of the sectors—metropolitan, regional urban and rural—to identify early signs of improving or deteriorating trends. The results of the extended analysis are presented in this Part, and the underlying data can be found in Appendix F.
The financial sustainability indicators and assessments flag departures from the norm that warrant attention. However, to form a definitive view of any entity’s financial sustainability requires a holistic analysis that moves beyond financial considerations to include the entity’s operations and environment, and the regulatory environment in which the entity operates. These additional considerations are not examined in this report.
5.2 Financial sustainability
5.2.1 Overall assessment
Six entities were rated a high financial sustainability risk at 30 June 2012 due to the magnitude of their operating loss.
Figure 5A provides a summary of our financial sustainability risk assessment results by sector for the past two years.
Figure 5A
Financial sustainability risk assessment, by sector
|
2011–12 |
2010–11 |
|||||
|---|---|---|---|---|---|---|
|
Sector |
High |
Medium |
Low |
High |
Medium |
Low |
|
Metropolitan |
– |
2 |
2 |
– |
1 |
3 |
|
Regional urban |
4 |
2 |
7 |
3 |
1 |
9 |
|
Rural |
2 |
– |
– |
1 |
– |
1 |
|
Total |
6 |
4 |
9 |
4 |
2 |
13 |
Source: Victorian Auditor-General’s Office.
The financial sustainability results for 2007–08 to 2011–12 per entity are provided in Appendix F.
5.2.2 Summary of trends in risk assessments over the five‑year period
When the risk assessments for each indicator are analysed they show the following trends over the five years to 2011–12:
- underlying result—the number of entities in the high-riskcategory has doubled
- liquidity—there has been an increase in the number of entities in the high-risk category and a decrease in the low-risk category over the five-year period indicating tightening liquidity
- interest cover—the number of entities in all categories remains stable
- debt service cover—the number of entities in the high-risk category has increased over the five-year period
- debt-to-assets—the number of entities in the low-risk category has remained stable
- self-financing—the number of entities in the low-risk categoryhas increased over the five-year period
- capital replacement—there has been a significant shift over the five years from low- to medium- and high-risk categories.
In summary, the trend shows a deteriorating position for the industry over the five-year period to 2011–12. Further information about the risk assessments for each indicator is presented later in this Part.
5.2.3 Analysis of trends in sustainability indicators across the five-year period
To further understand the results we analysed the five-year data for the seven indicators for each of the metropolitan, regional urban and rural water entities. The relevant data is reproduced in Appendix F.
The trend for the metropolitan water sector is relatively stable. They have a large customer base and generate strong profits and positive cash flows from operations.
The regional urban water entities, as a cohort are also relatively well placed. In 2011–12 it was the magnitude of the operating loss that resulted in four entities being rated as high risk.
The rural sector entities continue to generate significant operating losses. Both Goulburn-Murray Water and Southern Rural Water have substantial infrastructure assets. In accordance with a determination by the former Minister for Water, assets of rural water entities acquired or constructed prior to 1 July 2004, or funded by government since 2004, were assigned a zero regulatory asset value. Depreciation and capital charges associated with those assets are therefore not funded under the pricing principles established by the Water Industry Regulation Order.
The revaluation of infrastructure assets at the end of 2010–11 significantly increased the depreciation expense in 2011–12. Both Goulburn-Murray Water and Southern Rural Water are expected to continue to generate operating losses as revenue generated will be insufficient to meet their total operating costs.
Goulburn-Murray Water generated positive cash flows from operations for the first time in three years in 2011–12, resulting in an improved interest cover and liquidity position at 30 June 2012. The integration of the State Owned Enterprise for Irrigation Modernisation in Northern Victoria into Goulburn-Murray Water from 1 July 2012 presents management with a new financial sustainability challenge.
Southern Rural Water has generated positive cash flows from operations over the past five-year period.
Regulating the price of water
Since 1 January 2004 the Essential Services Commission (ESC) has been responsible for regulating and approving the price each water entity may charge its customers for the supply of water and the provision of sewerage services. The ESC first approved prices for metropolitan and regional urban businesses from 1 July 2005 and for rural businesses 1 July 2006.
Under the regulatory regime, the regulated asset value (RAV) rather than the statutory asset value (SAV) is used for determining the total revenue required by an entity based on efficient costs.
The SAV is the value of assets reported by an entity within its audited financial report. The opening RAV was set by the former Minister for Water as at 1 July 2004 with reference to the operating cash flow generated by the businesses at that time and subject to a range of viability and pricing outcomes based on entity forecasts. The RAV is adjusted each year by the ESC to allow for capital investment by the businesses to the extent that the ESC is satisfied that it is efficient expenditure.
While the opening RAVs of the metropolitan entities were set higher than their SAV, the regional urban and rural entities had a RAV set lower than their SAV, with the rural entities assigned a zero RAV.
The RAV is reflected in the price that a water entity can charge its customers. As a result, a large depreciation expense not recovered through prices is carried by a number of entities.
The revaluation of infrastructure assets in recent years significantly increased the value of assets reported in the financial reports of the 19 entities. It also increased the difference between RAVs and SAVs and magnified the shortfall between the price levied and the revenue required to meet efficient operating costs.
Accordingly, the difference between the RAVs and the SAVs is a key factor in the operating losses reported by a number of the regional urban and rural water entities. This issue is just one to be considered by the recently formed Water Industry Financial Sustainability Working Group. The working group intends to develop a discussion paper that identifies and prioritises the financial sustainability issues facing the industry for consultation with the industry and other key stakeholders.
5.3 Five-year trend analysis
This section analyses and comments on the trends in seven sustainability indicators over five years. The indicators reflect each entity’s funding and expenditure policies, and identify whether these policies are sustainable.
Financial sustainability should be viewed from both a short-term and long-term perspective. The shorter-term indicators—the underlying result, liquidity and interest cover—focus on an entity’s ability to maintain a positive operating cash flow and adequate cash holdings, and to generate an operating surplus over time.
The longer-term indicators—debt service cover, debt-to-assets, self-financing and capital replacement—identify whether adequate funding is available to repay debt, replace assets to maintain the quality of service delivery, and to meet community expectations and the demand for services.
5.3.1 Underlying result
Figure 5B shows the average underlying result has fluctuated over the five years for the metropolitan and regional urban water entities. However for the rural water entities, the trend has been decreasing over the five years.
Figure 5B
Average underlying result
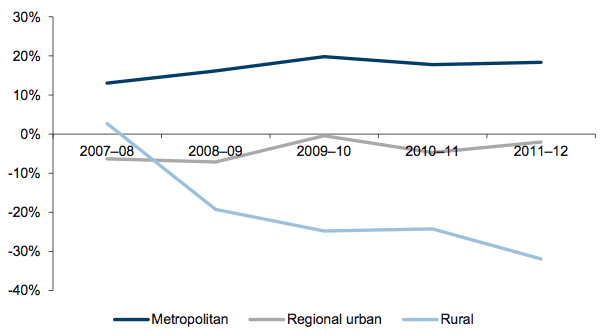
Source: Victorian Auditor-General’s Office.
Key factors contributing to the results include:
- the timing and magnitude of price increases approved by the ESC, as higher price increases were generally levied in the early years of the five-year water plan
- between 2007–08 and 2009–10:
- the existence and severity of water restrictions and their associated impact on water consumption
- the need for water entities to purchase temporary water entitlements to guarantee supply to enable the continuous provision of essential services.
If operating deficits persist there is a risk that cash reserves will be depleted and expenditure on capital programs will need to be funded by new borrowings or curtailed. In particular, expenditure that is perceived to be discretionary, especially for maintenance, may need to be deferred or abandoned.
Figure 5C shows that the underlying result deteriorated in 2011–12 with 53 per cent of water entities (10 of 19) having an underlying result risk assessed as high or medium, an increase of 16 per cent from 2010–11.
Figure 5C
Underlying result risk assessment
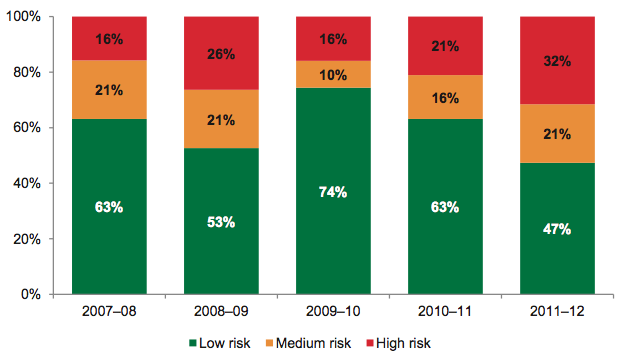
Source: Victorian Auditor-General’s Office.
The decline in 2011–12 reflects the impact of:
- revenue growth due to higher prices offset by lower water consumption as a result of above average rainfall during the year
- higher finance costs
- higher depreciation expense
- higher employee benefit expense
- higher superannuation costs.
The higher finance costs have been driven by substantial increases in borrowings across the sector from 1 July 2008 to finance the construction of infrastructure. This in turn has increased the value of assets and contributed to an increase in depreciation. The revaluation of infrastructure assets by the regional urban and rural entities in 2010–11 also contributed to higher depreciation expenses in 2011–12.
An actuarial investigation at 31 December 2011 by an industry defined benefit superannuation fund found that the fund had an unfunded liability of $406 million (excluding contributions tax). The fund subsequently requested employers to contribute to the shortfall. A number of regional urban and rural water entities make employer contributions to this fund and recognised their share of the funding shortfall at 30 June 2012. This led to higher superannuation costs in 2011–12.
5.3.2 Liquidity
Figure 5D shows that the average liquidity of the water entities has deteriorated over the five years, most significantly in the rural category, where at the start of the period, the liquidity ratio was relatively high.
Figure 5D
Average liquidity ratio
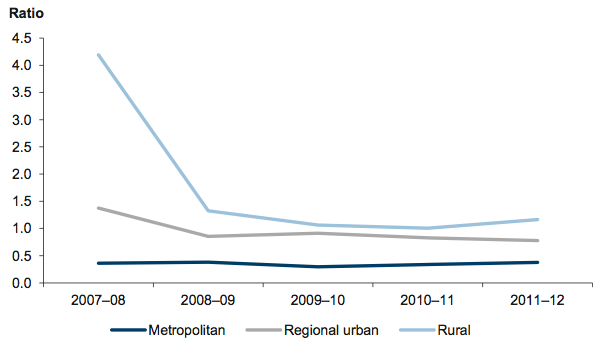
Source: Victorian Auditor-General’s Office.
The decline is a consequence of increased borrowings and payables, driven by the significant increase in capital works activity.
Lower water consumption also adversely affected revenue generated and available cash reserves. After a decade of below average rainfall and water restrictions, 2011–12 was one of the wettest years on record.
The 19 entities source their borrowings from the Treasury Corporation of Victoria. Entities have approval to refinance the maturing debt and in recent years have done so. While entities have approval to refinance maturing debt, they also need to generate sufficient cash flows from operations to:
- service the increasing interest charges as debt levels increase and the variable interest rates rise
- repay the growing debt in the long term.
Figure 5E indicates that 74 per cent of water entities (14 of 19) at 30 June 2012 had a liquidity risk assessed as high or medium, that is, their current liabilities exceeded current assets.
Figure 5E Liquidity risk assessment
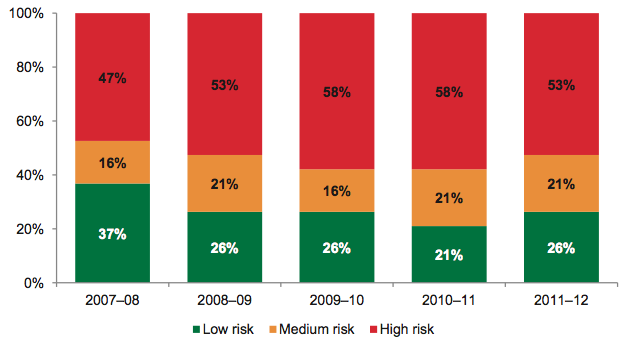
Source: Victorian Auditor-General’s Office.
While consistent with the past four years, the proportion of entities with high liquidity risk has increased by 6 per cent since 2007–08. The proportion assessed as low risk decreased by 11 per cent over the same period. In recent years, there has been no sign of recovery or improvement.
5.3.3 Interest cover
Figure 5F shows that the average interest cover varied by sector over the five years.
Figure 5F
Average interest cover ratio
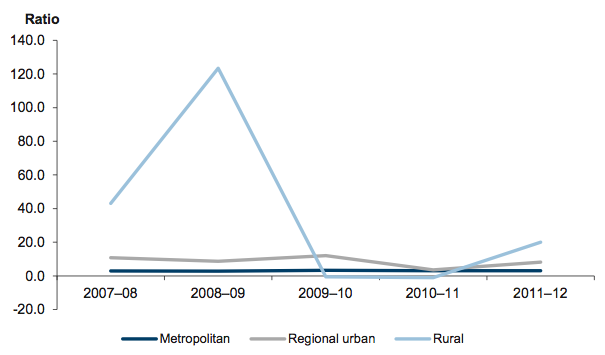
Source: Victorian Auditor-General’s Office.
The four metropolitan water entities maintained a consistent and adequate level of interest cover over the period. While their debt levels and finance costs increased significantly, they continue to generate strong profits and positive cash flows from their operations annually.
In contrast, four of the 13 regional urban water entities experienced a deteriorating level of interest cover. Finance costs rose because of additional borrowings, however, profits and operating cash inflows remained stable or declined. Despite this, the level of interest cover is still adequate for the majority at 30 June 2012.
The trend for the rural entities is more difficult to discern. Figure 5F shows a level of volatility reflecting the small number of entities in the cohort (two entities). The financial performance and position of the two entities need to be considered individually as the result for each is quite different.
Goulburn-Murray Water, in 2009–10 and 2010–11 generated negative operating cash flows, that is, cash payments exceeded cash receipts. As a result, it had no interest cover. The entity was unable to service the finance costs associated with its existing debt from the cash flows generated by its day-to-day operations. Drawing on new borrowings to pay operating costs is not sustainable in the long term. For the year-ended 30 June 2012 it generated positive cash flows.
Southern Rural Water, by comparison, generated positive operating cash flows each year over the period. Interest received also exceeded interest paid. The entity has a strong ability to service its debts and meet ongoing interest payments.
At 30 June 2012 both the rural entities had an adequate interest cover.
Figure 5G indicates that the interest cover risk was low for 95 per cent of water entities (18 of 19) at 30 June 2012, an improvement of 21 per cent from 2010–11.
Figure 5G
Interest cover risk assessment
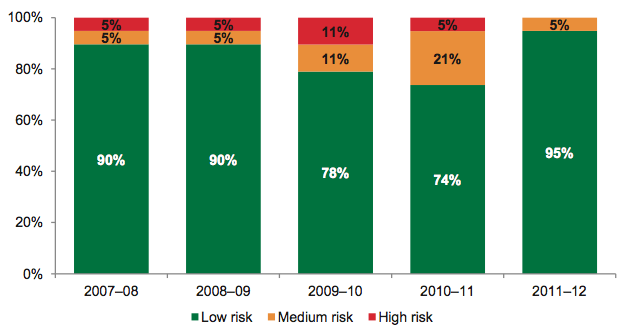
Source: Victorian Auditor-General’s Office.
The number of entities in the high- and medium-risk categories significantly decreased in 2011–12 in comparison to 2010–11.
5.3.4 Debt service cover
Figure 5H shows the average debt service cover ratio for the water industry by sector over the past five years. The ability for the water industry to repay debt from operating profits has decreased over the five years.
Figure 5H
Debt service cover
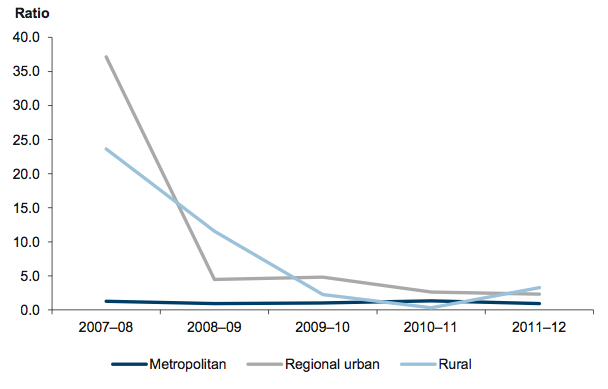
Source: Victorian Auditor-General’s Office.
An entity’s ability to service its debt varies depending on the sector.
The debt service cover for the metropolitan sector has remained consistent over the period, although both City West Water and Melbourne Water had a ratio of less than one at 30 June 2012.
Melbourne Water's ratio has been less than one every year, meaning that its operating income is insufficient to cover its annual debt repayments. While its interest cover ratio is strong and indicates that it is able to service the interest payments, the debt service cover ratio indicates that the ability to repay the debt is low. Melbourne Water has refinanced a large portion of its maturing debt in recent years.
Over the five-year period, Melbourne Water's debt has increased by $2.2 billion or 135 per cent. The 2012–13 price freeze due to the overbilling following delays with the desalination plant will impact its revenue and operating cash flows in the short term, and will further impact its ability to repay debt.
The debt service cover for City West Water was below a ratio of one in three of the past five years. The 2012–13 price freeze will also impact its revenue, cash flows and ability to repay debt.
The debt service cover for the regional urban sector has gradually declined over time. Prior to 2008–09, Lower Murray Water had a very high debt service ratio as it was able to finance its capital program without any borrowings.
The rural sector shows a gradual decline in the debt service cover from 2008–09 to 2010–11, after a marked fall from 2007–08 to 2008–09. The more recent decline was influenced by Goulburn-Murray Water's inability to generate sufficient revenue to make debt repayments. In 2011–12, the entity was able to increase the revenue it generated, thereby improving the ratio for that sector.
Figure 5I shows the number of entities in the low-risk category has remained relatively consistent over the five-year period.
Figure 5I
Debt service cover risk assessment
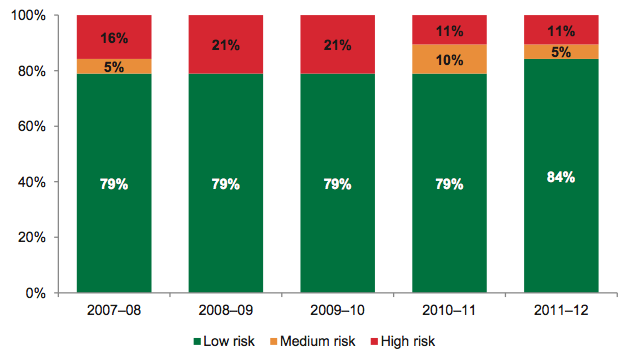
Source: Victorian Auditor-General’s Office.
5.3.5 Debt-to-assets
Figure 5J presents the average debt-to-assets ratio by sector over the past five years. It indicates that an entity’s reliance on debt to fund its assets varies depending on the sector.
Figure 5J
Debt-to-assets
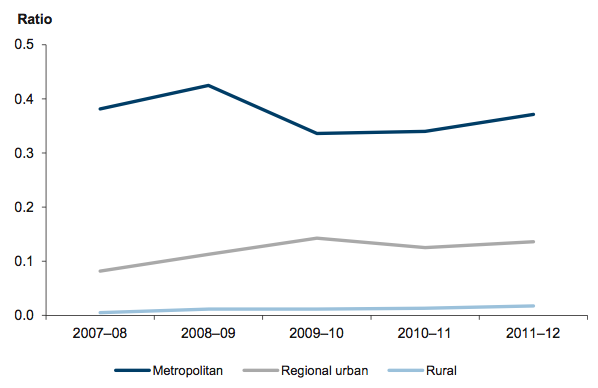
Source: Victorian Auditor-General’s Office.
Over the five years the rural entities maintained a low debt-to-assets ratio indicating limited reliance on debt to fund the assets they manage. Regional urban entities increased their level of debt to fund the acquisition of new assets. By contrast, the metropolitan entities continued to fund a larger proportion of their assets through debt.
For the metropolitan entities the ratio decreased sharply in 2009–10 as a result of the sector recording infrastructure assets at fair value for the first time. The regional urban and rural entities transitioned to fair value in 2010–11, with the revaluation contributing to the slight improvement in the sectors’ level of gearing.
Figure 5K indicates that, with the exception of one entity in 2008–09, all maintained an adequate level of gearing over the period.
Figure 5K
Debt-to-assets risk assessment
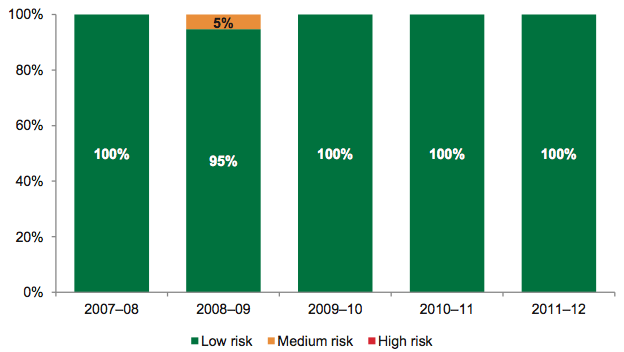
Source: Victorian Auditor-General’s Office.
5.3.6 Self-financing
Figure 5L shows that over the five years, the average self-financing ratio fluctuated on a yearly basis. However, the result in the most recent year shows an upward trend.
Figure 5L
Average self-financing indicator
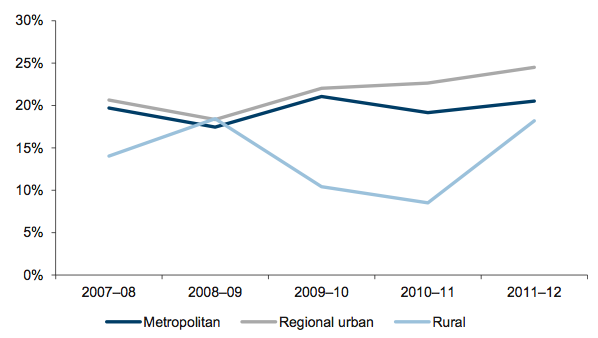
Source: Victorian Auditor-General’s Office.
The timing and magnitude of water price increases has a direct impact on a water entity’s revenue and the cash flows from operations. An entity’s ability to control operating costs during the period of lower water consumption also impacts the net cash flows from operations. A downward movement in the self-financing indicator signals that an entity’s ability to fund new assets or replace existing assets using cash generated by their operations has declined.
Figure 5M shows that in 2011–12, 11 per cent of entities (two of 19) had a high self‑financing risk compared with 21 per cent (four of 19) in 2010–11.
Figure 5M
Self-financing risk assessment
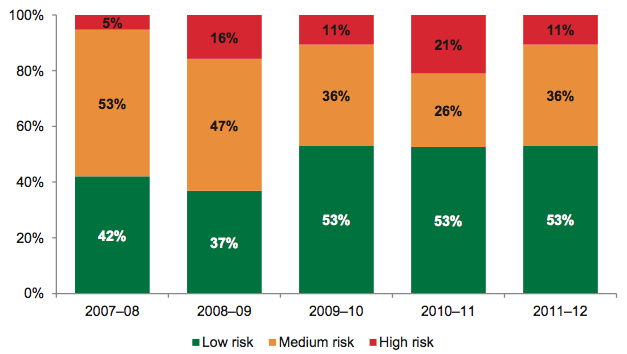
Source: Victorian Auditor-General’s Office.
The number of entities in the low-risk category has been stable over the past three years. The number of entities in the high-risk category has reduced as two entities were able to generate positive cash flows from operations in 2011–12.
5.3.7 Capital replacement
Figure 5N shows the average capital replacement indicator fluctuated over the five years.
Figure 5N
Average capital replacement indicator
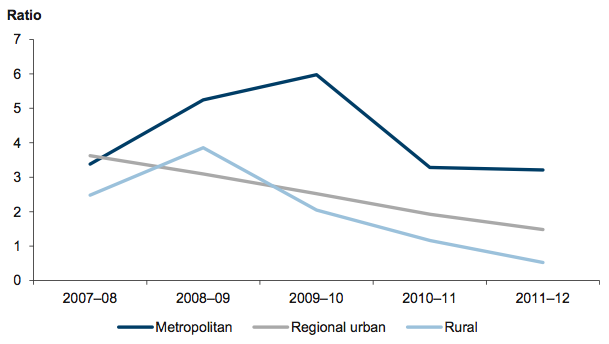
Source: Victorian Auditor-General’s Office.
The downward trend indicates that depreciation expense increased at a rate higher than the level of spending on infrastructure assets. However, caution is required when interpreting these results as annual spending on assets includes new and expanded facilities in addition to existing facilities, but excludes the cost of newly constructed assets that are transferred from another entity.
For the metropolitan water entities the decline in 2010–11 reflected the impact of the revaluation of infrastructure assets in 2009–10. For the regional urban and rural water entities the decline in 2011–12 reflected the impact of the revaluation of infrastructure assets in 2010–11. Depreciation expense increased in the year following the revaluations as a result of higher asset values.
Figure 5O shows that seven water entities—five regional urban and two rural entities—had a capital replacement indicator rated as high risk in 2011–12, which indicates their level of capital spending has not kept pace with the consumption of assets.
Figure 5O
Capital replacement risk assessment
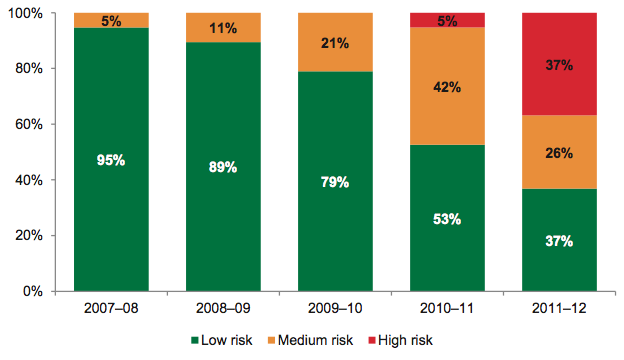
Source: Victorian Auditor-General’s Office.
The shift over the five years from low to medium and high risk is significant and reflects the impact of higher depreciation following the revaluation of assets in recent years. It also indicates that spending on capital expenditure is less than depreciation and that water entities may not be able to keep pace with the consumption of assets.
6 Internal controls
At a glance
Background
This Part presents the results of our assessment of general internal controls and controls over risk management and water tariff revenue.
Conclusion
Internal controls were adequate for producing reliable, materially accurate and timely financial reports. Nevertheless, a number of areas for improvement were identified.
Findings
- Forty-eight per cent of general control weaknesses identified in 2011–12 related to information technology.
- Forty-one internal control weaknesses identified and reported to management at 10 water entities in 2010–11 or earlier are yet to be resolved.This reflects poorly on the governing body and management of those entities and suggests that they are not effectively managing the risk of error within their financial reports or the security of information held in their IT systems.
- Risk management practices are considered mature.
- Four entities self-assessed that they are not compliant with the requirements of the Payment Card Industry–Data Security Standard (PCI–DSS). Three subsequently developed strategies to achieve the required level of compliance.
Recommendations
Water entities should:
- address long outstanding internal control weaknesses immediately, to demonstrate a commitment to management's responsibilities for ensuring sound internal controls are in place and are operating effectively
- assess their compliance with the PCI–DSS and act to achieve compliance if necessary
- change the default security settings on their key information systems and databases, including point of sale systems, immediately.
6.1 Introduction
Effective internal controls help entities to reliably and cost-effectively meet their objectives. Reliable internal controls are a prerequisite for the delivery of reliable, accurate and timely external and internal financial reports.
In our annual financial audits we focus on the internal controls relating to financial reporting, and assess whether entities have managed the risk that their financial reports will not be complete and accurate. Poor internal controls diminish management’s ability to achieve their entity’s objectives and comply with relevant legislation. They also increase the risk of fraud and error.
The governing body of each water entity is responsible for developing and maintaining internal controls that enable:
- preparation of accurate financial records and other supporting information
- timely and reliable external and internal reporting
- appropriate safeguarding of assets
- prevention and detection of errors and other irregularities.
The Standing Directions of the Minister for Finance require management to implement effective internal control structures.
In this Part we report on aspects of internal controls in the state’s 19 water entities including controls over:
- risk management
- water tariff revenue.
6.2 General internal controls
Internal controls at the 19 water entities were adequate for maintaining the reliability of external financial reporting. Nevertheless, 113 control weaknesses were reported to the governing bodies and management of the 19 water entities in 2011–12. The majority related to information technology (54 issues or 48 per cent), while the remaining were instances where internal controls need to be strengthened to improve the rigour of operational management (59 issues or 52 per cent).
The common areas requiring improved controls were:
- information technology
- monitoring and maintenance of fixed assets
- revenue and accounts receivables
- payroll
- preparation and review of general ledger reconciliations.
Figure 6A sets out the financial areas and systems with the highest occurrence of weaknesses in 2011–12.
Figure 6A
Internal control weaknesses by account balance and system
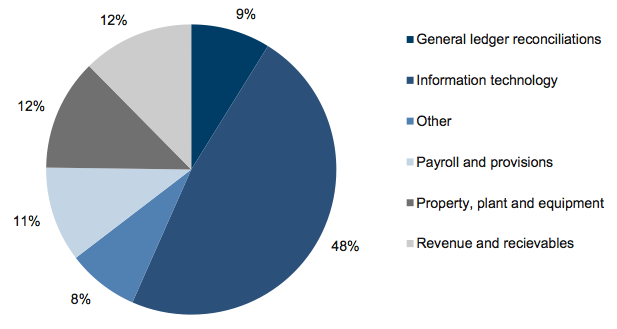
Source: Victorian Auditor-General’s Office.
6.2.1 Information technology controls
Information technology (IT) controls protect computer applications, infrastructure and information assets from a wide range of security and access threats. They promote business continuity, minimise business risk, reduce the risk of fraud and error, and help meet business objectives.
There is extensive reliance on IT across the water industry, and there is continual upgrade and replacement of systems to improve information management and the quality of services provided to the community. With the implementation of new IT or upgrade of existing systems, and the continuing emergence of external threats, new security risks to the IT environment can arise regularly.
Information held by water entities about employees, customers and suppliers, and the financial and operational aspects of the business can be highly sensitive. It needs to be protected from unauthorised access, theft or manipulation.
Fifty-four information technology control weaknesses were identified at 10 of the 19 entities (53 per cent) in 2011–12 relating to:
- systems access rights (21 issues)
- password settings (five issues)
- other security issues (12 issues)
- information system policies and procedures (seven issues)
- information systems change management (four issues)
- data security over payments from customers by credit or debit card (three issues)
- business continuity and disaster recovery planning (two issues).
The issues identified were rated high risk (four issues or seven per cent), medium risk (32 issues or 59 per cent) and low risk (18 issues or 34 per cent). Sixteen (30 per cent) of the issues identified in 2011–12 have now been resolved.
Twenty-one of the 54 (39 per cent) issues identified in 2011–12 related to inappropriate or inadequate systems access such as:
- access to privileged user accounts
- removal of terminated users accounts
- physical access to secure IT areas
- ongoing review of user accounts.
Controls over data security of payments made to water entities by credit and debit cards are discussed in greater detail later in this Part. Comment about the timeliness of addressing IT control weaknesses also appears later in this Part.
6.2.2 Maintenance of fixed assets
Water entities have substantial fixed assets including infrastructure, land, buildings and plant and equipment. The assets need to be appropriately recorded and maintained and their condition and use monitored so that decisions about whether they are appropriately valued and when they need to be replaced can be made. Inadequate recording and monitoring of assets can lead to their misappropriation and misplacement. It is important that stocktakes of assets are performed regularly.
Control weaknesses over the capitalisation, maintenance and monitoring of assets were identified at eight of the 19 entities. Common weaknesses were:
- untimely capitalisation of fixed assets
- incorrect valuation or no valuations conducted
- absence of stocktakes of plant and equipment for a number of years.
6.2.3 Revenue and accounts receivable
The billing system is a key financial reporting system for a water entity, given the materiality of the service and usage charges raised. Effective internal controls are essential and policies and procedures should clearly specify criteria for recognising revenue, and be responsive to changing circumstances.
While the internal controls were assessed as adequate, the following weaknesses were identified:
- credit notes not appropriately approved
- inconsistencies between procedures and practices for approving of bad debt write-offs
- absence of formal processes and follow-up of metering exceptions.
Weaknesses in controls over billing systems and receivables were found at nine of the 19 entities (47 per cent).
6.2.4 Payroll
Salaries and wages are a substantial business cost. Adequate internal controls should therefore exist over the processing and monitoring of salaries and related costs, to mitigate the risk of error, fraud or mismanagement.
Payroll control weaknesses were found at eight of the 19 entities (42 per cent). The following common payroll related weaknesses were identified:
- timesheets not authorised
- staff with excessive annual leave balances
- exception reports and changes to employee bank accounts not independently checked.
6.2.5 Preparation and review of account reconciliations
A financial report is generally prepared based on information captured by the entity's general ledger, with key balances within the general ledger often supported by information recorded in subsidiary ledgers such as accounts payable, billings, fixed assets and payroll systems. Periodic reconciliation of the general ledger with the subsidiary ledger balances is vital to confirm the completeness and accuracy of data.
Timely preparation and independent review of key account reconciliations decreases the risk that errors may go undetected or may not be resolved in a timely manner, both of which can adversely affect the accuracy of periodic financial reporting.
Issues relating to key account reconciliations were identified at seven of the 19 entities (37 per cent), comprising one metropolitan and six regional urban entities. The key issues were:
- reconciliations not prepared in a timely manner
- reconciliations not independently reviewed in a timely manner
- long outstanding unreconciled amounts, with no indication of when they would be cleared or why they were still listed.
6.2.6 Status of prior year issues
Internal control weaknesses reported to management, the governing body and/or audit committee should be actioned and resolved in a timely manner. Forty-one internal control weaknesses identified and reported to management at 10 water entities in 2010–11 or earlier were yet to be resolved by management.
Figure 6B sets out the financial areas and systems that had the highest occurrence of outstanding internal control weaknesses. Sixty-six per cent relate to IT.
Figure 6B
Outstanding internal control weaknesses by account balance and system
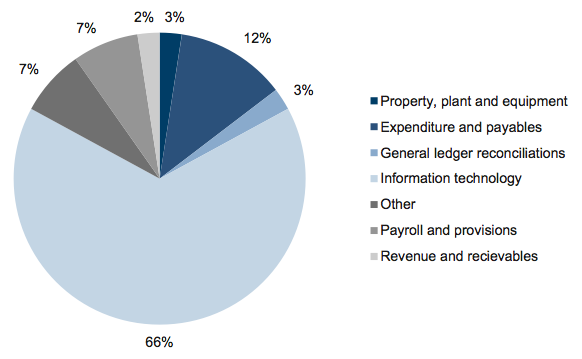
Source: Victorian Auditor-General’s Office.
The weaknesses were spread across metropolitan, regional urban and rural water entities.
The failure to address previously identified and reported internal control weaknesses reflects poorly on the governing body and management of the 10 water entities. It suggests that they are not effectively managing the risk of error within the financial report or the security of information held in IT systems.
6.3 Risk management controls
Risk management is an important element of governance. Effective risk management is increasingly important as the water sector adopts more sophisticated approaches to service delivery and scrutiny from the community increases.
Some risks may be statewide—for example, the risk to the continuity or quality of the water supply posed by terrorism—and require a coordinated risk management approach across entities. Other risks relate to the operations of individual entities and require an entity-level risk management approach. At the entity level, risks can be categorised as strategic, commercial, operational, technical, financial and compliance.
A sustained period of below average rainfall and drought over the years to 2010 led the state and water businesses to develop, and implement, strategies aimed at mitigating the risk to the supply of water and reducing water consumption. However, following a period of regular rainfall over the past 12 to 18 months, storages across regional Victoria are now nearing full capacity and Melbourne’s storages have reached 80 per cent for the first time in many years.
When circumstances change substantially, management should revisit the strategic, business and operational risks of their businesses.
Water entities are required to establish and implement a risk management framework to identify risks, to assess the likelihood and impact of the risk's occurrence, and to put in place measures to manage those risks.
6.3.1 Risk management framework
The key elements of an effective risk management framework are detailed in Figure 6C. The framework draws upon the requirements of:
- Risk management standard AS/NZS ISO 31000:2009
- the Standing Directions of the Minister for Finance
- Victorian Government Risk Management Framework July 2007
- Financial Management Act 1994
- Public Administration Act 2004
- Victorian Managed Insurance Authority Act 1996.
Figure 6C
Key elements of an effective risk management framework
|
Component |
Key elements |
|---|---|
|
Policy |
Risk management policy established and includes:
Requires the development of a risk register that:
Requires approval of risk management policies and procedures by the governing body. Requires oversight of the risk management processes to be included in the terms of reference of the Audit and Risk Committee. Requires annual review of the policy by the Audit and Risk Committee. |
|
Management practices |
Systems and processes for considering new and emerging risks and revision of existing risks. Business risks identified, categorised and rated with appropriate consideration of likelihood and consequence, within a register providing critical risks for executive management attention. Mitigation strategies (treatment plans) developed, aiming to minimise the potential consequences of identified risks. Risk management principles incorporated into strategic and business planning. Appropriate education and training of staff to enable risk principles to be appreciated and responsibilities understood. Resources provided to manage the risk management framework. Systems for gathering and analysing incident data in a form that facilitates identification of adverse trends requiring attention. Status reports on progress in dealing with critical and extreme risks and in implementing mitigation strategies (treatment plans) prepared regularly and forwarded to the executive and governing body or director. Benchmarking of entity risk profile with available industry data. |
|
Governance and oversight |
Oversight of the risk management processes by Audit and Risk Committee. Review and approve risk management policies and procedures by the governing body. Consider risk reports provided, and take appropriate action where required. Contribute to an entity risk workshop. Conduct independent assessments (using internal audit) of the integrity of the entity's risk management. |
Source: Victorian Auditor-General’s Office based on the Victorian Government Risk Management Framework and Risk management standard AS/NZS ISO 31000:2009.
These elements were considered in our assessments of the risk management frameworks of the water entities.
While risk management practices are considered mature and controls are adequate, improvements can be made by:
- referencing the Standing Directions of the Minister for Finance
- engaging the governing body in risk management workshops
- using risk management software
- providing regular training to staff about risk management
- annual review of risks by the governing body or audit committee.
6.3.2 Policies
All water entities had risk management policies based on the principles of the Risk Management Standard AS/NZS ISO 31000:2009.
Fifteen of 19 water entities (79 per cent) did not refer to the Standing Directions of the Minister for Finance in their policies. This does not indicate noncompliance with the Standing Directions, however, the requirements of the Standing Directions may not be considered when preparing and/or updating their policies.
All policies established clear assignment of responsibilities to people or positions and required treatment plans to manage identified risks.
At 18 of 19 water entities the risk management framework specified how often the risk register was to be reviewed. The following time frames were noted:
- bimonthly—one entity (5 per cent)
- quarterly—four entities (21 per cent)
- biannually—three entities (16 per cent)
- annually—10 entities (53 per cent).
Overall, the policies of the water entities were robust and generally addressed the elements outlined in Figure 6C. There was no significant difference in the quality of the policies between metropolitan, regional urban and rural water entities.
6.3.3 Management practices
Strategic and business planning
All water entities had risk management embedded in their strategic planning. This was achieved through processes such as the development of corporate plans, water plans and the internal reporting of risks. Seventeen of 19 water entities (89 per cent) used external experts, such as internal audit or Victorian Managed Insurance Authority (VMIA), to assist with the refresh of risk assessments.
Tracking, evaluating and assessing current and emerging risks
Seventeen of 19 water entities engaged external experts, such as internal audit, to review risk registers and assist with developing mitigation plans.
The process of reviewing and monitoring emerging risks was generally robust. All water entities had updated their risk registers in the last financial year by conducting environmental scans, operational risk profiling, workshops and through regular management committee meetings. The governing body was involved in workshops at 13 water entities (68 per cent).
The water industry benchmarks through a statewide risk register coordinated by the Department of Sustainability and Environment, which prepares a report annually that allows each entity to compare itself with like entities.
Maintaining a risk register
All water entities used risk registers, while 12 water entities (63 per cent) used risk management software either separately or in conjunction with a risk register. All risk registers were reviewed in the last financial year and are reviewed at least annually.
Management of risks
Management and reporting of risks such as noncompliance, hazards, incidents, accidents, losses and claims varied between the 19 water entities. Entities used different methods for recording and reporting on these risks. All water entities used a database or specific software to record and track the risks.
The frequency of reporting on risks varied depending on the nature of the risk. All water entities reported on the status of these risks to the governing body, audit committee and executive management at least annually.
Training
Eighteen of 19 water entities (95 per cent) provided training on risk management practices to staff. The training methods ranged from ad hoc risk management workshops and presentations to structured workshops conducted by the risk manager or external specialists.
Seventeen of 19 water entities (89 per cent) conducted risk management workshops for executive management to assess risks.
Communication of risks
The water entities communicated and promoted risk management by different methods including:
- workshop sessions (six entities—32 per cent)
- publishing policies and procedures on the intranet (seven entities—37 per cent)
- at planning days, training and through the induction process (six entities—32 per cent).
Contractors
All water entities outsource maintenance and capital programs to contractors. These arrangements form a significant part of each water entity's business and are incorporated into risk management practices. This involves the water entities including risk management requirements in tender information and contract arrangements.
Seventeen of 19 water entities (89 per cent) performed regular reviews of long-term contracts to keep risk management practices current. This was done through site visits, occupational health and safety assessments and regular reviews of contractor risk management practices.
6.3.4 Governance and oversight
Risk management committees
Seventeen of 19 water entities (89 per cent) had a separate risk management committee that included members of senior management and the risk manager. In most cases, risk management committees were established to identify emerging risks and monitor the progress of risk treatments. These committees either reported to the governing body or the audit committee.
For those entities that had not established a separate risk management committee, responsibility for risk management rested with the audit committee or governing body.
Review of policies
Fourteen of the 19 water entities (74 per cent) reviewed their risk management strategy, policy and framework at least annually and five water entities (26 per cent) every two years.
The Victorian Government Risk Management Framework requires public sector agencies to confirm that their risk identification and management plan is consistent with the requirements of Risk Management Standard AS/NZS ISO 31000:2009. The 2011–12 annual report of each water entity included a statement by the Managing Director on compliance with risk management standards.
Review of risks and risk registers
In all water entities, executive management was involved in identifying and assessing risks at least annually. In 10 of 19 water entities (53 per cent) assessments were reviewed by the governing body and/or audit committee, and by executive management committees only at nine water entities (47 per cent).
Risk reporting
All water entities reported on risk management to their governing body or audit committee at least annually. The reporting process included preparation of reports on emerging risks and trends, updated risk registers and a progress report against treatments in the mitigation plans.
Independent assessments
External reviews provide the governing body and management with independent feedback about the appropriateness and effectiveness of an entity's risk management framework. External bodies such as the VMIA provide professional guidance and advice and an effective internal audit plan should address areas of risk and be aligned to an entity's risk register.
We reviewed the use of external organisations by the water entities, and identified that:
- all water entities had a review conducted by VMIA, although only nine had been reviewed in the past two financial years
- internal audit considered the most critical risks in the entity's risk register when developing the internal audit program at 18 entities.
6.4 Water tariff revenue
In 2011–12, the 19 water entities generated $4.4 billion in revenue 86 per cent of which was through tariff charges for water, sewerage and drainage services. The tariff levied on its customers by a water entity is approved by the Essential Services. Tariff structures vary across the 19 water entities with the water and sewerage tariff comprising a fixed and variable charge.
Changes in customer attitude and behaviour with respect to water consumption impact on the revenue raised and the profitability of the businesses.
6.4.1 Water tariff revenue framework
Effective controls over water tariff revenue include:
- comprehensive policies and procedures
- appropriate management practices
- sound governance and oversight.
Figure 6D outlines the key elements of an effective water tariff revenue framework. It draws on the:
- Australian Accounting Standards
- Financial reporting directions issued by the Minister for Finance
- Financial Management Act 1994
- Payment Card Industry–Data Security Standard (PCI–DSS).
Figure 6D
Key elements of an effective water tariff revenue framework
|
Component |
Key element |
|---|---|
|
Policies and procedures |
Policy and procedures relating to water tariff revenue exist and:
|
|
Management practices |
Appropriate segregation of duties relating to metering, billing, receipting and credit management. Restriction of access to the billing system and accounts receivable module. Independent review and authorisation of changes to tariff schedules within the billing system. Review of account coding and mathematical accuracy of tariffs invoiced. Customer billing queries investigated in a timely manner. Periodic and timely independent reconciliation of accounts receivable to the general ledger. Periodic and timely independent reconciliation of the bank account. Appropriate monitoring and segregation of duties relating to the creation, approval and issue of credit notes. Appropriate approval of bad debt write offs. Monitoring of compliance with the PCI–DSS. Reporting to senior management and the governing body regularly. Management review of policy, procedures and practices periodically. |
|
Governance and oversight |
Policies and procedures approved by the governing body. Periodic review of policies by the governing body. Compliance with approved policies and procedures monitored. Independent checks (by internal audit) of compliance with water tariff revenue policies, procedures and practices. |
Source: Victorian Auditor-General’s Office.
We assessed the controls over water tariff revenue for the 19 water entities by considering these elements.
Controls were adequate, although improvements can be made by developing more comprehensive policies and by enhancing monitoring and oversight activities.
6.4.2 Policies and procedures
Existence of water tariff revenue policies and procedures
Policies and procedures relating to water tariff revenue should address metering, billing, receipting and credit management. Of the 19 water entities most had specific policies and procedures relating to:
- metering—79 per cent
- billing—89 per cent
- receipting—89 per cent
- credit management—95 per cent.
Adequacy of policies and procedures
The policies and procedures relating to water tariff revenue are quite detailed. The majority of policies and procedures of the 19 entities:
- incorporated an objective—84 per cent
- specified the frequency at which the policy should be reviewed and updated—68 per cent
- specified who is to approve changes to the policy—68 per cent
- clarified the roles and responsibilities of staff—63 per cent
- addressed record keeping matters—74 per cent.
Conversely, 63 per cent of the policies and procedures reviewed did not contain references to the requirements of the financial reporting framework.
Policies of metropolitan and regional urban entities were more comprehensive than those of rural entities.
6.4.3 Management practices
Management implemented the following key controls at 95 per cent of the water entities:
- appropriate restriction of access to the billing system and accounts
- review of account coding and mathematical accuracy of tariffs invoiced
- investigation of customer billing queries in a timely manner.
Management at all water entities implemented appropriate:
- segregation of duties
- independent review and authorisation of changes to tariff schedules
- periodic and timely reconciliation of accounts receivable to the general ledger
- periodic and timely reconciliation of the bank account.
Credit notes
Credit notes are issued when an invoice is overstated, issued in error, or when rates are not properly applied. Seventeen entities provided credit notes to their customers, and 53 per cent (9 of 17 entities) generated reports detailing the number and value of credit notes issued.
However, when they did report, only 47 per cent detailed the key reason for a credit note and outlined action taken or planned to reduce the need for them. Only 21 per cent of reports contained a trend analysis.
Two water entities did not provide credit notes to their customers. When there is an error with the customer's account, these water entities adjust the customer's next bill.
Bad debt write-offs
The level of bad debt write-offs increased by 64 per cent to $10 million over the five years from 2007–08 to 2011–12. Figure 6E shows the five-year trend of bad debt write-offs.
Figure 6E
Trend in bad debt write-offs, 2007–08 to 2011–12
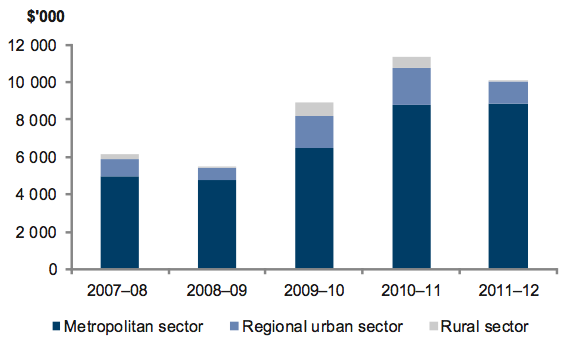
Source: Victorian Auditor-General’s Office.
All entities had implemented appropriate segregation of duties relating to the write-off of bad debts. Reports generated at 17 of the 19 entities detailed the number and value of bad debts written-off. Reports were prepared:
- on a weekly basis at one entity
- on a monthly basis at nine entities
- on a quarterly basis at two entities
- biannually at one entity
- annually at four entities.
One entity did not generate regular reports detailing the number and value of bad debt write-offs. However, its bad debts were submitted to its board for final approval, as they arose.
Sixteen of the 17 reports detailed the key reasons for the write-off and were independently reviewed. Only 41 per cent contained a trend analysis showing the number of bad debts, average value of debts or statistics over time.
Controls over bad debt write-offs are strong. Nevertheless, as water prices are likely to rise in the future and with consumers facing pressures from tight economic conditions and increasing costs of living, the water entities need to consider risk and mitigation strategies to reduce bad debt write-offs.
Payment options
Customers have a variety of options for paying their water bills including payment by cash, cheque, Bpay, credit card and debit card.
Figure 6F shows the payment options currently used by customers to pay their water bills.
Figure 6F
Payment options used by customers to pay their water bills, 2011–12
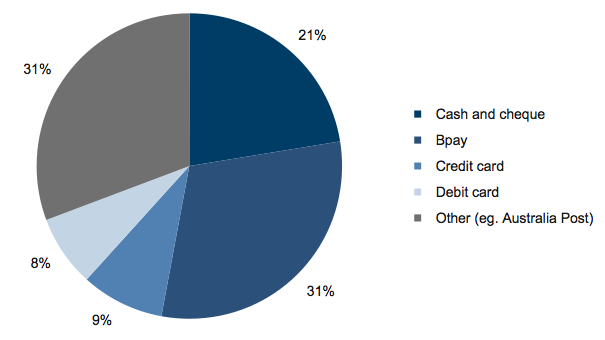
Source: Victorian Auditor-General’s Office.
Customers can make payments using their credit/debit cards using:
- internet—at 89 per cent of water entities
- auto-debit instructions—at 68 per cent
- call centre—at 58 per cent
- over the counter—at 79 per cent
- Australia Post—at 89 per cent.
While payments attributed to credit/debit card are small in comparison to the volume paid through Bpay or other facilities, payments through those facilities may also involve the use of credit or debit cards.
Entities that receive payments through debit and credit cards need to have adequate policies and procedures for handling customer personal information, or to obtain sufficient assurance from facilitating agencies that information is protected and that the revenue data is accurate and complete.
Only 37 per cent of water entities handling customer credit card/debit card information had a related policy.
Compliance with the Payment Card Industry–Data Security Standard
The PCI–DSS addresses the storage and handling of customer credit and debit card information and data. It was developed by MasterCard, Visa, American Express, Discover Financial Services and JCB to establish consistent data security requirements globally.
PCI–DSS deals with systems, policies and procedures over:
- having and maintaining a secure network
- protection of cardholder data
- maintaining a vulnerability management program
- strong access controls
- regular monitoring and testing of networks
- maintaining an information security policy.
Any water entity that processes, stores and transmits credit or debit card information and data should comply with the standard.
Management at 74 per cent of water entities (14 of the 19 entities) had assessed the risks associated with the handling of customer credit and debit card information and data.
Staff at 10 entities processed credit and debit card information and data. Of the 10, seven (70 per cent) had self-assessed their compliance with the PCI–DSS requirements. None had engaged external parties to conduct assessments of compliance.
Four of the entities that had conducted a self-assessment determined that they were not compliant with the requirements of the PCI–DSS. Three of these had subsequently developed strategies to achieve compliance.
Inappropriate practices that required immediate action were:
- capture and retention of the three or four digit CCV numbers of customers (in 11 per cent or two entities)
- not masking credit or debit card numbers to show the last four digits only (in 5 per cent or one entity)
- not restricting access to customers' credit or debit card details (in 5 per cent or one entity).
All water entities used a third party, e.g., Australia Post, Westpac or ANZ to capture, process, transmit and/or store customer credit and debit card information and data. All confirmed that the third party used was PCI–DSS compliant. The water entities obtain written assurances from the third party regarding compliance with PCI–DSS.
Eleven water entities used point of sale (POS) software from the list of Validated Payment Applications. However, only seven of the 11 had changed the default password settings on the key systems and databases that are part of the POS system.
Water entities should invest in improving the protection of their customers’ credit and debit card information and data. Poor security controls and noncompliance with PCI‑DSS increases the risk of identity theft and fraud, thereby exposing the water entity to reputational risk and financial penalties.
6.4.4 Governance and oversight
Approval and review of policies and procedures
At 12 of 19 entities with water tariff revenue policies and procedures, the governing body approved them. At four entities this responsibility had been delegated to management.
Monitoring of compliance and performance
Seventy-eight per cent of the governing bodies with policies and procedures assessed compliance with legislation and approved policies and procedures.
The water tariff revenue information provided to the governing body allowed it to effectively monitor the entity's performance.
Regular and comprehensive reporting to the governing body
The governing body at 68 per cent of the water entities set key performance indicators related to water tariff revenue. Examples included:
- debt management
- the number, value and timeliness of issuing bills
- forecast volumes
- net result.
All entities provided the governing body and/or audit committee with reports showing actuals versus budget tariff revenue, an analysis of water volumes against forecasts and the ageing of debt. Seventy-four per cent provided reports that included an analysis of customer numbers against forecast. Reporting was performed monthly, quarterly or annually at most of the entities.
Internal audit
Over the past three years, 63 per cent of water entities had used internal audit to assess the degree of compliance with the entity’s water tariff revenue policies and procedures and the operating effectiveness of the key controls.
Recommendations
Water entities should:
- assess their policies and procedures against the common general internal control weaknesses and the better practices identified, and act in a timely manner to address shortcomings
- take timely action to address identified information technology, fixed assets, payroll, billings system and accounts receivable and general ledger reconciliation control weaknesses
- address long outstanding internal control weaknesses immediately, to demonstrate a commitment to management's responsibilities for ensuring sound internal controls are in place and are operating effectively
- strengthen their oversight of credit notes by generating reports that detail the number and dollar value, key reason, action taken or planned and a trend analysis
- develop and maintain comprehensive credit/debit card policies and procedures which are appropriately approved and subject to regular review
- assess compliance against the requirements of the Payment Card Industry–Data Security Standard and act quickly to achieve compliance in order to protect the security of customer credit and debit card information and data
- change the default security settings on their key information systems and databases, including point of sale systems, immediately.
Appendix A. Acronyms and glossary
Acronyms
AAS Australian Accounting Standard
AASB Australian Accounting Standards Board
DSE Department of Sustainability and Environment
ESC Essential Services Commission
FMA Financial Management Act 1994
FRD Financial Reporting Direction
VAGO Victorian Auditor-General's Office
Glossary
Accountability
Responsibility of public sector entities to achieve their objectives, with regard to reliability of financial reporting, effectiveness and efficiency of operations, compliance with applicable laws, and reporting to interested parties.
Amortisation
The systematic allocation of an intangible asset's capital value as an expense over its expected useful life to take account of normal usage, obsolescence, or the passage of time.
Asset
A resource controlled by an entity as a result of past events, and from which future economic benefits are expected to flow to the entity.
Asset useful life
The period over which an asset is expected to provide the entity with economic benefits. Depending on the nature of the asset, the useful life can be expressed in terms of time or output.
Asset valuation
The fair value of a non-current asset on a particular date.
Audit Act 1994
An Act of the State of Victoria that establishes the:
- operating powers and responsibilities of the Auditor-General
- the operation of his office—the Victorian Auditor-General's Office (VAGO)
- nature and scope of audits conducted by VAGO
- relationship of the Auditor-General with the Public Accounts and Estimates Committee as the representative body of Parliament
- Auditor-General's accountability to Parliament for discharge of the position's responsibilities.
Auditor’s opinion
Written expression within a specified framework indicating the auditor’s overall conclusion on the financial (and performance) reports based on audit evidence obtained.
Capital expenditure
Amount capitalised to the balance sheet for contributions by a public sector entity to major assets owned by the entity, including expenditure on:
- capital renewal of existing assets that returns the service potential or the life of the asset to that which it had originally
- capital expansion which extends an existing asset at the same standard to a new group of users.
Clear audit opinion – financial report
A positive written expression provided when the financial report has been prepared and presents fairly the transactions and balances for the reporting period in accordance with the requirements of the relevant legislation and Australian accounting standards.
Also referred to as an unqualified audit opinion.
Clear audit opinion – performance report
A positive written expression provided when the performance report has been prepared and presents fairly the performance indicators and results of performance for the reporting period in accordance with the requirements of the relevant legislation.
Also referred to as an unqualified audit opinion.
Corporations Act 2001
An Act of the Commonwealth of Australia that sets out the laws dealing with business entities in Australia at federal and interstate levels. It focuses primarily on companies, although it also covers some laws relating to other entities such as partnerships and managed investment schemes.
Depreciation
The systematic allocation of a fixed asset's capital value as an expense over its expected useful life to take account of normal usage, obsolescence, or the passage of time.
Emphasis of matter
An auditor's report can include an emphasis of matter paragraph that draws attention to a disclosure or item in the financial report that is relevant to the users of the auditor's report but is not of such nature that it affects the auditor's opinion (i.e. the auditor's opinion remains unmodified).
Employee leave liabilities
Employees' accrued service entitlements, including all accrued costs related to employment comprising of wages and salaries, leave entitlements, redundancy payments and superannuation contributions.
Entity
A body whether corporate or unincorporated that has a public function to exercise on behalf of the state or is wholly owned by the state, including: departments, statutory authorities, statutory corporations and government business enterprises.
Equity or net assets
Residual interest in the assets of an entity after deduction of its liabilities.
Expense
Outflows or other depletions of economic benefits in the form of incurrence of liabilities or depletion of assets of the entity, other than those relating to contributions by owners, that result in a decrease in equity during the reporting period.
Fair value
The amount for which a financial or non-financial asset could be exchanged between knowledgeable and willing parties in an arm’s-length transaction.
Financial Management Act 1994
The Act of the State of Victoria that establishes the financial administration and accountability of the public sector, as well as annual reporting to the Parliament by all departments and public sector bodies.
Financial report
Structured representation of financial information, which usually includes accompanying notes, derived from accounting records and intended to communicate an entity’s economic resources or obligations at a point in time or the changes therein for a period in accordance with a financial reporting framework.
Financial reporting direction
A direction issued by the Minister for Finance to achieve consistent application of accounting treatments across the Victorian public sector in compliance with a particular Australian Accounting Standards or Interpretations issued by the Australian Accounting Standards Board (AASB). Generally issued when a standard or interpretation provides accounting treatment options.
Financial sustainability
An entity's ability to manage financial resources so it can meet spending commitments, both at present and into the future.
Financial year
The period of 12 months for which a financial report (and performance report) is prepared.
Going concern
An entity which is expected to be able to pay its debts as and when they fall due, and continue in operation without any intention or necessity to liquidate or otherwise wind up its operations.
Independent auditor’s report
An expression of the independent auditor’s opinion on an entity’s financial (and performance) report.
Internal controls
Processes affected by an entity’s structure, work and authority flows, people and management information systems, designed to assist the entity accomplish specific goals and objectives. Internal controls are a means by which an entity’s resources are directed, monitored and measured. They play an important role in preventing and detecting error and fraud and protecting the entity’s resources.
Liability
A present obligation of the entity arising from past events, the settlement of which is expected to result in an outflow of resources from the entity.
Masterfile
A database of records pertaining to one of the main subjects of an information system, such as customers, employees and vendors. Masterfiles contain descriptive data that does not often change, such as name and address and bank account details.
Materiality
Depends on the size or nature of the item or error judged in the particular circumstances of its omission or misstatement. Thus, materiality provides a threshold or cut-off point rather than being a primary qualitative characteristic which information must have if it is to be useful.
Information is material if its omission or misstatement could influence the economic decisions of users taken on the basis of the financial report.
Net result
Calculated by subtracting an entity’s total expenses from its total revenue, to show what the entity has earned or lost in a given period of time.
Performance report
A statement containing predetermined performance indicators and targets and actual results achieved against these for that financial year, with an explanation for any significant variance between the results and targets.
Revenue
Inflows of funds or other enhancements or savings in outflows of service potential, or future economic benefits in the form of increases in assets or reductions in liabilities of the entity, other than those relating to contributions by owners which result in an increase in equity during the reporting period.
Risk
The chance of a negative impact on the objectives, outputs or outcomes of the entity.
Unqualified audit opinion – financial report
A positive written expression provided when the financial report has been prepared and presents fairly the transactions and balances for the reporting period in accordance with the requirements of the relevant legislation and Australian accounting standards.
Also referred to as a clear audit opinion.
Unqualified audit opinion – performance report
A positive written expression provided when the performance report has been prepared and presents fairly the performance indicators and results of performance for the reporting period in accordance with the requirements of the relevant legislation.
Also referred to as a clear audit opinion.
Water Act 1989
An Act of the State of Victoria that establishes the:
- governance and operational management of water entities
- management of surface and ground water
- water entitlement licence, trading, pricing consultation, arrangements, issuance and allocation.
Appendix B. Accountability arrangements
Governance
The responsible minister for the water industry is the Minister for Water. The relationship between the Minister for Water and the water entities is established by the Water Act 1989.
The Water Group, a business unit within the Department of Sustainability and Environment, supports and advises the Minister for Water.
The 19 water entities also report to the Treasurer of Victoria.
Figure B1 provides an overview of the accountability arrangements and lines of reporting, as at the date of this report, by the 19 water entities that provide essential water and sewerage services to people living in Victoria. It excludes Watermove, a controlled subsidiary of Goulburn-Murray Water.
Figure B1
Water industry overview – accountability arrangements
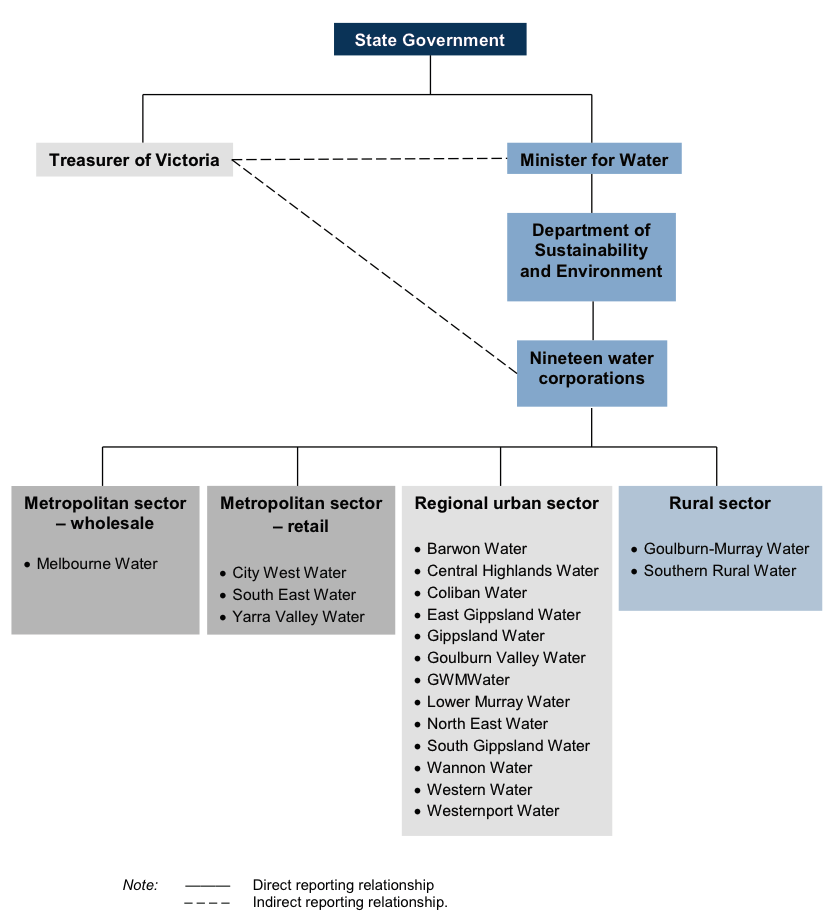
Source: Victorian Auditor-General’s Office.
Appendix C. Reports on the results of the 2011–12 financial audits
Reports
This report is the third of six reports to be presented to Parliament covering the results of our audits of public sector financial reports. The reports in this series are outlined in Figure C1.
Figure C1
VAGO reports on the results of the 2011–12 financial audits
Report |
Description |
|---|---|
Auditor-General’s Report on the Annual Financial Report of the State of Victoria, 2011–12 |
The report provided the result of the audit of the state’s annual financial report. It addressed the quality and timeliness of financial reporting, explained significant financial results for the state and financial implications of significant projects and developments that occurred during 2011–12 and subsequent to year end. Tabled in Parliament on 14 November 2012. |
Public Hospitals: Results of the 2011–12 Audits |
The report provided the results of the audits of approximately 110 entities, addressed the timeliness of their financial reporting, their financial sustainability, reviewed the operations of their audit committees, aspects of how they managed capital projects and analysed self-generated hospital revenue. Tabled in Parliament on 14 November 2012. |
Water Entities: Results of the 2011–12 Audits This report. |
This report provides the results of the audits of 20 entities and addresses the timeliness of their financial and performance reporting, their financial sustainability, aspects of how they manage risks and an analysis of water tariff revenue. Tabled in Parliament on 14 November 2012. |
Portfolio Departments and Associated Entities: Results of the 2011–12 Audits |
The report will provide the results of the annual financial statement audits of approximately 210 entities. The report will comment on the timeliness of their financial reporting, financial sustainability and reporting developments, and aspects of how the departments manage risks, appropriations and trust funds. Proposed to be tabled in Parliament in November 2012. |
Local Government: Results of the 2011–12 Audits |
The report will provide the results of the audits of approximately 100 entities in the local government sector. The report will address the timeliness of their financial and performance reporting, their financial sustainability, and aspects of how they manage their budget processes and outsourced arrangements. Proposed to be tabled in Parliament in November 2012. |
Tertiary Education and Other Entities: Results of the 2012 Audits |
The report will provide the results of the annual financial audits of approximately 120 entities with a financial year other than 30 June 2012. The report will address the timeliness of their financial and performance reporting, their financial sustainability, a review of their utilisation of internal audit, and credit card security controls and usage. Proposed to be tabled in Parliament in May 2013. |
Source: Victorian Auditor-General’s Office.
Appendix D. Audit status
Metropolitan
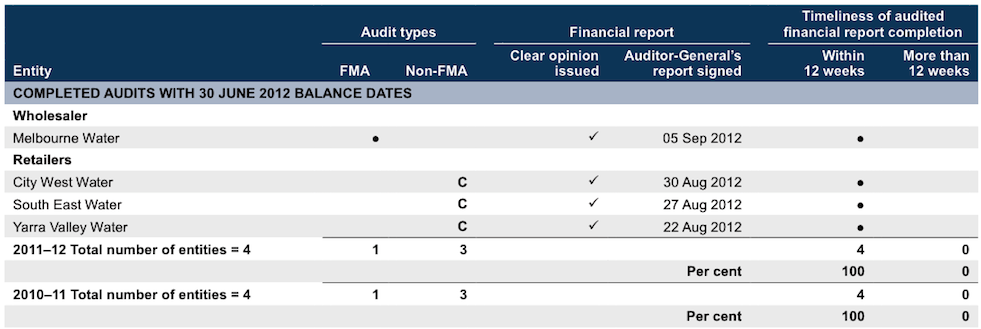
Note: Non-FMA audit types: C – Corporations Act 2001.
The performance report for Melbourne Water was completed on the same date as the financial report. A clear opinion was issued.
Source: Victorian Auditor-General’s Office.
Regional urban
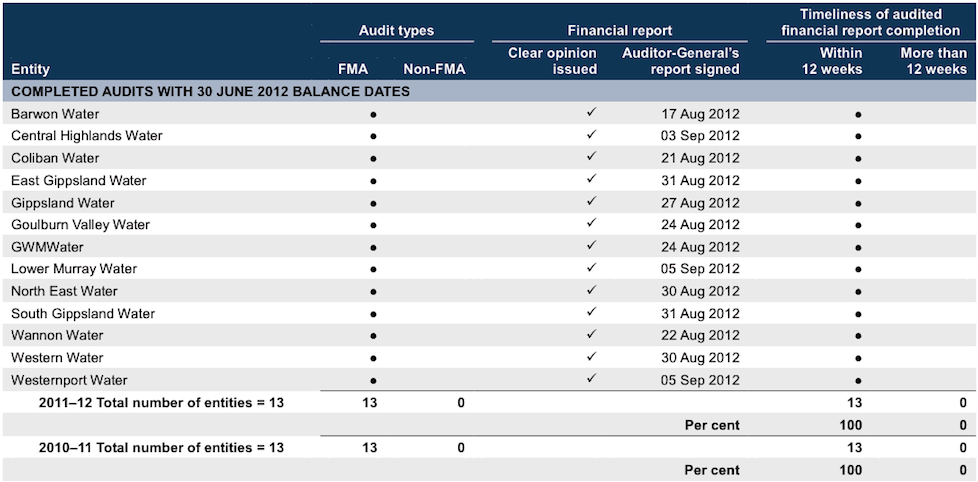
Note: Performance reports were completed on the same date as the financial reports for all entities. Clear opinions were issued.
Source: Victorian Auditor-General’s Office.
Rural
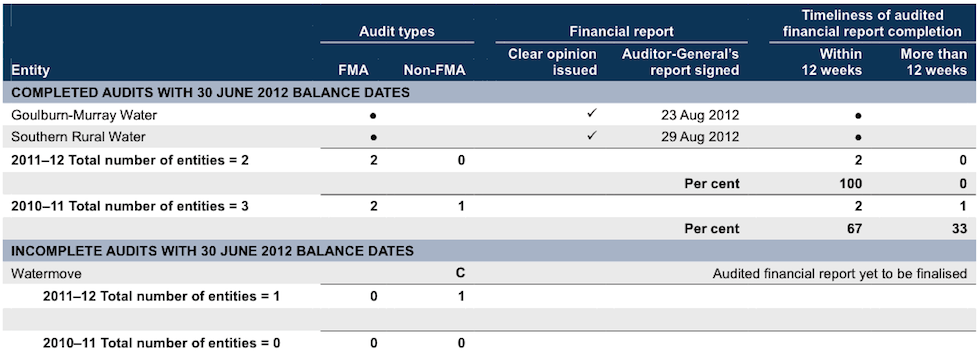
Note:: Non-FMA audit types: C – Corporations Act 2001.
Watermove is a controlled subsidiary of Goulburn-Murray Water. Performance reports were completed on the same date as the financial reports for all entities that were required to prepare a performance report. Clear opinions were issued.
Source: Victorian Auditor-General’s Office.
Other audit services
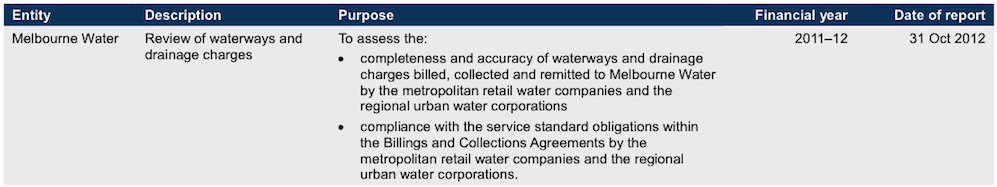
Source: Victorian Auditor-General’s Office.
Appendix E. Financial composition
This Appendix presents the composition of revenue, expenses, assets and liabilities at an industry, metropolitan, regional urban and rural level.
Industry level
Figure E1
Revenue composition
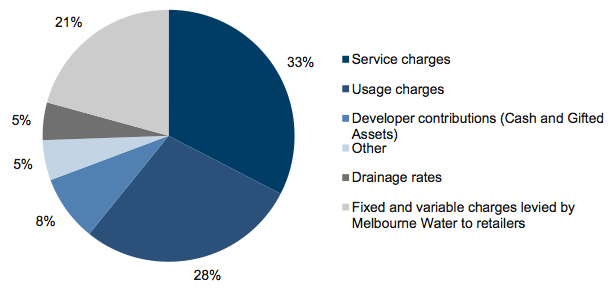
Source: Victorian Auditor-General’s Office.
Figure E2 Expense composition
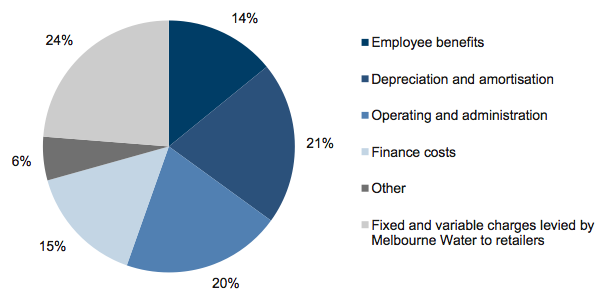
Source: Victorian Auditor-General’s Office.
Figure E3
Asset composition
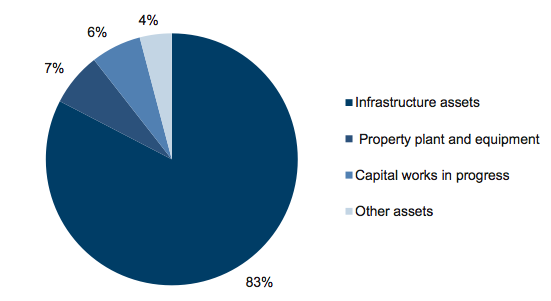
Source: Victorian Auditor-General’s Office.
Figure E4
Liability composition
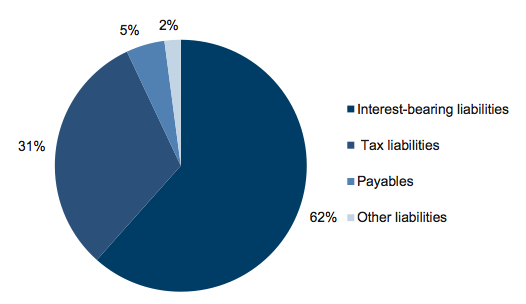
Source: Victorian Auditor-General’s Office.
Metropolitan wholesaler
Figure E5
Revenue composition
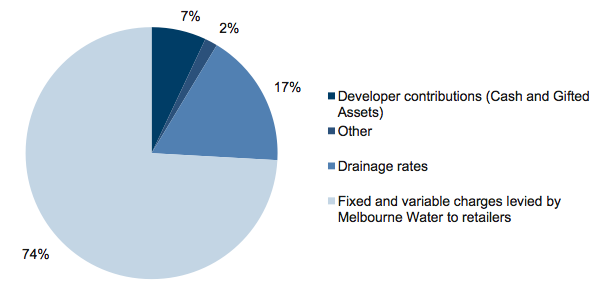
Source: Victorian Auditor-General’s Office.
Figure E6
Expense composition
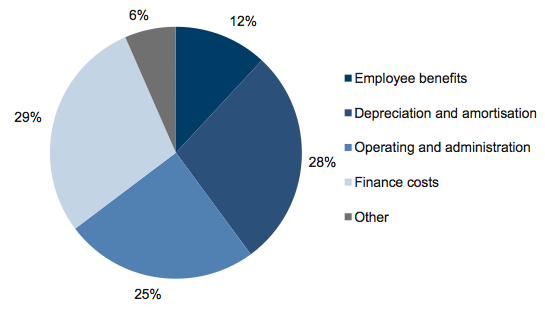
Source: Victorian Auditor-General’s Office.
Figure E7
Asset composition
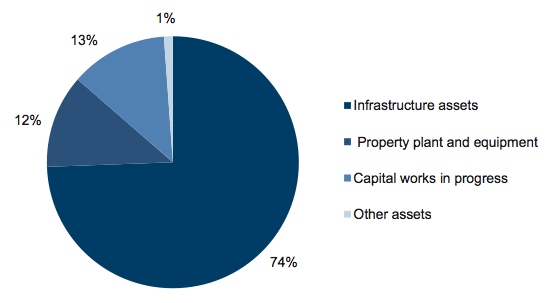
Source: Victorian Auditor-General’s Office.
Figure E8
Liability composition
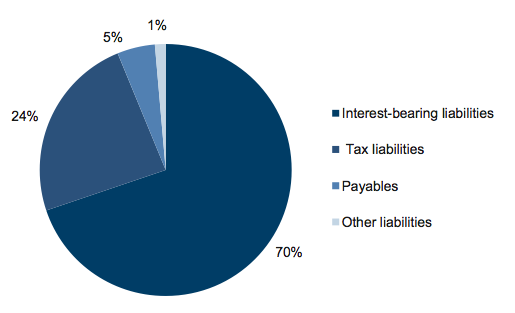
Source: Victorian Auditor-General’s Office.
Metropolitan retailers
Figure E9
Revenue composition
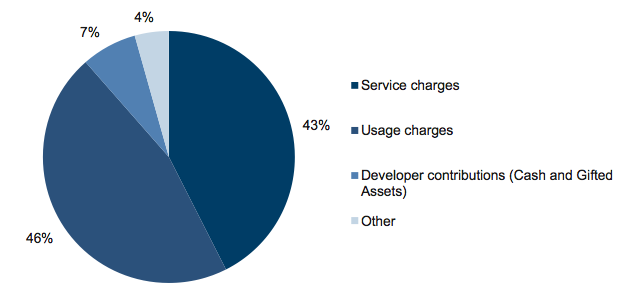
Source: Victorian Auditor-General’s Office.
Figure E10
Expense composition
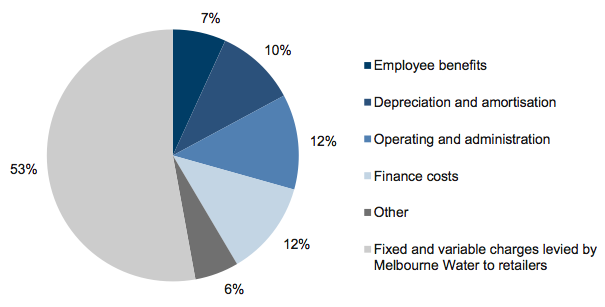
Source: Victorian Auditor-General’s Office.
Figure E11
Asset composition
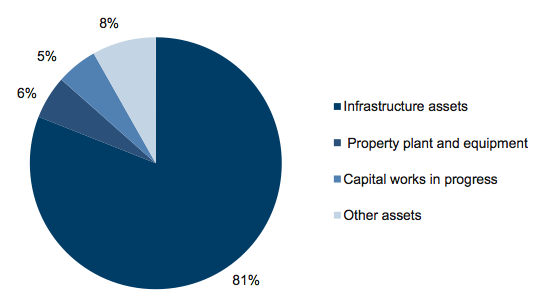
Source: Victorian Auditor-General’s Office.
Figure E12
Liability composition
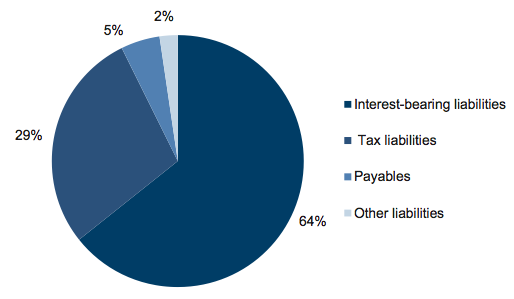
Source: Victorian Auditor-General’s Office.
Regional urban
Figure E13
Revenue composition
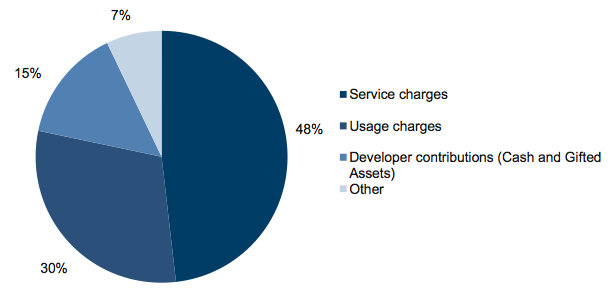
Source: Victorian Auditor-General’s Office.
Figure E14
Expense composition
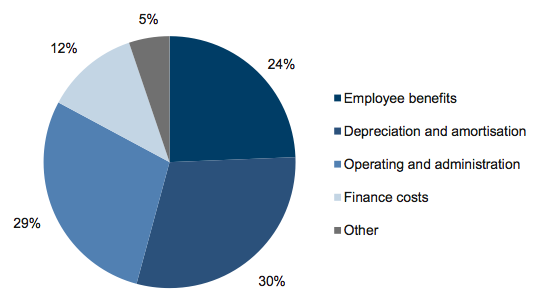
Source: Victorian Auditor-General’s Office.
Figure E15
Asset composition
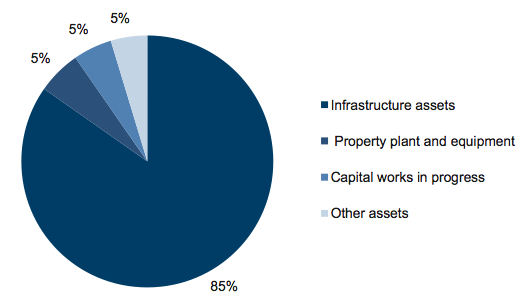
Source: Victorian Auditor-General’s Office.
Figure E16
Liability composition
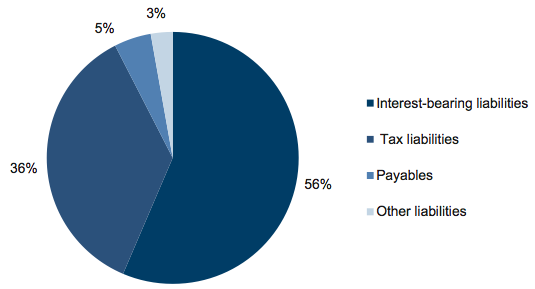
Source: Victorian Auditor-General’s Office.
Rural
Figure E17
Revenue composition
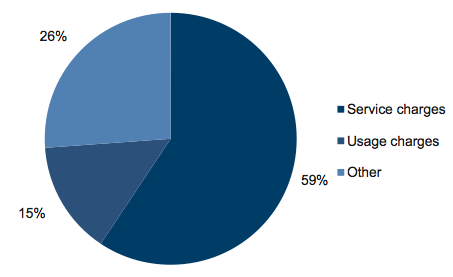
Source: Victorian Auditor-General’s Office.
Figure E18
Expense composition
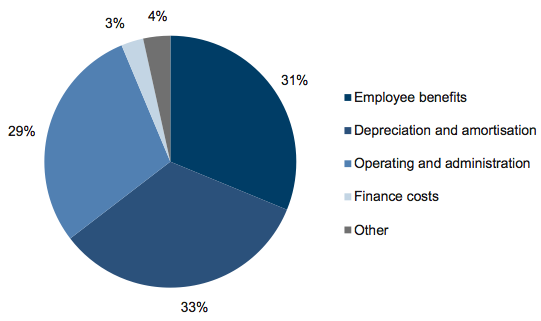
Source: Victorian Auditor General's Office.
Figure E19
Asset composition
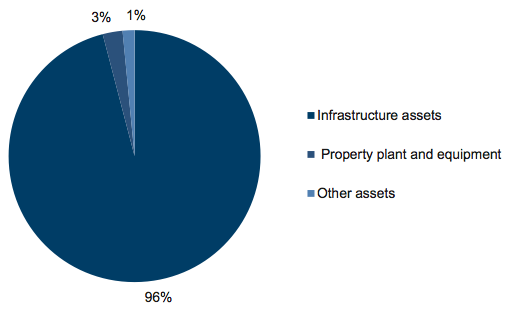
Source: Victorian Auditor-General’s Office.
Figure E20
Liability composition
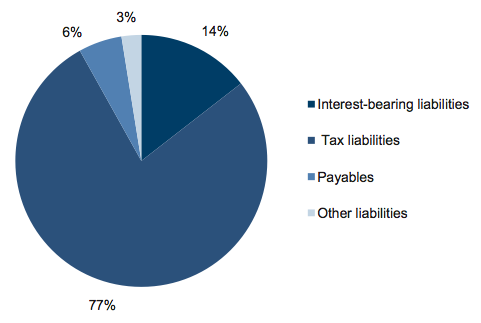
Source: Victorian Auditor-General’s Office.
Appendix F. Entity level financial sustainability
Indicators of financial sustainability
This Appendix sets out the financial indicators used in this report. The indicators should be considered collectively, and are more useful when assessed over time as part of a trend analysis. The indicators have been applied to the published financial information of the 19 water entities for the five-year period 2007–08 to 2011–12.
The analysis of financial sustainability in this report reflects on the position of each entity individually, and of each water sector as a category. The financial sustainability indicators used in this report are indicative of the financial sustainability of the water entities.
The financial sustainability indicators are outlined in Figure F1.
Figure F1
Financial sustainability indicators
|
Indicator |
Formula |
Description |
|---|---|---|
|
Underlying result (%) |
Adjusted net surplus / Total underlying revenue |
A positive result indicates a surplus, and the larger the percentage, the stronger the result. A negative result indicates a deficit. Operating deficits cannot be sustained in the long term. Underlying revenue does not take into account one‑off or non-recurring transactions. Net result and total underlying revenue is obtained from the comprehensive operating statement. |
|
Liquidity |
Current assets / Current liabilities |
This measures an entity’s ability to pay existing liabilities in the next 12 months. A ratio of one or more means there are more cash and liquid assets than short-term liabilities. Current liabilities exclude long-term employee provisions and revenue in advance. |
|
Interest cover |
Net operating cash flows before net interest and tax payments / Net interest payments |
This measures an entity’s ability to meet ongoing interest payments and ability to service debt. Net operating cash flows and net interest and tax payments are obtained from the cash flow statement. |
|
Debt service cover |
Profit less interest, depreciation and amortisation / Total interest and debt repayments |
This measures the ability of an entity to repay its debt from operating profits. Profit, interest, depreciation and amortisation are taken from the comprehensive operating statement. Total interest and debt repayments are taken from the cash flow statement. |
|
Debt-to-assets |
Debt / Total assets |
This is a longer-term measure that compares all current and non-current interest bearing liabilities to total assets. It complements the liquidity ratio which is a short‑term measure. A low ratio indicates less reliance on debt to finance the assets of an organisation. |
|
Self-financing (%) |
Net operating cash flows / Underlying revenue |
This measures an entity’s ability to replace assets using cash generated by the entity’s operations. The higher the percentage the more effectively this can be done. Net operating cash flows are obtained from the cash flow statement. |
|
Capital replacement |
Cash outflows for property, plant and equipment / Depreciation |
Comparison of the rate of spending on infrastructure with its depreciation. Ratios higher than 1:1 indicate that spending is faster than the depreciating rate. This is a long-term indicator, as capital expenditure can be deferred in the short term if there are insufficient funds available from operations, and borrowing is not an option. Cash outflows for infrastructure are taken from the cash flow statement. Depreciation is taken from the comprehensive operating statement. |
Source: Victorian Auditor-General’s Office.
Financial sustainability risk assessment criteria
The financial sustainability of each water entity has been assessed using the risk criteria outlined in Figure F2.
Figure F2
Financial sustainability indicators – risk assessment criteria
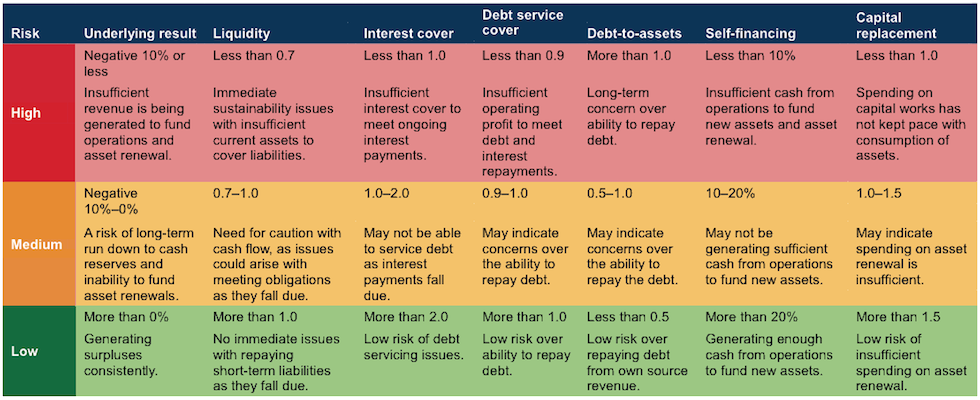
Source: Victorian Auditor-General’s Office.
A trend has been determined for each ratio by entity and the sector.
Figure F3
Overall financial sustainability risk assessment
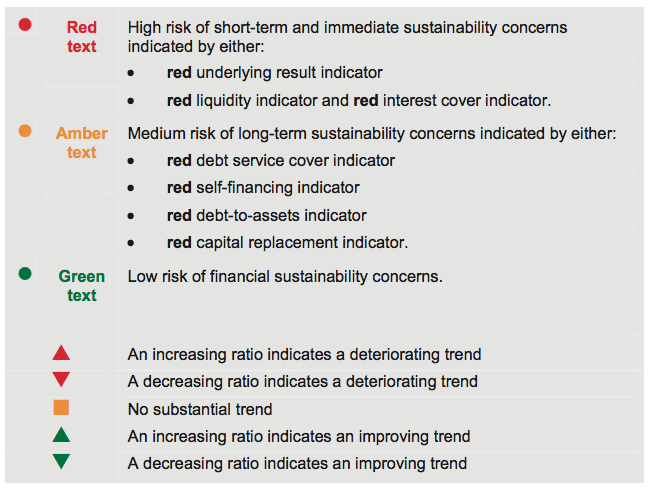
Metropolitan
Wholesaler
Figure F4
Melbourne Water
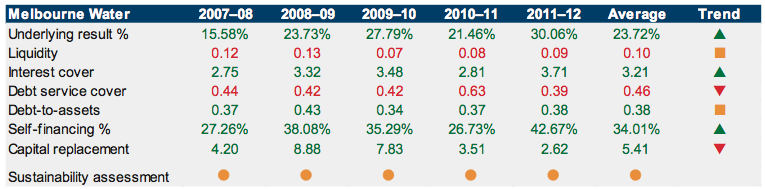
Source: Victorian Auditor-General’s Office.
Retailers
Figure F5
City West Water
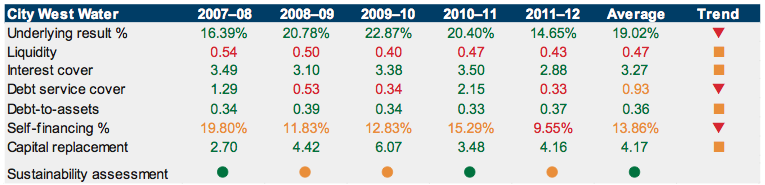
Source: Victorian Auditor-General’s Office.
Figure F6
South East Water
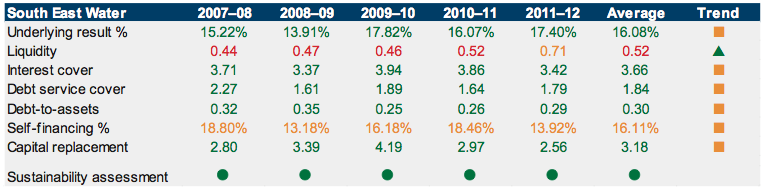
Source: Victorian Auditor-General’s Office.
Figure F7
Yarra Valley Water
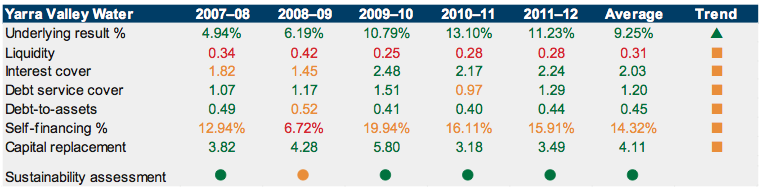
Source: Victorian Auditor-General’s Office.
Figure F8
Metropolitan Average
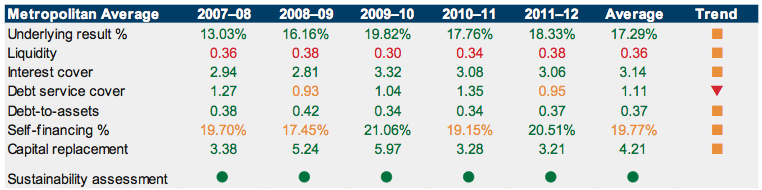
Source: Victorian Auditor-General’s Office.
Regional urban
Figure F9
Barwon Water
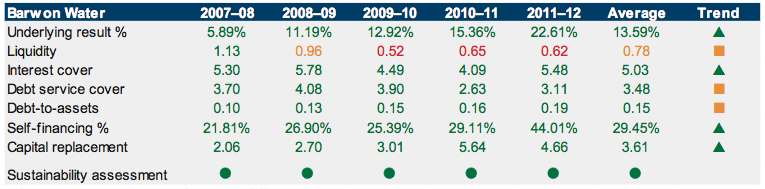
Source: Victorian Auditor-General’s Office.
Figure F10
Central Highlands Water
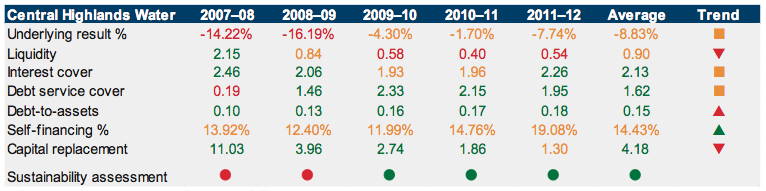
Source: Victorian Auditor-General’s Office.
Figure F11
Coliban Water
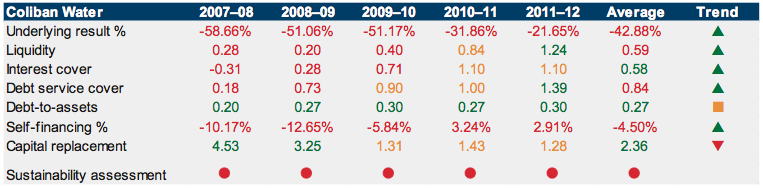
Source: Victorian Auditor-General’s Office.
Figure F12
East Gippsland Water
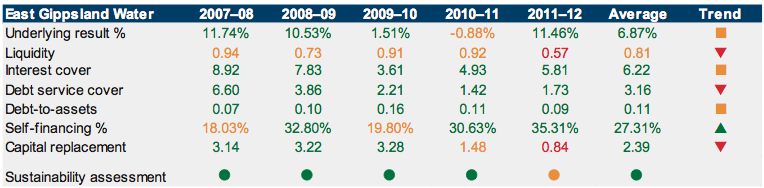
Source: Victorian Auditor-General’s Office.
Figure F13
Gippsland Water
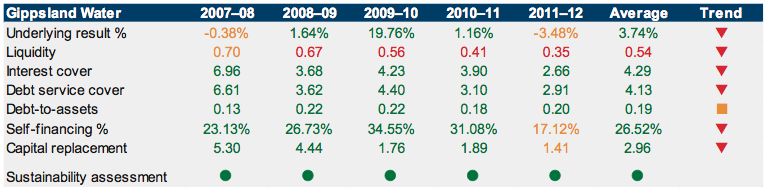
Source: Victorian Auditor-General’s Office.
Figure F14
Goulburn Valley Water
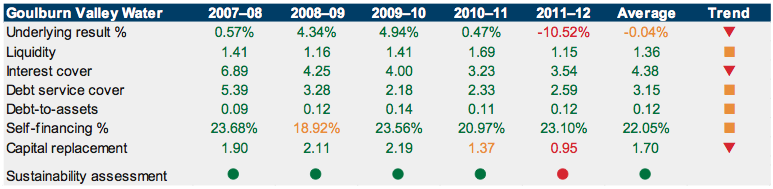
Source: Victorian Auditor-General’s Office.
Figure F15
GWMWater
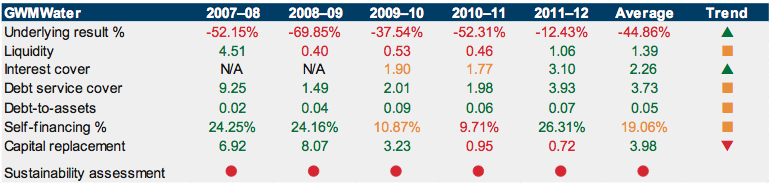
Note: N/A – interest received exceeds interest paid.
Source: Victorian Auditor-General’s Office.
Figure F16
Lower Murray Water
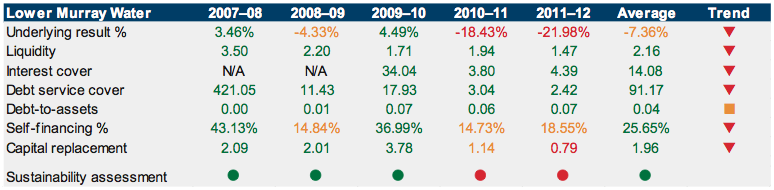
Note: N/A – interest received exceeds interest paid.
Source: Victorian Auditor-General’s Office.
Figure F17
North East Water
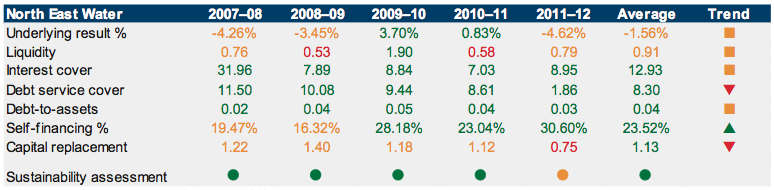
Source: Victorian Auditor-General’s Office.
Figure F18
South Gippsland Water
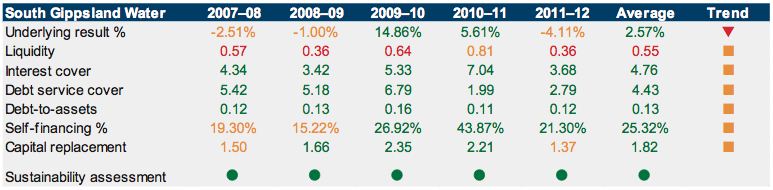
Source: Victorian Auditor-General’s Office.
Figure F19
Wannon Water
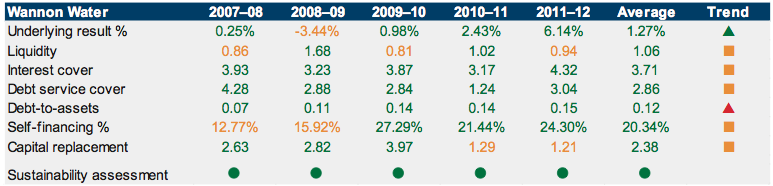
Source: Victorian Auditor-General’s Office.
Figure F20
Western Water
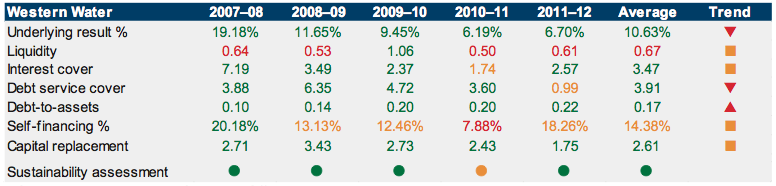
Source: Victorian Auditor-General’s Office.
Figure F21
Westernport Water
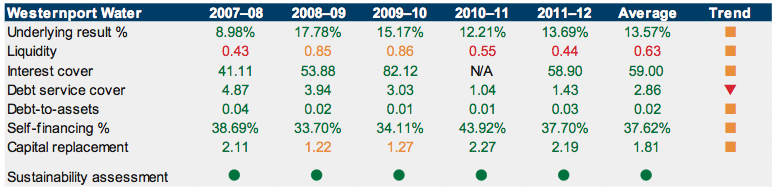
Note: N/A – interest received exceeds interest paid.
Source: Victorian Auditor-General’s Office.
Figure F22
Regional Urban Average
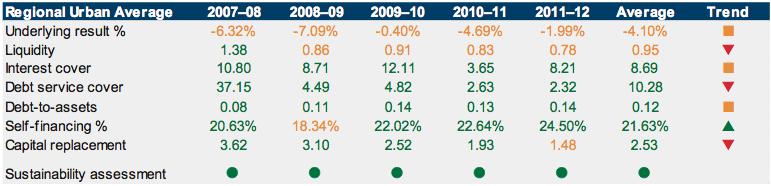
Source: Victorian Auditor-General’s Office.
Rural
Figure F23
Goulburn-Murray Water
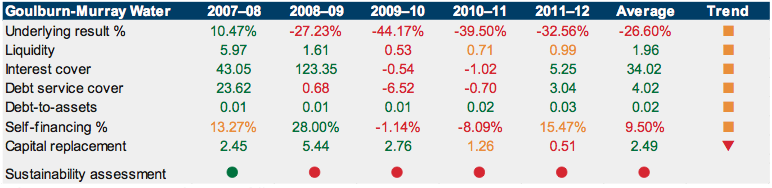
Source: Victorian Auditor-General’s Office.
Figure F24
Southern Rural Water
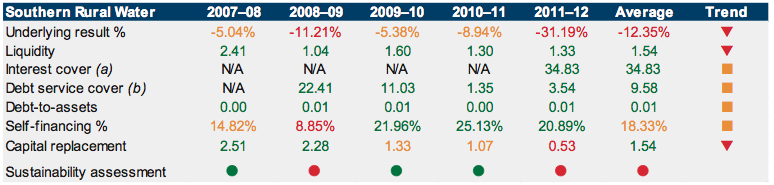
(a) N/A – interest received exceeds interest paid.
(b) N/A – No debt repayments.
Source: Victorian Auditor-General’s Office.
Figure F25
Rural Average
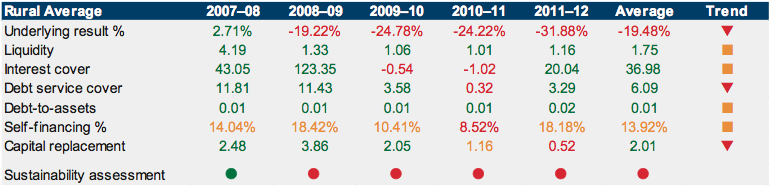
Source: Victorian Auditor-General’s Office.
Appendix G. Performance indicators
This Appendix sets out the performance indicators against which water entities are required to report.
Financial Reporting Direction 27B Presentation and Reporting of Performance Information specifies the entities required to prepare and submit for audit a performance report. Ministerial directives issued under section 51 of the Financial Management Act 1994 specify the performance indicators that need to be reported in a performance report.
Financial indicators
Indicator |
Metropolitan wholesaler |
Metropolitan retailer |
Regional urban |
Rural |
|---|---|---|---|---|
Gearing ratio |
Yes |
Yes |
Yes |
Yes |
Interest cover (cash) |
Yes |
Yes |
Yes |
Yes |
Interest cover (earnings before income tax) |
Yes |
Yes |
Yes |
Yes |
Internal financing ratio |
Yes |
Yes |
Yes |
Yes |
Return on assets |
Yes |
Yes |
||
Return on equity |
Yes |
Yes |
||
Total |
6 |
6 |
4 |
4 |
Note: 'Yes' Performance indicator included in the performance report.
Source: Victorian Auditor-General’s Office.
Non-financial indicators
Indicator |
Metropolitan wholesaler |
Metropolitan retailer |
Regional urban |
Rural |
|---|---|---|---|---|
Services |
||||
Containment of sewer spillages |
Yes |
Yes |
||
Customer complaints—Billing |
Yes |
Yes |
||
Customer complaints—Sewage odour |
Yes |
Yes |
||
Customer complaints—Sewerage service quality and reliability |
Yes |
Yes |
||
Customer complaints—Water quality |
Yes |
Yes |
||
Interruption time indicators |
Yes |
Yes |
||
Reliability of sewerage collection services |
Yes |
Yes |
Yes |
|
Restoration of water supply |
Yes |
Yes |
||
Water quality—Compliance with BWSA: Aesthetics—Turbidity |
Yes |
|
||
Water quality—Compliance with BWSA: Microbiological standards—E.coli |
Yes |
|
||
Water supply interruptions |
|
Yes |
Yes |
|
Total services |
3 |
9 |
9 |
0 |
Environmental |
||||
Recycled water |
Yes |
|||
Reuse indicators—Effluent reuse |
Yes |
Yes |
||
Reuse indicators—Biosolids reuse |
Yes |
Yes |
||
River health—Achievement of Water Plan river health targets |
Yes |
|||
River health—Reduction in currently known intolerable flood risks |
Yes |
|||
Sewage treatment standards |
Yes |
Yes |
||
Sewerage treatment and disposal—ETP—Compliance with EPA discharge requirements—Offensive odours beyond boundary |
Yes |
|||
Sewerage treatment and disposal—WTP—Compliance with EPA discharge requirements—Offensive odours beyond boundary |
Yes |
|||
Sewerage treatment and disposal—WTP—Compliance with EPA discharge requirements—Raw sewage TDS |
Yes |
|||
Sewerage treatment and disposal—ETP—Compliance with EPA discharge requirements—Ammonia limit |
Yes |
|||
Total environmental |
7 |
3 |
3 |
0 |
Note: Yes Performance indicator included in the performance report.
BWSA—Bulk Water Supply Agreement.
ETP—Eastern Treatment Plant.
EPA—Environment Protection Authority.
WTP—Western Treatment Plant.
TDS—Total dissolved solids.
Source: Victorian Auditor-General’s Office.
Appendix H. Audit Act 1994 section 16–submissions and comments
In accordance with section 16(3) of the Audit Act 1994 a copy of this report, or relevant extracts from the report, was provided to the Department of Treasury and Finance, the Department of Sustainability and Environment, the Essential Services Commission, VicWater and the 20 entities with a request for submissions or comments.
The submission and comments provided are not subject to audit nor the evidentiary standards required to reach an audit conclusion. Responsibility for the accuracy, fairness and balance of those comments rests solely with the agency head.