Water Entities: 2014–15 Audit Snapshot
Overview
For the financial year ended 30 June 2015, 15 water entities received clear audit opinions for both their financial and performance reports. The four metropolitan water entities received modified audit opinions for their financial reports, due to errors with the valuation of their infrastructure assets. These errors led to a combined overstatement to the value of infrastructure assets of $1.3 billion at 30 June 2015. Modified opinions were also issued on the performance reports for these entities as the errors also impacted the calculation of three financial performance indicators.
Our review of the financial sustainability risks of the water sector shows that, despite an increase in the sector’s net profit before income tax as compared to the prior year, there are short-term liquidity risks for the metropolitan and regional urban water entities given the amount of short-term debt held at 30 June 2015. There are also longer-term financial sustainability risks associated with the water sector's ability to replace and renew assets, and to repay debt.
The water entities continue to have a significant dependency on debt to finance capital projects, and other obligations, as they don’t generate sufficient revenue from operations to be able to fund this investment.
Over the past five years the Victorian water sector has increased their level of debt by 29 per cent. At 30 June 2015, the water sector had borrowings of $10.4 billion. This also represents a quarter of all borrowings held by the state at this date.
Further, over the past five years, over 70 per cent matured loans (equating to $2.7 billion) have not been repaid by the sector––they have been rolled over. Eight entities across the sector did not repay any debt over this period, and only three water entities have a formal debt management plan or strategy. Longer-term financial risks exist for the sector if this situation continues.
Water Entities: 2014–15 Audit Snapshot: Message
Ordered to be published
VICTORIAN GOVERNMENT PRINTER December 2015
PP No 109, Session 2014-15
President
Legislative Council
Parliament House
Melbourne
Speaker
Legislative Assembly
Parliament House
Melbourne
Dear Presiding Officers
Under the provisions of section 16AB of the Audit Act 1994, I transmit my report on Water Entities: 2014–15 Audit Snapshot.
This report comments on the outcomes of the financial audits of the 19 water entities for the year ended 30 June 2015. It informs Parliament about significant issues arising from the audits of both the financial and performance reports.
Qualified audit opinions were issued on the four metropolitan water entities' financial reports for 2014–15, as they contained errors in the fair valuation of infrastructure assets. These errors triggered consequential impacts to the performance reports of these entities, therefore qualified audit opinions were also issued on their performance reports.
The report also highlights the sector's financial outcomes, risks to financial sustainability and trends in debt across the sector for the past five years.
Yours faithfully

Dr Peter Frost
Acting Auditor-General
10 December 2015
Auditor-General's comments
|
Dr Peter Frost Acting Auditor-General |
Audit team Roberta Skliros—Engagement Leader Jan-Michael Perez—Team Leader Jie Yang—Team member Richard Ly—Team member Engagement Quality Control Reviewer Travis Derricott |
The Parliament and community can have confidence in the 2014–15 financial and performance reports of 15 of the 19 water entities.
I issued qualified audit opinions on the four metropolitan water entities' financial reports for 2014–15, as they contained errors in how the entities struck the fair value of their infrastructure assets. These errors led to a combined overstatement to the value of infrastructure assets of $1.3 billion at 30 June 2015. These errors also impacted the accuracy of three of the financial performance indicators reported in the metropolitan water entities' performance reports, therefore, I also issued qualified audit opinions on those reports.
The sector generated a combined net profit before income tax of $430.6 million for the year ended 30 June 2015, an increase of $109.7 million from 2013–14. Fifteen water entities reported an improvement in their net result (including a reduction in deficits), with only four delivering a loss before income tax, compared to six last year. Despite the improvement in short-term results for the majority of the sector, when analysing risks to financial sustainability there is liquidity risk for the metropolitan and regional urban water entities given the quantum of short-term debt held, and there are also longer-term risks associated with the water sector's ability to replace or renew assets and to repay debt.
The level of borrowings in the water sector increased by 29 per cent, from $8 billion in 2010–11 to $10.4 billion in 2014–15, representing a quarter of the state's borrowings. The metropolitan cohort holds 80 per cent of the total debt portfolio. The growth in borrowings has funded the delivery of major capital projects and has been held to meet certain other payments, such as dividends. Borrowings are also expected to increase by a further 19 per cent in the period to 2018–19, based on forecasts from the entities' 2014–15 corporate plans.
There continues to be significant dependency on debt to finance capital projects, as water entities do not generate sufficient revenue from operations to be able to fund this investment. Further, over the past five years, of the $3.7 billion of loans maturing, $2.7 billion, or greater than 70 per cent, of these loans have not been repaid—they have been rolled over. Eight entities across the sector did not repay any debt over the five-year period. Longer-term financial risks exist for the sector if the sole source of funding capital projects continues to be predominantly from debt and the debt continues to be rolled over and not repaid at similar rates. Lastly, only three water entities had formal debt management plans or strategies.
Dr Peter Frost
Acting Auditor-General
December 2015
Audit Summary
This report details the outcomes of the 2014–15 financial audits of Victoria's 19 water entities.
The report identifies and discusses the key issues within the water sector that arose during our audits, and provides an analysis of information included in water entity financial reports and performance reports. It is one of a suite of Parliamentary reports on the results of the 2014–15 financial audits conducted by VAGO.
Conclusions
Fifteen water entities received clear audit opinions on their financial reports for the financial year ended 30 June 2015, and four entities received qualified audit opinions. The Parliament and the community can have confidence in those reports with clear opinions.
Qualified opinions were issued to the four metropolitan water entities as they had an error in the fair valuation of infrastructure assets, leading to a combined overstatement of the value of infrastructure assets and the corresponding infrastructure asset revaluation reserve of $1.3 billion at 30 June 2015 ($417.0 million at 30 June 2014).
All four metropolitan water entities had inappropriately accounted for deferred tax benefits in their fair value calculation. In addition, Melbourne Water had also inappropriately accounted for developer contributions in their fair value calculation. These errors constitute a departure from Australian Accounting Standard AASB 13 Fair Value Measurement and triggered consequential impacts to the performance reports of these entities Therefore, qualified audit opinions were also issued on their performance reports.
The overall financial performance of the water sector has shown an improvement for the 2014–15 reporting period.
Despite the improvement in short-term results for the majority of the sector, when analysing risks to financial sustainability there are liquidity risks for the metropolitan and regional urban water entities given the quantum of short-term debt held, and there are also longer-term risks associated with the sector's ability to replace or renew assets and to repay debt.
The level of borrowings in the water sector increased by 29 per cent, from $8 billion in 2010–11 to $10.4 billion in 2014–15. Over the past five years, of the $3.7 billion of loans maturing, $2.7 billion, or greater than 70 per cent, of these loans have not been repaid—they have been rolled over. Further, only three water entities had separately identifiable debt management strategies.
Findings
Financial outcomes
The overall financial performance of the water sector has shown an improvement for the 2014–15 reporting period, on an already positive result recorded last year.
The sector generated a combined net profit before income tax of $430.6 million for the year ended 30 June 2015, an increase of $109.7 million from the prior year. Fifteen water entities reported a growth in their net result—including a reduction in their net deficits—with only four delivering a loss before income tax, compared to six in 2013–14.
In 2014–15, dividends paid by the four metropolitan water entities totalled $120.8 million, an increase of $82.4 million on 2013–14.
Despite the improvement in short-term results for the majority of the sector, when analysing risks to financial sustainability, there are liquidity risks for the metropolitan and regional urban water entities given the quantum of short-term debt held, and there are also longer-term risks associated with the sector's ability to replace or renew assets and to repay debt.
General internal controls
At the commencement of the 2014–15 reporting period, 54 high- and medium-risk issues raised by VAGO since the 2011–12 reporting period remained unresolved. At the end of the reporting period, two high-risk and 16 medium-risk issues raised in prior years remain unresolved.
Our Water Entities: Results of the 2013–14 Audits report, tabled in Parliament in February 2015, analysed the management of gifts, benefits and hospitality across the four metropolitan water entities and the operations of audit committees across all 19 water entities. Nine issues were raised across the water sector. At the end of the 2014–15 reporting period, three issues relating to gifts, benefits and hospitality and two issues relating to audit committees remain unresolved.
Performance reporting
Clear audit opinions were issued on 15 of the 19 performance reports for the 2014–15 reporting period, with four qualified opinions being issued to the metropolitan water entities. This was because three of the financial performance indicators were impacted by the valuation errors included in their financial reports.
Last year's Water Entities: Results of the 2013–14 Audits report highlighted that the performance reporting processes of the water entities were not as mature or developed as those for financial report preparation. This is again apparent for the 2014–15 reporting period.
Water entities need to place a greater focus on the processes employed to prepare performance reports, such as:
- designating responsible officers for the overall preparation of reports
- maintaining a central repository for collation of data used to support the performance report
- implementing a formalised independent quality review process
- preparing quality shell performance reports.
Trends in debt management
At 30 June 2015, the Victorian water sector debt held 25 per cent of the state's overall borrowings. The level of borrowings in the water sector increased by 29 per cent, from $8 billion in 2010–11 to $10.4 billion in 2014–15.
The growth in borrowings has funded the delivery of major capital projects and has been used to meet certain other operating costs. There has been, and continues to be, significant dependency on debt to finance capital projects, as water entities do not generate sufficient revenue from operations to be able to fund this investment. Over the past five years, of the $3.7 billion of loans maturing, $2.7 billion of these loans or greater than 70 percent have not been repaid—they have been rolled over. Eight entities across the sector did not repay any debt over the past five years.
Based on the water entities' 2014–15 corporate plans, borrowings are expected to increase by a further 19 per cent in the period to 2018–19. This is largely driven by the metropolitan water cohort. The increase in debt has been forecast to fund capital expenditure programs and to meet other obligations, such as dividend and tax payments.
Funding capital projects from borrowings is an appropriate mechanism, particularly when the funds are used to construct larger-scale assets with extended useful lives, as costs associated with the assets are spread across future generations. However, longer-term financial risks exist for the sector, if the sole source of funding capital obligations continues to be predominantly from debt and the debt continues to be rolled over at similar rates.
We identified that only three water entities had formal debt management plans or strategies. For the remainder of the sector, some elements of a debt management plan were captured within other corporate documents such as corporate plans and treasury policies.
There is no mandatory requirement for a water entity to have a separate debt management plan, however, given the financial impact and longer-term risk debt has on water entities, we recommend that water entities have in place a dedicated plan or strategy, that maps out their approach to debt management and usage over the medium and longer term.
Recommendations
-
That water entities: address issues raised in audit management letters on a timely basis so that any weaknesses in their control environment are rectified promptly.
-
That metropolitan water entities: change their current valuation model used to estimate the fair value of infrastructure assets to correct the errors identified by audit in the qualification.
-
That water entities: enhance their performance reporting processes to:
- designate a responsible officer for the overall preparation and production of the performance report
- maintain a central repository for collation of data used to support the performance report
- implement a formalised, independent quality review process over the preparation processes and presentation of the performance report
- prepare quality shell performance reports
- critically assess the requirements of Ministerial Reporting Direction (MRD) 01 Performance Reporting, including providing adequate training or guidance to staff preparing the performance reports.
-
That the Department of Environment, Land, Water & Planning: conducts a more robust review of water entities' draft corporate plans to detect any disparities with MRD 01 and undertakes a comprehensive review of MRD 01 non-financial KPIs for consistency.
-
That water entities: establish a dedicated debt management strategy or plan that maps out their approach to debt management and usage over the medium and longer term.
Submissions and comments received
We have professionally engaged with all 19 water entities, the Department of Environment, Land, Water & Planning, the Department of Treasury & Finance, the Essential Services Commission and the Treasury Corporation of Victoria throughout the preparation of this report. In accordance with section 16(3) of the Audit Act 1994 we provided a copy of this report, or relevant extracts, to named agencies and requested their submissions or comments.
We have considered those views in reaching our audit conclusions and have represented them to the extent relevant and warranted. Their full section 16(3) submissions and comments are included in Appendix F.
1 Context
1.1 Introduction
This report details the outcomes of the 2014–15 financial audits of Victoria's 19 water entities. In addition, there are two controlled entities, where one no longer actively trades, and the other is captured in the consolidated results of the parent entity. As a result, no further comments are made on the results of these audits throughout this report.
The report identifies and discusses the key issues within the water sector that arose during our audit conduct, and provides an analysis of information included in water entity financial reports and performance reports. It is one of a suite of Parliamentary reports on the results of the 2014–15 financial audits conducted by VAGO.
Figure 1A outlines the structure of this report.
Figure 1A
Report structure
|
Part |
Description |
|---|---|
|
Part 1 Context |
Provides an overview of the Victorian water sector, results of the financial and performance report audits and discusses key emerging matters for the sector. It also discusses the internal control and financial reporting issues identified during the 2014–15 financial audits, and provides an update on prior year issues raised. |
|
Part 2 Financial outcomes |
Comments on the financial outcomes of the 19 water entities for the 2014–15 financial year, including a discussion of some key financial issues impacting the 2014–15 financial reports. Provides insight into the financial sustainability risks of the water sector based on the trends of financial sustainability indicators over a five-year period. |
|
Part 3 Performance reporting |
Comments on performance reporting in the water sector. |
|
Part 4 Trends in debt management |
Comments on the trend in borrowings, repayments and costs of servicing debt across the water sector over the past five years. It also comments on the extent of debt refinancing (or rollover) and explores the risks to financial sustainability in light of current debt management practices. |
Source: Victorian Auditor-General's Office.
Pursuant to section 20(3) of the Audit Act 1994, unless otherwise indicated any persons named in this report are not the subject of adverse comment or opinion.
The total cost of this report was $212 000.
1.2 Victorian water sector
1.2.1 Snapshot of the sector
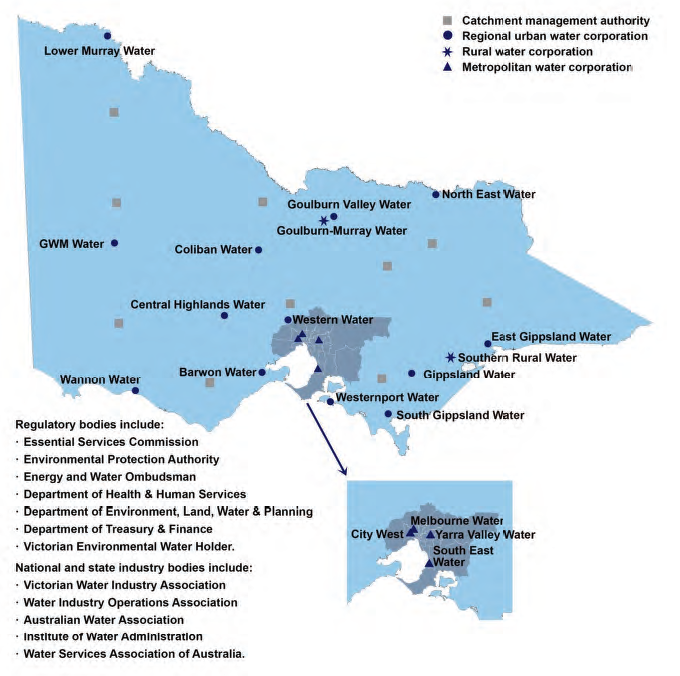
Figure 1B outlines the Victorian water sector:
Figure 1B
Victorian Water Sector
Source: Victorian Auditor-General's Office.
The Victorian water sector includes 21 public sector entities, comprising 19 water entities and two controlled entities. Appendix A of this report includes a list of all 21 entities. This report solely focuses on the results of audits relating to the 19 water entities.
The entities are stand-alone businesses responsible for their own management and performance and provide a range of water services, including the supply of water and/or sewerage services to customers across the state. Several of them also manage bulk water storages and specific recreational areas throughout Victoria.
The 19 water entities are split into three operating areas—metropolitan, regional urban and rural—with each entity providing services within its designated area. Each water entity is governed by a constituted board that has a range of responsibilities, including:
- steering the entity
- setting objectives and performance targets
- ensuring compliance with legislation and government policy.
The board of each water entity reports to the Minister for Environment, Climate Change and Water via the Department of Environment, Land, Water & Planning (DELWP). In turn, the minister is responsible for reporting to Parliament on the performance of each water business.
The Water Act 1989 is the central legislation for the Victorian water industry. Its objectives include:
- promoting the orderly, equitable and efficient use of water resources
- ensuring that water resources are conserved and properly managed for sustainable use for the benefit of all Victorians
- maximising community involvement in the making and implementation of arrangements relating to the use, conservation or management of water resources.
In addition to these water entities, there are 10 catchment management authorities (CMA), established under the Catchment and Land Protection Act 1994 (Vic). The CMAs are responsible for coordinated catchment management in their region and are provided with regional waterway, floodplain, drainage and environmental water reserve management powers under the Water Act 1989. The results of the audits for the CMAs are not captured by this report, they are included in our Portfolio Departments and Associated Entities: 2014–15 Audit Snapshot.
The water sector is also regulated by a number of key agencies, as shown in Figure 1B, who are responsible for setting economic, environmental and social obligations upon water entities, such as the Essential Services Commission (ESC) and DELWP.
Figure 1B also highlights some key industry bodies, such as the Victorian Water Industry Association (VicWater), which plays an important role by seeking to influence government policy, providing forums for industry discussions on priority issues, and disseminating news and information to key industry stakeholders.
1.2.2 Regulatory pricing model for the sector
Since 1 January 2004, the ESC has been responsible for regulating and approving the maximum prices each water entity may charge its customers for the supply of water and the provision of sewerage services. The ESC sets prices in accordance with the requirements of the Essential Services Commission Act 2001 (the Act), the Water Industry Act 1994, and the Water Industry Regulatory Order. The ESC has approved prices for metropolitan and regional urban businesses since 1 July 2005 and for rural businesses since 1 July 2006.
Its role includes the regulation of prices and monitoring of service standards, and market conduct.
The Act states that the ESC's objective is to promote the long-term interests of Victorian consumers with regard to the price, quality and reliability of essential services.
In order to achieve this, the ESC needs to take into consideration:
- efficiency in regulated entities and incentives for long-term investment
- the financial viability of regulated entities
- existing and potential competition within the sector
- the relevant health, safety, environmental and social legislation
- the benefits and costs of regulation for consumers—including low income or vulnerable consumers—and regulated entities
- consistency in regulation between state jurisdictions and on a national basis.
Taking this into consideration, the ESC has conducted a price review every three to five years since 2004. As part of this review, water entities are required to provide the ESC with a water plan. The ESC then determines the maximum prices for each water entity's prescribed goods and services.
Water Plan 3, 2013–14 onwards
In October 2012, the 19 water entities submitted water plans that covered the period 1 July 2013 to 30 June 2018 to the ESC for assessment.
Each entity was required to set out in its plan:
- expected costs of delivering water and sewerage services
- planned capital works programs
- forecast volumes of water to be delivered
- level of service to customers
- proposed prices that would raise sufficient revenue to recover expected costs.
The ESC assessed the proposed prices and revenue against the regulatory principles set out in the Water Industry Regulatory Order 2012.
The ESC's final price determinations in relation to Water Plan 3 were released in June 2013. They apply for all entities except Goulburn-Murray Water and Melbourne Water from 1 July 2013 to 30 June 2018—or when the ESC makes a new determination. The determinations of Goulburn-Murray Water and Melbourne Water cover a three-year period to 30 June 2016.
Overall, the ESC's final decision reduced the water entities' proposed revenue by:
- $1 billion for metropolitan water entities—this includes revenue estimates for years four and five for Melbourne Water
- $200 million for regional urban water entities
- $13 million for rural water entities.
The ESC assessed that water entities were able to deliver services at a lower cost and thus adjusted the water entities' proposed:
- operating expenditure—for example, labour
- productivity improvements
- capital programs and, therefore, financing costs.
The average price increase for each water cohort over the third regulatory period, excluding the impact of inflation, is shown in Figure 1C.
Figure 1C
Average price increase for water entities from the third regulatory period
|
Water cohort |
Average change (per cent) |
|---|---|
|
Metropolitan retailers |
22.20 |
|
Regional urban |
1.27 |
|
Rural |
0.75 |
Source: Victorian Auditor-General's Office.
1.3 Audits for the year ended 30 June 2015
1.3.1 Financial audit opinions issued
Independent audit opinions add credibility to financial reports by providing reasonable assurance that the information reported is reliable and accurate. A clear audit opinion confirms that the financial report presents fairly the transactions and balances for the reporting period, in accordance with the requirements of relevant accounting standards and applicable legislation. Fifteen clear audit opinions and four qualified audit opinions were issued to the water entities for the financial year ended 30 June 2015.
A qualified audit opinion is issued when the auditor cannot be satisfied that the financial report is free from material misstatement.
The financial audits of the water entities were undertaken in accordance with the Australian Auditing Standards.
Qualified audit opinions
Qualified audit opinions were issued on the four metropolitan water entities' financial reports for the 2014–15 financial reporting period. The qualified opinions were issued as the reports had an error in the fair valuation of infrastructure assets.
All four metropolitan water entities had inappropriately accounted for deferred tax benefits in their fair value calculation. In addition, Melbourne Water had inappropriately accounted for developer contributions in its fair value calculation. These errors are a departure from Australian Accounting Standard (AASB) 13 Fair Value Measurement.
In our view, the error in the fair value models of each metropolitan water entity had the following estimated financial report impact on the carrying value of infrastructure assets and the infrastructure asset revaluation reserve.
Figure 1D
Estimated overstatement/(understatement) of infrastructure assets valuation and infrastructure asset revaluation reserve
|
Entity |
30 June 2015 ($ million) |
30 June 2014 ($ million) |
|---|---|---|
|
City West Water |
161.9 |
155.0 |
|
South East Water |
279.5 |
248.0 |
|
Yarra Valley Water |
391.8 |
334.0 |
|
Melbourne Water |
514.0 |
(320.0) |
|
Total impact |
1 347.2 |
417.0 |
Source: Victorian Auditor-General's Office.
The errors also had a consequential impact on the depreciation expense, income tax expense, current tax payable and net deferred tax liabilities for the year ended 30 June 2015—the effects of these errors were not determined as it was not practicable to do so.
As per the requirements of Financial Reporting Direction (FRD) 103F Non-financial physical assets issued pursuant to the Financial Management Act 1994, the metropolitan water entities' infrastructure assets are required to be reported at fair value, with fair value to be determined in accordance with AASB 13.
AASB 13 was effective for reporting periods beginning on 1 July 2013, and provided a more prescriptive definition of fair value as 'the price that would be received to sell an asset or paid to transfer a liability in an orderly transaction between market participants at the measurement date'. AASB 13 brought about a key change in considering fair value from a 'market participant's perspective', placing an emphasis on the 'current exit price' that a market buyer would be 'willing to pay'.
The four metropolitan water entities determined the fair value of infrastructure assets using an 'income approach'—based on a discounted cash-flow analysis. The water entities utilised the expertise of an external accounting firm (expert valuer) to either calculate the fair valuation of infrastructure assets annually, or to assist with a review of an internal valuation model and to recommend key assumptions.
The models supporting the fair value approach are complex and involve management estimates and assumptions.
The 'income approach' methodology used by the water entities to determine the fair value of infrastructure assets is summarised in Figure 1E.
Figure 1E
Income approach methodology applied to fair value infrastructure assets
|
Step 1. Forecast the cash flows of the water entity for the next eight years—equates to approximately two regulatory periods. Step 2. Forecast terminal (subsequent) cash flows into perpetuity for the period after the end of eight years. Step 3. Calculate the net present value of these cash flows to derive an enterprise value. Step 4. From the enterprise value, deduct net debt and adjust for surplus assets (if any) to strike an equity value. Step 5. Deduct the value of non-infrastructure assets and add the value of non-infrastructure liabilities from the equity value to strike an implied infrastructure value. Step 6. Increase the infrastructure value by a 'deferred tax gross up factor'. That is, the entities added a nominal value of future tax liabilities to the value of the assets. |
Source: Victorian Auditor-General's Office.
The error identified from our audits related to a flaw in the primary methodology in step 6.
For the retail water entities, the error related solely to the 'deferred tax gross up factor' applied to increase the fair value of infrastructure assets. This factor was applied to take into account tax benefits that a potential buyer (market participant) would receive if buying the infrastructure assets. The factor applied was at nominal value.
The application of general present value techniques is a requirement when using an income approach to strike fair value under AASB 13. We concluded that when applying such a factor, any potential buyer would factor in the timing of when the cash flow savings from these tax benefits would arise and discount these benefits to net present value. Consequently, we were of the view that the fair values determined were materially overstated.
For Melbourne Water, we identified that the tax cash outflows within the discounted cash-flow model were based on an accounting rather than tax-based depreciation, which in turn were based on an accounting written down value (fair value) of the infrastructure assets rather than a tax-based written down value (cost less cumulative tax depreciation) of the infrastructure assets.
Melbourne Water had already included the present value of deferred tax benefits within their cash-flow model in steps 1 and 2, and therefore did not need to apply a 'deferred tax gross up', as this would be duplicating the impact. Consequently, we were of the view that the fair value of infrastructure assets was overstated. We also identified that Melbourne Water inappropriately accounted for developer contributions in the discounted cash-flow model.
The water entities collectively disagreed with our view that there is an 'error' in the methodology and engaged their expert to consider an alternate valuation scenario. This approach took into account the error identified by our audit, however, it also changed several significant assumptions we had not previously commented on. It was not indicative of the impact of matters identified by our audit, therefore it did not change our view. The 2015–16 financial year presents an opportunity for the metropolitan water entities to rectify this issue as it is a revaluation year, as discussed in Part 1.4.
1.3.2 Performance audit opinions issued
Clear audit opinions were issued on 15 of the 19 performance reports, with four qualified audit opinions being issued for the 2014–15 reporting period. A clear audit opinion confirms that the actual results reported on the performance report were fairly presented and complied with legislative requirements. A qualified audit opinion is issued when the auditor cannot be satisfied that the performance report is fairly presented.
We do not form an opinion on the relevance or appropriateness of the reported performance indicators as they are set by Ministerial Direction. The audits were undertaken in accordance with the Australian Auditing Standards.
Qualified audit opinions
The audits of the 2014–15 financial reports of the metropolitan water entities identified errors in the fair value of infrastructure assets. Consequently certain values used to calculate three of the financial performance indicators—gearing ratio, return on assets and return on equity—were impacted, and the actual results for 2013–14 and 2014–15 were reported in error. For further detail on the outcomes of the performance reporting for 2014–15, please refer to Part 3 Performance reporting.
1.3.3 General internal controls and financial reporting
Effective internal controls help entities to reliably and cost-effectively meet their objectives. Strong internal controls are a prerequisite for the delivery of reliable, accurate and timely external and internal financial reports.
In our annual financial audits we focus on the internal controls relating to financial reporting and assess whether entities have managed the risk that their financial reports will not be complete and accurate. Poor internal controls diminish management's ability to comply with relevant legislation, and increase the risk of fraud and error.
The governing body of each water entity is responsible for developing and maintaining internal controls that enable:
- preparation of accurate financial records and other supporting documentation
- timely and reliable external and internal reporting
- appropriate safeguarding of assets
- prevention and detection of errors and other irregularities.
The Standing Directions of the Minister for Finance require management to implement effective internal control structures. In this Section we have included:
- internal control weaknesses or financial reporting issues commonly identified across the 19 water entities in 2014–15
- analysis of the status of prior period control weaknesses or financial reporting issues.
Commonly identified internal control weaknesses or financial reporting issues
In conducting our financial audits, we observed that the financial reporting internal controls at the water entities, to the extent we tested those controls during our audit, were adequate for maintaining the reliability of financial reporting. Nevertheless, we identified a number of instances where important internal controls need to be strengthened or financial reporting matters need to be addressed.
During the 2014–15 reporting period, audit teams identified 108 internal control weaknesses or financial reporting issues, which were reported to management and audit committees. Figure 1F shows the number of issues identified by risk rating for extreme, high and medium risks—it excludes 37 low-risk issues.
The definitions of each risk rating are detailed in Appendix B.
Figure 1F
2014–15 reported issues by topic and risk rating
|
Risk rating of issue |
||||
|---|---|---|---|---|
|
Area of issue |
Extreme |
High |
Medium |
Total |
|
Information technology(a) |
– |
11 |
20 |
31 |
|
Infrastructure assets, property, plant and equipment(b) |
4 |
– |
11 |
15 |
|
Revenue & receivables |
– |
– |
8 |
8 |
|
Expenses & payables |
– |
– |
4 |
4 |
|
Other |
– |
1 |
4 |
5 |
|
Reconciliations |
– |
1 |
4 |
5 |
|
Employee benefits |
– |
– |
1 |
1 |
|
General journals |
– |
– |
1 |
1 |
|
Cash and cash equivalents |
– |
– |
1 |
1 |
|
Total |
4 |
13 |
54 |
71 |
|
Percentage |
6% |
18% |
76% |
100% |
(a) Information technology issues relating to the billing system have been included in the 'revenue & receivables' area of issue.
(b) The four extreme risk issues related to the metropolitan water entities' qualification errors outlined in Part 1.3.
Note: Figure 1F excludes low-risk issues raised.
Source: Victorian Auditor-General's Office.
Extreme- and high-risk issues across the sector
In 2014–15, 17 extreme- and high-risk issues were identified across the water sector relating to:
- fair valuation of infrastructure assets at the four metropolitan water entities, leading to qualified audit opinions on both the financial and performance reports
- tax effect accounting-related matters, resulting in material prior period error restatements to a water entity's financial report
- preparation and review of key general ledger reconciliations not occurring periodically across the reporting period
- improvements required to information technology (IT) security controls such as user access management, disaster recovery capabilities, patch management and authentication controls.
Common issues across the sector
More broadly, common areas requiring improvement to controls or financial reporting processes across the sector for 2014–15 were:
- IT system related matters
- monitoring, maintenance and accounting for infrastructure assets, property, plant and equipment
- monitoring, maintenance and user access within revenue billing systems.
Information technology
IT controls protect computer applications, infrastructure and information assets from a wide range of security and access threats. They promote business continuity, minimise business risk, reduce the risk of fraud and error, and help meet business objectives.
There is extensive reliance on IT across the water sector, and systems are continually upgraded and replaced to improve information management and the quality of services provided to the community. With the implementation of new IT, the upgrade of existing systems and the continuing emergence of external threats, new security risks to the IT environment can arise regularly.
In our Financial Systems Controls Report: Information Technology 2014–15, tabled in October 2015, we noted the following emerging issues across government, which were also present in water sector management letters raised across the 2014–15 reporting period:
- improvements to IT security controls around user access management authentication controls
- audit logging and monitoring of IT environment
- patch management.
Monitoring, maintenance and accounting for fixed assets
Water entities have substantial fixed assets including infrastructure, land, buildings and plant and equipment. At 30 June 2015 the aggregate value of fixed assets was $41.7 billion. The assets need to be appropriately recorded and maintained, and their condition and use monitored, so that decisions can be made about whether they are appropriately valued and when they need to be replaced.
In addition to the errors identified with the fair valuation of infrastructure assets at the four metropolitan water entities—highlighted in Section 1.3.1—other common issues across the sector relate to:
- the untimely capitalisation of fixed assets at five of the 19 water entities in 2014–15
- untimely disposal of fixed assets from the fixed asset register
- incorrect application of indices to determine the fair value of buildings under the requirements of FRD 103F
- failure to adequately record changes in fair valuation techniques
- inconsistent application of approved useful lives.
Monitoring, maintenance and user access within the revenue billing system
In 2014–15, the 19 water entities generated revenue of $5.6 billion, of which $3.3 billion relates to the billing of service and usage charges. The billing masterfile needs to be updated, monitored and maintained appropriately, to minimise the potential risk of fraud or errors. Inadequate monitoring of the billing system can lead to inaccurate charging of revenue and potential revenue foregone—ultimately leading to misstatements in the financial report.
The key issues identified were:
- control weaknesses over the customer and billing masterfile and lack of segregation of duties over amendments to credit notes
- control weaknesses over billing system user access and password management
- weak bad debtor write-off processes.
Water entities should seek to address all issues raised in accordance with the time periods raised in management letters, to remove potential weaknesses in their control frameworks and to reduce the risk of error in their financial reports. Recommended time lines for the resolution of these issues are detailed in Appendix B of this report.
Status of prior period issues
The status of internal control weaknesses or financial reporting issues identified in prior periods are presented and communicated to water entity management and their audit committees through the current years' management letters. These issues are monitored to ensure weaknesses identified by previous audits are resolved promptly.
Figure 1G shows the internal control weaknesses and financial reporting issues raised in the prior periods, with the resolution status by risk.
Figure 1G
Prior-period issues–resolution status by risk
|
Risk rating of issue |
||||
|---|---|---|---|---|
|
Period issue raised in |
Extreme |
High |
Medium |
Total |
|
Unresolved issues |
– |
2 |
16 |
18 |
|
Resolved issues |
– |
8 |
28 |
36 |
|
Total |
– |
10 |
44 |
54 |
Note: Figure 1G excludes low risk issues raised.
Source: Victorian Auditor-General's Office.
At the commencement of the 2014–15 reporting period, 54 high- and medium-rated issues raised since the 2011–12 reporting period remained unresolved. Across the 2014–15 reporting period, 36 or 67 per cent, of these issues were resolved and closed.
Two high-risk and 16 medium-risk issues raised in prior years remain unresolved. Time frames for resolution of high- and medium-risk rated issues should be within six months of the issue being raised. This means that the control frameworks in place at these entities are not as effective as they should be.
Management should seek to address all issues raised on a timely basis, to rectify any weaknesses in their control environment to mitigate the risk of material errors occurring in their financial statements.
Refer to Appendix B for detail on time lines for resolution by risk rating.
Follow up on Water Entities: Results of the 2013–14 Audits—Focus Areas
Our Water Entities: Results of the 2013–14 Audits report tabled in February 2015 analysed the management of gifts, benefits and hospitality across the four metropolitan water entities and the operations of audit committees across all 19 water entities. Nine issues were raised across the water sector. At the end of the 2014–15 reporting period, three issues relating to gifts, benefits and hospitality and two issues relating to audit committees remain unresolved.
In response to the recommendations in our Water Entities: Results of the 2013–14 Audits report, the Minister for Environment, Climate Change and Water requested that DELWP conduct spot checks on the receipt of gifts, benefits and hospitality at the four metropolitan water entities. As a result, DELWP instigated a review at the metropolitan water entities to ascertain whether they were addressing the recommendations made, and to identify opportunities for improvement to management practices and oversight of gifts, benefits and hospitality that could be applied more broadly across the sector.
From the proactive work conducted by DELWP, an updated policy is currently being finalised, and proposed workshops for training across the sector are being developed to enhance awareness and behaviour around the receipt of gifts, benefits and hospitality. We have conducted a performance audit, Implementing the Gifts, Benefits and Hospitality Framework, scheduled for tabling in December 2015.
1.4 Emerging matters
1.4.1 Government review of water board positions
On 8 April 2015, the Minister for Environment, Climate Change and Water announced that the government would review all board positions (excluding managing directors). All current and prospective board members were encouraged by the government to participate in an expressions of interest process. More than 1 400 people expressed interest in joining one of the 19 water entities' boards following the announcement.
The minister announced the newly appointed board members on 29 September 2015, with positions effective from 1 October 2015. Figure 1H highlights the split between the newly appointed board members and reappointed board members for the 19 water entities, comprising 12 newly appointed chairpersons, with 87 of the 130 (or 67 per cent) being newly appointed members for the sector.
Figure 1H
Composition of the 19 water entities' board positions
|
Composition |
Chairpersons |
Members |
|---|---|---|
|
New members |
12 |
87 |
|
Reappointed members |
7 |
43 |
|
Total |
19 |
130 |
Source: Victorian Auditor-General's Office.
Essential Services Commission—review of water pricing approach
The Water Industry Regulatory Order was revised in October 2014, and now allows ESC to consider a broad range of pricing approaches for Victorian water and sewerage customers. As a result, ESC commenced an extensive consultative review of their pricing approach.
The selected pricing approach(es) will underpin ESC's next major water price review for the fourth regulatory period from 1 July 2018. ESC is expected to release its guidance for the 2018 price review in late 2016.
The review focuses on generating new ideas for the future pricing approach. ESC has also engaged a number of independent regulatory experts to provide their views on alternative pricing approaches. Over the remainder of the 2015 calendar year, ESC will be considering the matters raised in submissions responding to the consultation paper and other papers prepared by the regulatory experts.
Commencement of the pricing submission period effective 1 July 2016
As noted previously, Melbourne Water and Goulburn-Murray Water's current water plans cease on 30 June 2016.
Melbourne Water has commenced the process to set waterway, drainage and wholesale water and sewerage charges for 2016–17 to 2020–21, which will come into effect on 1 July 2016. Consultation closed on 1 July 2015 and the final submission was made on 30 October 2015.
ESC has also commenced its review of Goulburn-Murray Water's price submission for the period 2016–17 to 2020–21, where the final submission was made on 7 September 2015. ESC expects to release a draft decision on Goulburn-Murray Water's prices and services, and another consultation process on the draft decision will occur in March 2016.
2015–16 asset revaluation
A full valuation of property, plant, equipment and infrastructure assets for the water sector is scheduled for the 2015–16 financial year, as per the requirements under FRD 103F—this occurs every five years.
In addition to our audit qualification relating to the fair valuation infrastructure assets of the metropolitan water entities in 2014–15, our review of the 2010–11 fair valuation for regional urban and rural water entities found that improvements could be made to the processes applied to valuing infrastructure assets.
In particular, in our Water Entities: Results of the 2010–11 Audits report we recommended that:
- water entities work with the Department of Treasury & Finance and the Valuer-General Victoria (VGV) to determine the most appropriate valuation methodology for infrastructure assets
- the VGV should ensure all valuations conducted, including those by service providers ,be subjected to rigorous quality assurance processes, and that appropriate effort is invested in establishing agreement with client entities before valuations are conducted.
In preparation for the upcoming revaluation year (2015–16), the water industry has proactively formed an inter-agency working group, which is being administered by the industry body, VicWater. The group consists of representatives from the water entities, VGV, DELWP and the Department of Treasury & Finance, and observers from VAGO.
The revaluation process will be a significant area of focus for water entities during 2015–16 and a key focus area for our audit program.
Recommendations
- That water entities address issues raised in audit management letters on a timely basis so that any weaknesses in their control environment are rectified promptly.
- That metropolitan water entities change their current valuation model used to estimate the fair value of infrastructure assets to correct the errors identified by audit in the qualification.
2 Financial outcomes
At a glance
Background
This Part looks at the collective 30 June 2015 financial position of the 19 water entities. It details the main drivers behind the net results achieved, and analyses the sector's financial sustainability risks.
Conclusion
The financial performance of the water sector has shown an improvement for the 2014–15 reporting period. The sector generated a combined net profit before income tax of $430.6 million for the year ended 30 June 2015, an increase of $109.7 million from the prior year. Fifteen water entities reported a growth in their net result (or reduction in their net deficit), with only four entities delivering a loss before income tax, compared to six in 2013–14.
Despite the improvement in short-term results for the majority of the sector, when analysing risks to financial sustainability there are weak liquidity risk results for the metropolitan and regional urban water entities given the quantum of short-term debt held, and longer-term risks associated with the sector's ability to replace/renew assets and to repay debt.
Findings
- The commencement of the former Fairer Water Bills initiative led to rebates or tariff reductions being provided to Victorian customers, effective 1 July 2014.
- In 2014–15, dividends paid by the four metropolitan water entities totalled $120.8million, an increase of $82.4 million on 2013–14. No interim dividend was determined for Melbourne Water for 2014–15 due to an outstanding income tax related matter.
- At 30 June 2015, the sector controlled $42.9 billion in total assets—$41.9billion at 30 June 2014—and had total liabilities of $20.4 billion—$20.2billion in 2014.
- Interest‑bearing liabilities increased by $146.3 million during the year, largely due to increases in borrowings to fund capital and other obligations.
2.1 Introduction
This Part looks at the collective 30 June 2015 financial position of the 19 water entities. It details the main drivers behind the net results achieved, and analyses the sector's financial sustainability risks.
Accrual-based financial reports enable an assessment of whether water entities generate sufficient surpluses from their operations to maintain services, fund asset maintenance or renewal and repay debt. Their ability to generate surpluses is subject to the regulatory environment in which they operate and their ability to minimise costs and maximise revenue.
An entity's financial performance is measured by its net profit or loss—the difference between its revenues and expenses. An entity's financial position is measured by reference to its net assets—the difference between its total assets and total liabilities.
2.2 Conclusion
The financial performance of the water sector has shown an improvement for the 2014–15 reporting period.
The sector generated a combined net profit before income tax of $430.6 million for the year ended 30 June 2015, an increase of $109.7 million from the prior year. Fifteen water entities reported a growth in their net result (or reduction in their net deficit), with only four delivering a loss before income tax, compared to six in 2013–14.
Despite the improvement in short-term results for the majority of the sector, when analysing risks to financial sustainability there are weak liquidity risk results for the metropolitan and regional urban water entities given the quantum of short-term debt held, and longer-term risks associated with the sector's ability to replace or renew assets and to repay debt.
2.3 Financial overview of the sector
2.3.1 Financial performance
Figure 2A provides an overview of the financial performance and position of the Victorian water sector for the current and prior period, by relevant cohort—metropolitan, regional urban and rural.
As can be seen, the metropolitan water cohort—comprising the metropolitan wholesaler and three metropolitan retail water entities—contribute to a significant proportion of the sector's transactions and balances, followed by the 13 regional urban water entities, and then the two rural water entities.
Figure 2A
Financial overview of the sector
2014–15 |
2013–14 |
2014–15 |
2013–14 |
2014–15 |
2013–14 |
2014–15 |
2013–14 |
||||
|---|---|---|---|---|---|---|---|---|---|---|---|
Financial performance |
|||||||||||
Revenue | |||||||||||
Water service and usage charges(a) |
3 252.2 |
3 379.1 |
2 176.8 |
2 335.7 |
917.3 |
893.7 |
158.1 |
149.7 |
|||
Developer contributions |
368.2 |
301.6 |
266.7 |
216.8 |
101.4 |
84.8 |
0.0 |
0.0 |
|||
Fixed and variable charges levied by Melbourne Water to retailers(a) |
1 326.9 |
1 375.4 |
1 326.9 |
1 375.4 |
0.0 |
0.0 |
0.0 |
0.0 |
|||
Other |
604.9 |
523.8 |
427.3 |
356.2 |
51.3 |
54.2 |
126.3 |
113.4 |
|||
Total |
5 552.1 |
5 579.8 |
4 197.7 |
4 284.1 |
1 070.0 |
1 032.7 |
284.4 |
263.1 |
|||
Percentage of total |
100% |
100% |
75.6% |
76.8% |
19.3% |
18.5% |
5.1% |
4.7% |
|||
Expenses |
|||||||||||
Employee benefits |
533.1 |
528.8 |
235.2 |
234.0 |
214.3 |
214.1 |
83.6 |
80.8 |
|||
Depreciation and amortisation |
988.5 |
947.9 |
584.6 |
552.6 |
321.4 |
313.5 |
82.4 |
81.8 |
|||
Operating, administrative and other expenses |
1 212.5 |
1 230.9 |
739.5 |
734.0 |
342.0 |
346.3 |
131.0 |
150.6 |
|||
Finance costs |
1 116.7 |
1 126.1 |
968.6 |
977.9 |
138.3 |
138.1 |
9.8 |
10.1 |
|||
Fixed and variable charges levied by Melbourne Water to retailers (a) |
1 270.6 |
1 425.2 |
1 270.6 |
1 425.2 |
0.0 |
0.0 |
0.0 |
0.0 |
|||
Total |
5 121.5 |
5 259.0 |
3 798.6 |
3 923.7 |
1 016.0 |
1 012.0 |
306.9 |
323.3 |
|||
Percentage of total |
100.0% |
100.0% |
74.2% |
74.6% |
19.8% |
19.2% |
6.0% |
6.1% |
|||
Net result |
|||||||||||
Net result before tax |
430.6 |
320.9 |
399.0 |
360.4 |
54.0 |
20.7 |
-22.4 |
-60.2 |
|||
Net result after tax |
312.2 |
224.4 |
286.1 |
253.7 |
41.5 |
12.7 |
-15.8 |
-41.9 |
|||
Financial position |
|||||||||||
Assets |
|||||||||||
Cash and cash equivalents |
374.2 |
398.2 |
44.4 |
112.4 |
150.5 |
91.6 |
179.3 |
194.2 |
|||
Receivables |
736.9 |
723.8 |
511.2 |
488.6 |
195.8 |
193.8 |
29.9 |
41.4 |
|||
Infrastructure assets, intangible assets, property, plant and equipment and work in progress |
41 699.2 |
40 698.3 |
24 488.4 |
23 579.0 |
11 790.8 |
11 712.7 |
5 420.0 |
5 406.5 |
|||
Other |
137.7 |
126.7 |
86.7 |
74.0 |
47.2 |
46.9 |
3.7 |
5.9 |
|||
Total |
42 947.9 |
41 947.0 |
25 130.7 |
24 254.0 |
12 184.3 |
12 045.1 |
5 632.9 |
5 647.9 |
|||
Percentage of total |
100.0% |
100.0% |
58.5% |
57.8% |
28.4% |
28.7% |
13.1% |
13.5% |
|||
Liabilities |
|||||||||||
Payables, accruals, provisions and other liabilities |
1 079.5 |
1 112.1 |
724.8 |
768.9 |
199.6 |
199.6 |
155.0 |
143.6 |
|||
Interest bearing liabilities (includes finance lease) |
14 791.3 |
14 645.0 |
12 512.6 |
12 374.2 |
2 144.6 |
2 113.7 |
134.1 |
157.2 |
|||
Net deferred tax liabilities |
4 577.9 |
4 429.0 |
2 833.6 |
2 692.0 |
1 076.8 |
1 062.8 |
667.6 |
674.2 |
|||
Total |
20 448.7 |
20 186.1 |
16 071.0 |
15 835.1 |
3 421.0 |
3 376.1 |
956.7 |
975.0 |
|||
Percentage of total |
100.0% |
100.0% |
78.6% |
78.4% |
16.7% |
16.7% |
4.7% |
4.8% |
|||
Equity |
|||||||||||
Contributed capital |
9 119.2 |
9 052.3 |
1 697.0 |
1 697.7 |
4 479.0 |
4 430.5 |
2 943.2 |
2 924.1 |
|||
Revaluation reserve |
8 508.9 |
8 042.6 |
4 562.0 |
4 101.1 |
2 173.0 |
2 167.6 |
1 773.9 |
1 773.9 |
|||
Retained earnings |
4 871.1 |
4 665.1 |
2 800.7 |
2 620.1 |
2 111.2 |
2 070.0 |
- 40.8 |
- 25.0 |
|||
Total |
22 499.2 |
21 760.1 |
9 059.7 |
8 418.9 |
8 763.3 |
8 668.1 |
4 676.2 |
4 673.0 |
|||
Percentage of total |
100.0% |
100.0% |
40.3% |
38.7% |
38.9% |
39.8% |
20.8% |
21.5% |
|||
(a) Inclusive of the impact of the former Fairer Water Bills Initiative contribution.
Note: The above balances
and transactions are derived directly from the published annual reports,
therefore do not eliminate inter-sector entity transactions, nor have they been
adjusted for the combined errors to infrastructure assets and the
infrastructure asset revaluation reserve of $1 347.2 million for
30 June 2015 ($417.0 million for 30 June 2014), as a result of the
metropolitan water entities qualification. Refer to Part 1 of this report for
further detail. Note: Numbers may
vary slightly due to rounding.
Source: Victorian
Auditor-General's Office.
Net result
The 19 water entities generated a combined net profit before income tax of $430.6 million for the year ended 30 June 2015, an increase of $109.7 million or 34 per cent from the prior year. Figure 2B shows the net profit or loss before income tax for each entity for the past two years.
Figure 2B
Net profit/(loss) before income tax, by water entity
Entity |
2014–15 |
2013–14 |
Change |
Change |
|---|---|---|---|---|
Metropolitan |
||||
Melbourne Water |
160.4 |
131.9 |
28.5 |
22 |
City West Water |
47.3 |
36.1 |
11.2 |
31 |
South East Water |
118.3 |
126.4 |
(8.1) |
(6) |
Yarra Valley Water |
73.0 |
66.0 |
7.0 |
11 |
Total |
399.0 |
360.4 |
38.6 |
11 |
Regional urban |
||||
Barwon Water |
16.9 |
11.3 |
5.6 |
50 |
Central Highlands Water |
14.2 |
10.3 |
3.9 |
38 |
Coliban Water |
5.8 |
(4.3) |
10.1 |
235 |
East Gippsland Water |
4.3 |
4.0 |
0.3 |
8 |
Gippsland Water |
1.8 |
4.9 |
(3.1) |
(63) |
Goulburn Valley Water |
7.0 |
2.5 |
4.5 |
180 |
GWMWater |
(9.5) |
(15.1) |
5.6 |
37 |
Lower Murray Water |
(8.4) |
(3.8) |
(4.6) |
(121) |
North East Water |
2.5 |
5.5 |
(3.0) |
(55) |
South Gippsland Water |
0.6 |
(0.4) |
1.0 |
250 |
Wannon Water |
5.0 |
2.6 |
2.4 |
92 |
Western Water |
11.7 |
1.6 |
10.1 |
631 |
Westernport Water(a) |
2.2 |
1.5 |
0.7 |
47 |
Total |
54.1 |
20.7 |
33.4 |
163 |
Rural |
||||
Goulburn-Murray Water |
(17.8) |
(55.5) |
37.7 |
68 |
Southern Rural Water |
(4.7) |
(4.7) |
0.0 |
0 |
Total |
(22.5) |
(60.2) |
37.7 |
63 |
Sector total |
430.6 |
320.9 |
109.7 |
34 |
(a) In
2014–15, Westernport Water restated their 2013–14 net result before tax. As a
result, the net result before tax comparative figure reported in the 2014–15
financial report is $0.2 million higher than that shown in their 2013–14
financial report.
Note: Numbers
may vary slightly due to rounding.
Source: Victorian
Auditor-General's Office.
The metropolitan water cohort generated $399.0 million of this net profit before income tax—a collective $38.6 million increase on the prior year. The regional urban water entities generated a combined $54.1 million of this net profit before income tax, a $33.4 million increase on the prior year—11 regional urban water entities recorded a net profit before income tax in comparison to nine water entities in the prior year.
There was also an improvement in the rural cohort where, despite recording a combined net deficit before tax of $22.5 million, one entity recorded a $37.7 million improvement to their deficit from the prior year.
The 19 water entities are subject to the National Tax Equivalent Regime (NTER) administered by the Australian Taxation Office. NTER is an administrative arrangement that results in government-owned enterprises paying a tax equivalent to the state government. The combined net profit after tax was $312.2 million, an increase of $87.8 million, or 39 per cent, on the prior year. Income tax, under the NTER, is calculated at 30 per cent—$118.4 million was incurred in 2014–15, compared with $96.5 million in 2013–14, the increase a direct result of improved financial performance.
Revenue
In 2014–15, the 19 water entities generated revenue of $5.5 billion, a decrease of $27.7 million, or 0.5 per cent, on the prior year.
Service and usage charges increased by $57.6 million, or 1.7 per cent in comparison to 2013–14. Regional urban water entities saw the greatest increase to their service and usage charges of $41.0 million due to new customer connections and drier weather conditions increasing consumption, and a slight increase in prices in year two of Water Plan 3. The increase in service and usage charges was largely offset by the Government Water Rebate—formally the Fairer Water Bills initiative—where rebates and tariff adjustments were provided to customers.
The metropolitan cohort (and Western Water) provided the most significant rebates, returning $172.4 million to eligible customers from 1 July 2014. Melbourne Water contributed to $129.1 million of this rebate—approximately 75 per cent—with the metropolitan retailers and Western Water contributing the remaining 25 per cent. Figure 2C shows the contribution break down.
Figure 2C
2014–15 Government Water Rebate returned to metropolitan customers
($ million)
Entity name |
Melbourne Water |
Individual water |
Total rebate |
|---|---|---|---|
City West Water |
27.5 |
9.2 |
36.7 |
South East Water |
48.5 |
16.1 |
64.6 |
Yarra Valley Water |
49.1 |
16.6 |
65.7 |
Western Water(b) |
4.0 |
1.4 |
5.4 |
Total |
129.1 |
43.3 |
172.4 |
(a) $56.6
million of the total contribution by Melbourne Water was recognised in 2013–14
as it related to savings in that year, however, was paid to the water retailers
and Western Water in the 2014–15 reporting period.
(b) Western Water eligible
customers were captured in the Melbourne Water boundaries for the provision of
this rebate.
Source: Victorian
Auditor-General's Office.
Melbourne Water is the wholesaler of Melbourne's water supply and is responsible for managing catchments, managing waterways and major drainage systems, treating water and transferring the water to the metropolitan water retailers—City West Water, South East Water and Yarra Valley Water. The costs incurred by Melbourne Water for these activities are charged to the metropolitan water retailers by way of bulk water and sewerage charges, which are approved by the Essential Services Commission.
Bulk water and sewerage charges, including rebates, levied by Melbourne Water, to the metropolitan water retailers also decreased by approximately $48.5 million due to their contribution of the Government Water Rebate in 2014–15, and a reduction in prices levied to take into account lower desalination plant contract costs as a result of the savings from refinancing that took place in 2013–14.
The further decrease in revenue was partially offset by an increase in developer contributed assets and new customer contributions of $66.6 million, or 22.1 per cent, across the metropolitan and regional urban cohorts, which was driven by an increase in developer activities during the year.
Expenses
In 2014–15, the 19 entities incurred $5.1 billion in total expenditure, a decrease of $137.5 million, or 2.6 per cent, from the prior year, predominantly due to:
- bulk water charges paid by the metropolitan retail water entities to Melbourne Water decreased by approximately $155 million, largely due to Melbourne Water's contribution to the Government Water Rebate offsetting the cost by $125.1 million, and the reduction in prices as a result of the desalination plant contract cost savings
- operating, administrative and other expenses decreased by $18.3 million, or 1.5per cent, across the water sector
- finance costs decreased by $9.4 million, or 0.8 per cent, largely due to Melbourne Water holding lower average borrowings as a result of repaying maturing debt and a further decrease from the desalination plant refinancing savings—while Melbourne Water's interest expense decreased by $20.4 million, this was offset by the metropolitan water retailers, as their finance costs increased by a combined $11.1 million, due to an increase in average borrowings held to fund capital and other obligations
- depreciation and amortisation increased by $40.6 million, or 4.3 per cent, due to the growth in infrastructure, property, plant and equipment balances of water entities from prior year revaluation increments and capital additions.
Dividends
The 19 entities are obliged to pay a dividend to the state if the Treasurer, after consultation with the governing board and responsible minister, makes a formal determination to do so. In the past, only the metropolitan water entities, as for-profit entities, have been required to pay a dividend. The regional urban and rural water entities have not been required to make a dividend payment in part due to historical operating results generated.
Dividends are generally paid twice a year based on a prescribed percentage of the net profit before tax:
- an interim dividend determined in April based on half-year financial results
- a final dividend determined in October based on annual financial results.
In 2014–15, dividends paid by for the four metropolitan water entities totalled $120.8 million—an increase of $82.4 million, or 215 per cent, on 2013–14. This excludes a dividend payment by Melbourne Water on 31 July 2013 of $94.5 million relating to their 2011–12 final dividend.
As reported in the Auditor-General's Report on the Annual Financial Report of the State of Victoria, 2013–14 the calling of dividends each year has had a significant impact on the general government sector achieving its key financial measure of a surplus of at least $100 million each financial year, consistent with net debt and infrastructure parameters. In 2013–14, an interim dividend was not called from the water sector. However, in 2014–15, the government called for an interim dividend.
Figure 2D details the total interim and final dividends across the current and prior period.
Figure 2D
Interim and final dividends paid over the past two years
Year |
Final dividends paid |
Interim dividends paid |
Total |
|---|---|---|---|
2013–14(a) |
38.4 |
– |
38.4 |
2014–15 |
87.7 |
33.1 |
120.8 |
Total |
126.1 |
33.1 |
159.2 |
(a) This
figure excludes $94.5 million for a final dividend paid by Melbourne Water in
respect of the 2011–12 reporting period, on 31 July 2013.
Source: Victorian
Auditor-General's Office.
It is important to note that no interim dividend has been determined for Melbourne Water in relation to 2014–15. At the date of this report, an interim dividend was only 'proposed' by the Treasurer of Victoria in June 2015. Melbourne Water requested a deferral of the determination until the resolution of an income tax related matter regarding the Victorian Desalination Plant—resolution expected by Melbourne Water on this matter in December 2015.
2.3.2 Financial position
Assets
At 30 June 2015, the 19 water entities had assets of $42.9 billion, an increase of $1.0 billion, or 2.4 per cent, compared to the prior year. Property, plant, equipment and infrastructure assets represented 97.1 per cent of total assets.
A $1.0 billion increase in the value of property, plant, equipment and infrastructure assets occurred at 30 June 2015, predominantly driven by:
- significant revaluation increments of the metropolitan water entities:
- $332.3 million at South East Water on infrastructure assets
- $152.4 million at Melbourne Water on land
- $64.9 million at Yarra Valley Water on infrastructure assets
- $65.8 million at City West Water on infrastructure assets and land
- additions to infrastructure assets across all cohorts.
The above revaluation increments to infrastructure assets for the metropolitan water entities are impacted by the error identified in their fair value methodology for infrastructure assets, as noted in Part 1.3.1 Financial audit opinions issued.
Cash and cash equivalents held by water entities decreased by $24 million, or 6.0 per cent, on the prior year due to a reduction in cash and deposits held by Melbourne Water of $70 million—the corporation utilised cash on hand to avoid the use of borrowings across the period as opposed to holding on to deposits.
Goulburn-Murray Water also received lower funding receipts of $17 million compared to the prior year in respect to the Connections Project. Goulburn-Murray Water assumed responsibility of the food bowl modernisation project, now referred to as the Connections Project, on 1 July 2012.
This reduction was partially offset by an increase of $58.9 million in cash and cash equivalents held by the regional urban cohort due to stronger cash flows from operating activities and some entities drawing down on deposits from the Treasury Corporation of Victoria to take advantage of lower interest rates or on previously approved financial accommodation (borrowings) to avoid foregoing access to these facilities.
Liabilities
At 30 June 2015, the water industry had combined liabilities of $20.4 billion, an increase of $262.6 million, or 1.3 per cent, on the prior year. Net deferred tax liabilities increased by $149.0 million, or 3.3 per cent, in 2014–15 and interest-bearing liabilities continued to grow by a further $146.3 million, or 1.0 per cent, during the year, largely used to fund the construction of infrastructure assets and other obligations.
The metropolitan water retail entities' interest-bearing liabilities increased by $255.8 million. South East Water contributed the largest increase primarily to take advantage of low interest rates during the year. In contrast, Melbourne Water reduced its interest-bearing liabilities by $117.3 million due to repayments of maturing loans and a further year's payment of the Victorian Desalination Plant finance lease.
Interest-bearing liabilities across the regional urban water entities increased by $30.9 million, or 1.5 per cent—six of the 13 entities increased their debt levels, while the remaining seven repaid maturing debt. The two rural water entities decreased their interest-bearing liabilities—Goulburn-Murray Water repaid $22.1million in total.
2.4 Risks to financial sustainability
2.4.1 Financial sustainability
To be financially sustainable, entities need the capacity to meet their current and future expenditure as it falls due. They also need to be able to absorb the financial impacts of changes and financial risks that materialise, without significantly changing their revenue and expenditure policies.
Financial sustainability should be viewed from both a short- and long-term perspective. Short-term indicators relate to the ability of an entity to maintain positive operating cash flows, or the ability to generate an operating surplus over the short term. Long-term indicators focus on an entities ability to fund significant asset replacement or reduce long-term debt to minimise intergenerational financial sustainability risks.
In this Section, we provide insight into the financial sustainability risks of the water sector at 30 June 2015, and trends over a five-year period. The indicator results are calculated using the financial transactions and balances of each entity's statutory financial report.
The indicators highlight risks to ongoing financial sustainability in either the short or longer term. However, forming a definitive view of any entity's financial sustainability requires a holistic analysis that moves beyond historical financial considerations to also include the water entity's financial forecasts, strategic plans, and their operations and environment, including the regulatory environment.
We use seven financial sustainability risk indicators taken over a five-year period to assess the financial sustainability risks in the water sector. Appendix C describes the financial sustainability indicators, risk assessment criteria and benchmarks used.
2.4.2 Overall assessment
Figure 2E provides a 'snapshot' of the seven indicator results in sector aggregate and by cohort, against the industry average for the past five years.
Figure 2E
Financial sustainability snapshot of the sector
| Indicator |
Sector average |
Sector average |
Metropolitan average |
Regional urban average |
Rural average |
|---|---|---|---|---|---|
Net result |
1.36% |
3.29% |
6.80% |
3.81% |
-7.11% |
Interest Cover Ratio |
6.44 |
6.25 |
2.41 |
6.20 |
14.23 |
Liquidity Ratio |
0.82 |
0.99 |
0.54 |
1.08 |
1.34 |
Internal Financing Ratio |
69.13% |
97.63% |
64.90% |
110.68% |
78.25% |
Capital Replacement Ratio |
1.64 |
1.28 |
1.93 |
1.10 |
1.15 |
Debt to Assets |
0.19 |
0.20 |
0.46 |
0.15 |
0.02 |
Debt Service Cover |
N/A |
N/A |
N/A |
N/A |
3.32 |
Note: A
red result shows a high-risk assessment, orange a medium-risk assessment and
green a low-risk assessment.
Note: In
relation to the 'debt service cover indicator', where any entity has not made
an actual repayment of their debt, this indicator will result in an 'NA'
outcome for the sector and relevant cohort. Refer to Appendix C for further
detail.
Source: Victorian-Auditor
General's Office.
The sector results for 2014–15 have been positive for the following indicators:
- Net result—as discussed in Section 2.3.1, the water sector has shown an improvement in financial performance for the 2014–15 reporting period, on an already positive result in the prior year.
- Interest cover ratio—water entities have maintained an adequate level of interest cover over the 2014–15 year and trend period. While debt levels and finance costs have increased, the sector continues to generate sufficient cash flows from operations to service their debt—meeting interest and financial accommodation levy payments.
- Internal financing ratio—this indicator assesses the ability of water entities to set aside a portion of their cash flows from operating activities to finance capital investment. Consistent with the benchmark set by the Essential Services Commission, 35 per cent of cash flows received from operations is deemed a prudent level, noting that water entities have the ability (and the expectation given the regulatory pricing structure) to borrow funds. All cohorts have reported a result in excess of 35 percent over the review period for this indicator. Nevertheless, we have seen the level of borrowings increase across the sector by 29.3 per cent, from $8 billion in 2010–11 to $10.4 billion in 2014–15, where three metropolitan retail and five regional urban water entities have not repaid any debt. Refer to Part 4 for further detail.
- Debt to assets—all cohorts have maintained an adequate level of gearing over the period as the combined debt portfolio of $14.8 billion is substantially lower than the total asset base of $42.9 billion—infrastructure, property, plant and equipment make up $41.7 billion. This positive result is largely driven by the nature and significant value of the sector's asset base, given regular asset revaluations and continual capital renewal projects.
Despite the aggregate results, each of the cohorts face individual challenges—the metropolitan cohort reported a high-risk liquidity result, the regional urban cohort reported a medium-risk capital replacement outcome, and the rural cohort reported a medium-risk net result and capital replacement outcome for the period.
The metropolitan cohort and the regional urban cohort have also been assessed as having 'N/A' results for the debt service cover indicator, given some entities within these cohorts have not made repayments on their borrowings. The following Section addresses the higher-risk indicator results in further detail.
2.4.3 Short-term indicators
The short-term indicators—net result, liquidity and interest cover—focus on a water entity's ability to maintain positive operating cash flows and adequate cash holdings, and to generate an operating surplus over the short term.
The water sector has shown an improvement in their performance, reducing the risk of financial issues in the short term. However, there are still some parts of the sector that face losses from operations and less than desirable liquidity results. These factors are explored in more detail below.
Net result
Two regional urban water entities—Lower Murray Water and GWMWater—and two rural water entities—Goulburn-Murray Water and Southern Rural Water—experienced deficit net results for 2014–15. These entities are all rated a medium risk for this indicator, an improvement from the prior year, where three were rated high risk.
In particular, the rural water entities have experienced significant net deficits. Figure 2F shows those results for the rural cohort.
Figure 2F
Average net result indicator
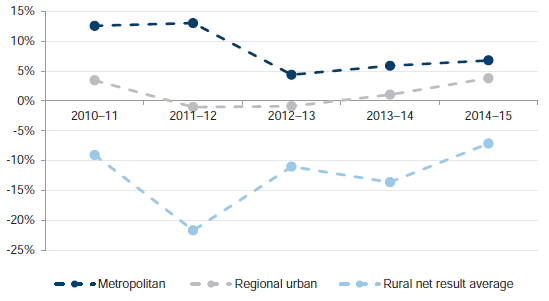
Source: Victorian Auditor-General's Office.
Water entities operate under a regulated pricing model that does not allow for the full amount of depreciation, as reported in their financial statements, to be recovered through prices levied from customers. The loss is amplified for rural entities due to:
- the regulatory asset values set by the then Minister for Water, were at 0 to 2 percent of the total asset values as at 1 July 2004
- these entities being responsible for the delivery and construction of significant capital programs (largely funded by governments).
Both these factors mean that the regulatory asset base used by the Essential Services Commission to set prices for these entities is substantially lower than the value of assets in their financial reports. As a result, these entities recover a much lower amount of depreciation through prices levied when compared to the depreciation expense in their financial reports, leading to the operating losses experienced.
Another indicator of short-term financial sustainability risks is the earnings before interest, tax, depreciation and amortisation (EBITDA) margin— earnings before interest, tax, depreciation and amortisation/ total revenue. This measures an entity's ability to fund financing charges, tax obligations and asset renewal—the higher the EBITDA margin, the greater availability of funds for this purpose. Figure 2G shows the difference between the net result and the EBITDA margin for the rural entities over the review period.
Figure 2G
Net result and EBITDA margin comparison
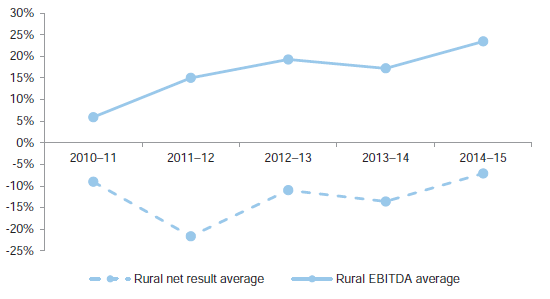
Source: Victorian Auditor-General's Office.
Liquidity
As shown in Figure 2E, the results of the liquidity ratio for the 2014–15 reporting period differ substantially for the metropolitan water entities—at high risk—to that of the rest of the sector.
The 0.54 outcome for the period is concerning. A key driver to this result is Melbourne Water, which has recorded the lowest liquidity ratio result for the past five years, with an average of 0.21. This outcome is a direct result of the liquidity strategy employed by Melbourne Water. The corporation's objectives are to apply the following:
- minimise the closing balance of bank accounts and utilise excess cash to reduce outstanding debt where possible
- actively manage the working capital position to accelerate the timing of cash inflows and/or implement strategies to redeploy capital invested in non-regulated assets to more productive uses.
Such objectives are linked to the corporation's management of debt and adversely impact this short-term indicator.
The three metropolitan water retailers have had a combined high-risk result for this indicator over the past five years, heavily influenced by the quantum of short-term debt held as current liabilities on their balance sheets.
The low-risk result in Figure 2E, of 1.08 for the regional urban cohort is distorted, as only four of the 13 water entities held liquidity ratios in excess of 1.0 for the 2014–15 reporting period. One of these entities reported a significantly higher result than the rest of the cohort due to a substantial amount of cash held on deposit at 30 June 2015 relating to a government-funded capital project. The remainder of the regional urban cohort reported only one entity at high risk and eight at medium risk—compared to six at high risk in 2013–14.
The majority of regional urban water entities' liquidity ratio for 2014–15 improved, in comparison to the prior year, due to:
- drawing down on approved financial accommodation (borrowings) to take advantage of lower interest rates and to avoid foregoing approved financing facilities, and/or
- higher cash balances due to reduced capital spend or greater cash flows from operations.
The rural water entities both reported low risks for the liquidity ratio, due to cash and deposits held from government-funded programs and lower borrowings required for capital replacement given these government-funded programs.
It is important to note that the Borrowing and Investment Powers Act 1987 provides a government guarantee for borrowings obtained in accordance with the Act for all water entities. Please refer to Part 4 of this report 'Trends in debt management' for further detail on debt trends across the sector.
Figure 2H shows the movement to the liquidity ratio, across the sector for the trend period.
Figure 2H
Liquidity ratio—all water entities
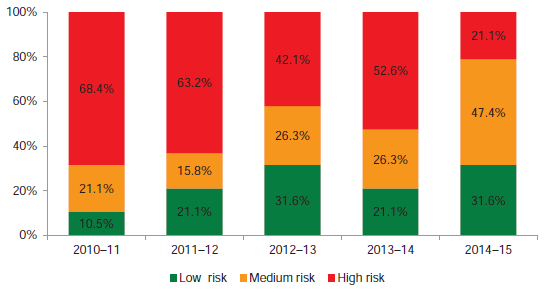
Source: Victorian-Auditor General's Office.
2.4.4 Long-term indicators
The long-term indicators—debt service cover, internal financing, debt-to-assets and capital replacement—indicate whether adequate revenue is available to:
- replace assets to maintain the quality of service delivery, to meet community expectations and the demand for services
- repay debt in the longer term.
As shown in Figure 2E, the water sector has improved performance in the short term with their net result outcomes, however, longer-term challenges still exist.
Capital replacement
The capital replacement indicator illustrates whether water entities are spending more on replacing or renewing assets each year compared with their depreciation expense. The depreciation expense represents the value of assets consumed in the year.
The average capital replacement indicator has experienced a downward trend, with nine entities now falling within the high-risk category in 2014–15—eight regional urban water entities and one metropolitan water entity. Figure 2I demonstrates this decline by cohort.
Figure 2I
Average Capital replacement ratio
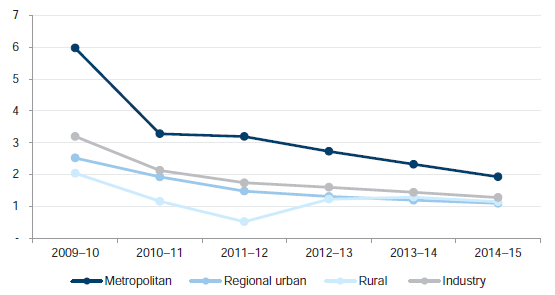
Note: The
data used in this chart is derived directly from the published annual reports,
therefore has not been adjusted for the combined estimated errors to
infrastructure assets and the infrastructure asset revaluation reserve of $1
347.2 million for 30 June 2015 ($417.0 million for 30 June 2014), as a result
of the metropolitan water entities qualification. Refer to Part 1 of this
report for further detail.
Source: Victorian
Auditor-General's Office.
The downward trend indicates that the level of capital spending for asset renewal or replacement has not kept pace with the consumption of assets—using depreciation expenditure as an indicator of consumption of assets. It is important to note that the depreciation expense is linked to the carrying value of infrastructure, property, plant and equipment, where:
- for the metropolitan water entities—the decline in 2010–11 reflected the impact of the revaluation of infrastructure assets in 2009–10 to fair value, where depreciation expense increased significantly in 2010–11 as a result of the higher asset values
- for the regional urban and rural water entities, the decline in 2011–12 reflected the impact of the revaluation of their infrastructure assets in 2010–11 to fair value, where the depreciation expense increased in the year following the revaluations.
Consequently, the growth in the fair value of entity assets increases the annual depreciation charge and therefore the value of assets consumed in the period.
Another factor impacting the outcome of this indicator is the timing and extent of an entity's capital works program. The sector has been required to achieve cost savings from an operational and capital perspective as a result of the former Fairer Water Bills initiative. Delays or reductions in capital works programs will adversely impact this indicator outcome for 2014–15 and may potentially have longer-term impacts on service delivery.
The trend over the review period is significant. Water entities need to be cognisant of the declining trend and assess the longer-term risks of not replacing assets at a pace matching their consumption.
Debt service cover
The water entities increased their interest-bearing liabilities, comprising borrowings and finance lease liabilities, by $6.6 billion or 109 per cent over the past five-years—$5.4 billion of this increase occurred in 2012–13 as a result of the desalination plant.
In our Water Entities: Results of 2013–14 Audits report, we indicated that we would take a closer look at the debt service indicator in this reporting period, as we found the outcomes of the indicator were distorting the underlying risk exposure to the sector. From analysing the indicator more closely, we identified that entities who did not repay principal debt (which they instead refinanced) reported a better result than those entities that actually commenced repaying maturing debt.
As a result, we reconsidered the definition and criteria of this indicator where, if a water entity had not repaid debt, the outcome of this indicator was deemed not applicable. This change was made as the underlying objective of this indicator—for our financial sustainability risk assessment—is to measure an entity's current ability to repay debt from its operating funds. It is important to note, that we measure an entity's ability to service debt in the short-term using our interest service cover indicator.
From our analysis, we identified the following:
- one metropolitan water entity has shown capacity to repay interest-bearing liabilities, being borrowings and finance lease obligations over the past five years
- eight regional urban water entities have shown capacity to repay interest-bearing liabilities over the past five years, three of which also met finance lease obligations
- both rural water entities have shown a capacity to repay debt over the past five years, albeit their borrowings are substantially lower than the rest of the sector given the extent of government funding provided for capital projects.
Repayment of debt is a key challenge for some water entities. Further details of the water sector's debt position and management can be found in Part 4 of this report, Trends in debt management.
3 Performance reporting
At a glance
Background
This Part covers the results of the 2014–15 audits of water entity performance reports. Our annual audit of the performance report of water entities provides an opinion on whether the actual results reported are presented fairly and in compliance with the legislative requirements. We do not form an opinion on the relevance and appropriateness of the reported performance indicators.
Conclusion
Last year's report Water Entities: Results of the 2013–14 Audits, highlighted that the performance reporting processes of the water entities were not as mature or developed as those for financial report preparation. This is again apparent for the 2014–15 reporting period.
Findings
Clear audit opinions were issued on 15 of the 19 performance reports for the 2014–15 reporting period, with four qualified opinions being issued to the metropolitan water entities. This arose because three of the financial performance indicators were impacted by the errors in the valuation of infrastructure assets in their financial reports.
Recommendations
- That water entities:
- enhance their performance reporting processes in regards to roles and responsibilities, data collection, quality assurance and report preparation
- critically assess and understand the requirements of the Ministerial Reporting Direction (MRD) 01 Performance Reportingto ensure its appropriate application in preparing their performance reports.
- That the Department of Environment, Land, Water & Planning conducts a more robust review of water entity draft corporate plans to detect any disparities to MRD 01 and undertake a comprehensive review of MRD 01 non-financial KPIs for consistency.
3.1 Introduction
This Part covers the results of the audits of the 2014–15 performance reports of the 19 water entities. Our annual audit of the performance report of water entities provides an opinion of whether the actual results reported are presented fairly and in compliance with the legislative requirements. We do not form an opinion on the relevance or appropriateness of the reported performance indicators.
3.2 Conclusion
Clear audit opinions were issued on 15 of the 19 performance reports for the 2014–15 reporting period, with four qualified opinions being issued to the metropolitan water entities as three of the financial performance indicators were impacted by errors identified in their financial reports, as highlighted in Part 1 of this report.
The Department of Environment, Land, Water & Planning (DELWP) responded to recommendations made in our Water Entities: Results of the 2013–14 Audits report regarding enhancements to the performance reporting framework by amending Ministerial Reporting Direction (MRD) 01 Performance Reporting to provide further clarity and guidance on the reporting requirements.
Further improvements are still required by the water entities to ensure full compliance with MRD 01.
3.3 Performance reporting framework
Financial Reporting Direction (FRD) 27C Presentation and Reporting of Performance Information was issued in May 2014 and requires all 19 water entities to prepare and have audited, performance reports.
An updated MRD 01 Performance Reporting was issued on 18 May 2015 pursuant to section 51 of the Financial Management Act 1994. MRD 01 supports the requirement under FRD 27C and specifies the format, content, and key performance indicators (KPI) that must be included in the performance reports of the 19 water entities.
The water entities are required to reflect the agreed KPIs as per MRD 01 in their corporate plans annually, which are submitted to DELWP for review and noting. The corporate plans must contain all KPIs, and targets are to be set for all indicators.
Figure 3A summarises the number and nature of indicators by water entity type.
Figure 3A
Key performance indicators by cohort
Water cohort |
Financial indicators |
Non-financial indicators |
Total |
|---|---|---|---|
Metropolitan |
|||
|
7 |
15 |
22 |
|
7 |
11 |
18 |
Regional urban |
7 |
11 |
18 |
Rural |
7 |
5 |
12 |
Source: Victorian Auditor-Generals Office.
Appendix E provides further detail on the financial and non-financial indicators for each entity type.
The 2013–14 reporting period was the first year where a consistent proforma and detailed guidance existed for each water entity via MRD 01.
Audit of performance statements
The Audit Act 1994 provides the Auditor-General with a mandate to audit performance indicators in the report of operations of an audited entity to determine whether they:
- are relevant to the stated objectives of the entity
- are appropriate for the assessment of the entity's actual performance
- fairly represent the entity's actual performance.
Our annual audit on the performance report of water entities is currently designed to form an opinion on whether the actual results reported are presented fairly and in compliance with the applicable legislative requirements. We do not form an opinion on the relevance and appropriateness of the reported performance indicators as they are set by Ministerial Direction.
3.4 Progress of the framework to 2014–15
In our report Water Entities: Results of the 2013–14 Audits, tabled in February 2015, we made the following recommendations to DELWP:
- enhance the guidance supporting MRD 01 to address issues encountered in 2013–14
- engage early with water entities to ensure that all applicable indicators—at an appropriate level of granularity—are included in the corporate plans of water entities.
Enhancing guidance in MRD 01
In responding to our 2013–14 report, DELWP recommended, and the minister subsequently released an improved MRD 01 in May 2015, clarifying its requirements and enhancing the guidance notes to assist the water entities with their performance report preparation.
The changes to MRD 01 included:
- providing definitions and explicit measurement requirements for each KPI
- clarifying the reporting of disaggregated performance targets for water and sewerage service performance indicators and the environmental performance indicators, where applicable
- providing additional guidance and direction to assist in calculating significant variances—including amending the requirements for presentation of variance results and introducing colour coding for favourable and unfavourable variance outcomes to assist the reader in understanding the nature of variances
- providing additional directives for the explanation of significant variances to assist the reader in understanding the nature of variances and future management of unfavourable variances
- examples of explanatory notes for variance explanations
- the requirement for the chief financial officer to certify the performance report.
Early engaging with water entities
DELWP engaged early with water entities about the revisions to MRD 01, including clarifying the applicable indicators and their level of granularity.
In 2014–15, however, disparities remained between the performance reports and corporate plans. Accordingly, we recommend DELWP conducts a more robust review of water entity draft corporate plans, to detect any disparities to the MRD 01 Performance Reporting.
3.5 Audit opinions
Clear audit opinions were issued on 15 of the 19 performance reports for the 2014–15 reporting period, with four qualified opinions issued to the metropolitan water entities as three of the financial performance indicators were impacted by errors identified in their financial reports.
Qualified audit opinions
As reported in Section 1.3.2 Performance audit opinions issued, the financial reports of the four metropolitan water entities contained errors in the fair value of infrastructure assets. Consequently, three of the financial performance indicators on the performance report—gearing ratio, return on assets and return on equity—were impacted by these errors, therefore the reported actual results for these indicators for the 2013–14 and 2014–15 were also in error.
Figure 3B summarises the estimated errors to the results of the four metropolitan water entities' performance indicators in their performance reports.
Figure 3B
Qualification of performance reports—metropolitan water entities
Entity |
Adjusted result |
Adjusted result |
Comment |
|---|---|---|---|
KPI F2: Gearing ratio—total debt (including finance leases) / total assets |
|||
City West Water |
53.10 |
51.90 |
Error impacted 'total assets' |
South East Water |
35.60 |
35.30 |
|
Yarra Valley Water |
48.76 |
49.26 |
|
Melbourne Water |
56.20 |
58.40 |
|
KPI F5: Return on assets—earnings before net interest and tax/average assets |
|||
City West Water |
5.00 |
5.60 |
Error impacted 'average assets' |
South East Water |
6.00 |
5.60 |
|
Yarra Valley Water |
4.66 |
4.82 |
|
Melbourne Water |
No change |
6.10 |
|
KPI F6: Return on equity—net profit after tax / average total equity |
|||
City West Water |
4.00 |
6.00 |
Error impacted 'average total equity' |
South East Water |
6.20 |
5.40 |
|
Yarra Valley Water |
3.50 |
4.21 |
|
Melbourne Water |
No change |
2.60 |
|
Source: Victorian Auditor-General's Office.
3.6 The quality of performance reporting
Performance reports are generally prepared and finalised in conjunction with financial reports. Our audit of the 2014–15 performance reports resulted in a number of audit findings to either enhance the quality of the draft reports, or to ensure compliance with MRD 01—common themes have been highlighted below.
Alignment to corporate plans
As per the requirements of MRD 01, all water entities were required to set performance targets for the predetermined KPIs in their corporate plans for the 2014–15 reporting period, unless the targets had been predetermined in the Essential Services Commission (ESC) Customer Service Code. The targets were to be reported in the performance reports.
Seven of the 19 water entities' performance reporting targets did not align to their corporate plans. These misalignments were due to:
- no target disclosed in the 2014–15 corporate plan and therefore the performance report target was determined from a separate calculation
- difference in the presentation of KPIs in the corporate plans compared to the requirements of MRD 01—for example, corporate plan displayed a KPI per 10000 customers whereas MRD 01 required disclosure per 1 000 customers
- calculation errors of KPI targets in corporate plans which were corrected in the performance report.
Of the seven water entities, six provided additional disclosure in their performance reports, explaining the variation in targets disclosed in the performance report compared to their 2014–15 corporate plan. One entity did not provide additional disclosure as the target was recorded in the ESC Customer Service Code, and therefore compliant with MRD 01.
Compliance with MRD 01
Key areas of noncompliance of draft performance reports with MRD 01 related to:
- calculations and variance presentation not aligning to the methodology in the MRD 01
- actual results not aligning to supporting documentation or containing errors
- where unfavourable variances were disclosed, there were insufficient explanatory notes detailing steps taken or planned to reduce unfavourable variances in the future as required by the MRD 01
- failure to apply, or applying incorrect colour coding of variances
- the requirement to have three responsible officers certifying the performance report
- deficiencies in the overall accuracy and quality of explanatory notes supporting significant variances
- delays in obtaining adequate supporting data and documentation for the actual results reported—in some instances there was no designated officer responsible for the overall production of the performance report or in charge of the maintenance and quality of underlying data
- five entities made corrections to some of their 2013–14 prior period actual performance results.
In summary
Our 2013–14 report highlighted the performance reporting processes of the water entities were not as mature or developed as those for financial report preparation. This is again apparent from the audit findings for the 2014–15 reporting period. Water entities need to place a greater focus on the processes used for performance reporting annually and ensure that their performance report is prepared fully in accordance with MRD 01. The early preparation of shell performance reports prior to year end could help reduce the number of deficiencies in draft performance reports and improve the efficiency of the year end reporting process.
Recommendations
- That water entities enhance their performance reporting processes to:
- designate a responsible officer for the overall preparation and production of the performance report
- maintain a central repository for collation of data used to support the performance report
- implement a formalised, independent quality review process over the preparation processes and presentation of the performance report
- prepare quality shell performance reports
- critically assess the requirements of Ministerial Reporting Direction (MRD) 01 Performance Reporting, including providing adequate training or guidance to staff preparing the performance reports.
4 Trends in debt management
At a glance
Background
In this Part we comment on the trend in borrowings and the extent of debt refinancing (rollover) across the water sector for the past five years. We also consider the risks to longer-term financial sustainability in light of current debt management practices.
Conclusion
Borrowings have increased in recent times for the delivery of major capital projects and to meet certain other payments, such as dividends. There has been and continues to be significant dependency on debt to finance capital projects, as water entities do not generate sufficient funds from operations to be able to undertake this investment. Over the past five years, of the $3.7 billion of loans maturing, $2.7 billion, or greater than 70 per cent, of these loans were not repaid—they have been rolled over. Longer-term financial sustainability risks exist for the sector if the sole source of funding capital projects continues to be predominantly from debt and the debt continues to be rolled over at similar rates.
Findings
- The level of borrowings in the water sector has increased by 29 per cent, from $8 billion in 2010–11 to $10.4 billion in 2014–15. The metropolitan cohort holds 80 per cent of the total debt portfolio.
- Three metropolitan retail and five regional urban water entities did not repay any debt across the five-year trend period.
- Borrowings are expected to increase by an additional 19 per cent to 2018–19, based on the 2014–15 corporate plans.
- Only three water entities had formal debt management plans or strategies.
Recommendation
That water entities establish a dedicated strategy or plan that maps out the intentions of debt management and usage over the medium and longer-term.
4.1 Introduction
Water entities source their borrowings from the Treasury Corporation of Victoria (TCV). Over the past five years the level of borrowings—excluding finance lease arrangements—in the Victorian water sector increased by 29 per cent, from $8 billion in 2010–11 to $10.4 billion in 2014–15.
For further historical context, total borrowings have increased significantly in the sector, beyond the trend period explored in this Part—in 2006–07, total debt for the sector was just $3.2 billion.
In this Part we comment on the trend in borrowings and the extent of debt refinancing (rollover) across the 19 water entities for the past five years—the trend period. We also consider the risks to longer-term financial sustainability in light of current debt management practices.
4.2 Conclusions
Borrowings have increased in recent times for the delivery of major capital projects and to meet certain other payments such as dividend payments. There has been, and continues to be significant dependency on debt to finance capital projects, as water entities do not generate sufficient funds from operations to be able to fund this investment.
Over the past five years, of the $3.7 billion of loans maturing, $2.7 billion have not been repaid—they have been rolled over. Eight entities across the sector did not repay any debt—of which three are the metropolitan water retailers and the remainder, regional urban water entities.
Funding capital projects from debt is an appropriate mechanism, particularly when the funds are used to construct larger scale assets with extended useful lives, as costs associated with the assets are spread across future generations. However, longer-term financial risks exist for the sector if the sole source of funding capital continues to be predominantly from debt and the debt continues to be rolled over at similar rates.
4.3 Debt management in the public sector
The Victorian Government's overall debt management objectives for the state—as set out in the Treasury Management Guidelines (the Guidelines)—are:
- ensure the state's net debt is maintained at a prudent level
- ensure access to financial markets
- minimise borrowing costs
- manage effectively the state's financial risks.
The state responds to its financial risks by managing funding and financial market risks centrally within TCV, which has strategic and other benefits for the state.
The Borrowing and Investment Powers Act 1987 (the Act) allows borrowing and investment powers to be granted to relevant public sector entities. The Guidelines released by the Department of Treasury & Finance (DTF) establish the policies and procedures that are to be observed by those public sector entities.
4.3.1 Borrowing and Investment Powers Act 1987
The purpose of the Act is to provide specific public sector entities with the power to borrow and invest in a wide range of financial products and to access the financial arrangements required to effectively manage their debt and investment portfolios.
There are a range of powers available under the Act, including:
- the use of overdraft facilities
- financial accommodation—for example, borrowings
- finance leases
- financing arrangements, such as derivatives
- investments.
The 19 water entities have been granted powers under the Act relating to financial accommodation and use of overdraft facilities, subject to the approval of the Treasurer. The powers granted by the Treasurer are customised based on the needs of entities, after considering their operations and current financial condition. All financial accommodation is transacted by TCV, whose liabilities are guaranteed by the state.
Annual cycle of accessing borrowings
The Act operates on an annual cycle, as can be seen in Figure 4A.
Figure 4A
Borrowing power annual cycle
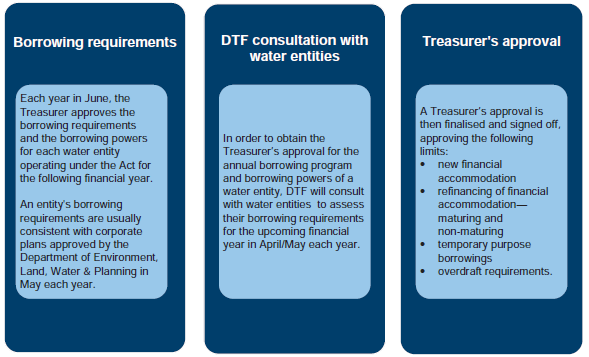
Source: Victorian Auditor-General's Office.
Borrowing approvals will be given on the understanding that any debt repayments specified in the borrowing approval request will be achieved.
4.3.2 Treasury management guidelines
The key requirements of treasury management in the Victorian public sector are detailed in the Guidelines. The purpose of the Guidelines is to set a framework to guide relevant entities to appropriately develop and manage their treasury management function.
Entities with loan borrowings equal to or greater than $20 million—deemed major government business enterprises (GBEs)— are expected to develop a business specific treasury policy document. Smaller GBEs—borrowings below $20 million—are given an option to adopt their own specific treasury policies approved by their board or alternatively operate within the requirements of the Guidelines. Of the 19 water entities, two water entities fall below this threshold.
Borrowings used by the water entities are mostly interest-only loans, where the total principal is due when a loan matures. Water entities incur not only interest expenses when borrowing loan funds, but also incur a financial accommodation levy (FAL) which is required to be paid to DTF.
4.3.3 Roles and responsibilities of entities
Department of Treasury & Finance
DTF is responsible for ensuring that the state's objectives are achieved by setting the Guidelines and recommending borrowing and investment powers to apply to water entities. DTF is also responsible for providing advice to the Treasurer in relation to treasury management issues affecting the state, including making recommendations in relation to the borrowing and investment powers of GBEs, such as the water entities.
Treasury Corporation of Victoria
TCV is responsible for ensuring that the state's funding and other financial market requirements are achieved and to provide financial products and other services which meet the funding and risk management needs of public sector entities.
Water entities
The boards of water entities are responsible for determining their own funding needs and managing the risks associated with their business.
4.4 Debt trends—water sector
Water entities have increased their debt in recent times due to the required level of capital investment to renew or replace assets, and in some instances, to meet other obligations such as dividend payments.
More specifically, capital investment increased for the regional urban cohort and the industry as a whole in the last regulatory period, due to water shortages experienced from drought conditions. Other significant capital projects across the sector also drove the increase.
Funding capital projects from debt is an appropriate mechanism, particularly when the funds are used to construct larger-scale assets with extended useful lives, as costs associated with the assets are spread across future generations.
Water entities have approval to rollover (refinance) their maturing debt and in recent years have done so. While entities have this approval, they need to consider their ability to generate sufficient cash flows from operations to service their debt—meeting interest and FAL payments—commence repaying existing debt where financially feasible, and consider financially prudent options for the future funding of capital investments.
4.4.1 Debt trend dashboard—Victorian water sector
Figure 4B provides a snapshot of the Victorian water industry's related debt trends over the past five years—including the debt position, costs to service debt, maturity profile, available financial accommodation, gearing and annual rates of repayment or debt rollover to maturing loans.
Figure 4B
Water sector debt position
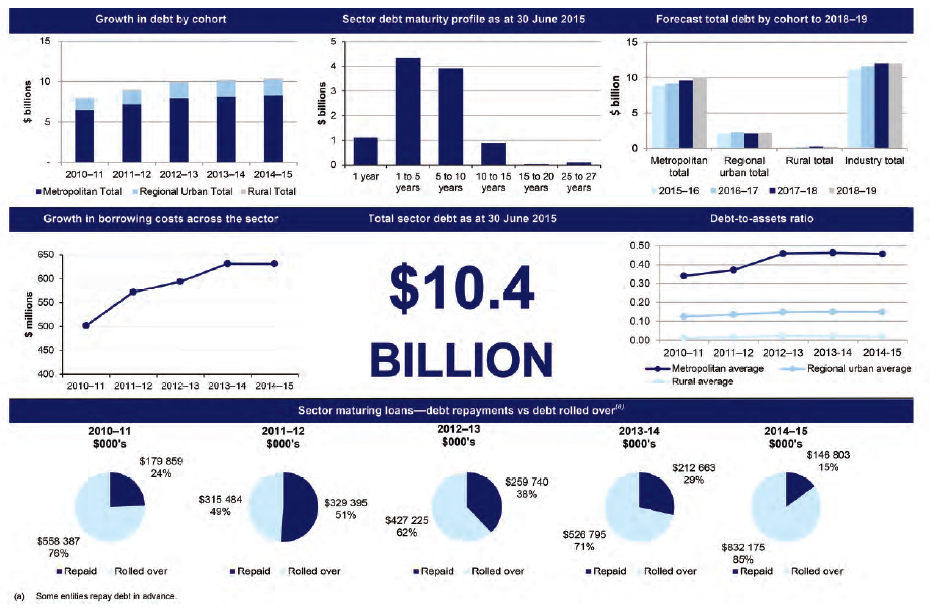
Source: Victorian Auditor-General's Office.
Whole of sector
Currently, the Victorian water sector debt represents 25 per cent of the state's overall borrowings. Over the past five years the level of borrowings in the sector has increased by 29.3 per cent, from $8 billion in 2010–11 to $10.4 billion in 2014–15.
The metropolitan water cohort is the largest contributor—holding 80 per cent of the total debt portfolio, and contributing to $5.4 billion of the $7.1 billion increase in debt since 2006–07.
Borrowings increased for the delivery of major capital projects in recent times, particularly due to drought conditions from 2006–07 to 2008–09 and to meet other costs.
The outstanding debt profile of the sector (debt maturity profile) ranges from one year through to 27 years, as can be seen in Figure 4B. Almost $1.1 billion is expected to mature within the next 12 months, $4.3 billion within the next one to five years, $3.9 billion in the next five to 10 years, $895.9 million in 10 to 15 years and approximately $128.2 million in excess of 15 years.
The average rate of repayment—largely for maturing loans—across the trend period is 29 per cent, or $1.0 billion. The average debt rolled over was 73 per cent, or $2.7 billion. Rollovers are a result of water entities either not having the financial capacity to repay debt or applying a specific strategy to manage their debt—certain entities have considered market conditions and the structure of their loan portfolio in making the decisions to roll over. In an environment of low interest rates, it is reasonable for rollovers to occur.
The sector incurred $631.3 million in interest and FAL for 2014–15, an increase of $129.6 million since the 2010–11 reporting period costs of $501.7 million. The average interest rate on loans since 2010–11 has reduced from 5.91 per cent to 4.86 per cent, indicative of market conditions.
The 'debt-to-total assets' indicator is a gearing ratio (refer to Part 2 of this report) that considers the total amount of debt relative to the assets held by an entity. The average debt-to-asset ratio across the sector in 2010–11 was quite low at 0.16, growing to 0.20 in 2014–15. The sector has maintained a combined adequate level of gearing, driven by the nature and significant value of the sectors' asset base (infrastructure assets under a fair value model).
When analysing the 2014–15 corporate plans—which are unaudited—the level of borrowings for the sector is forecast to increase by 19 per cent over the period to 2018–19, predominantly driven by the metropolitan water entities.
Metropolitan cohort
Growth in debt and the debt maturity profile
Total borrowings for the metropolitan cohort have grown from $6.5 billion in 2010–11 to $8.3 billion in 2014–15, an increase of 28 per cent—this excludes the finance lease liability relating to the desalination plant.
Melbourne Water holds 47 per cent of the total debt balance for the metropolitan cohort, with the remainder held by the metropolitan retailers—Yarra Valley Water at 24 per cent, South East Water at 16 per cent and City West Water at 13 per cent.
The average loan balance held by the metropolitan water retailers over the past five years has grown from $961.8 million in 2010–11 to $1 463.3 million in 2014–15. Melbourne Water has held an average loan balance of $3.9 billion across the trend period.
The significant growth in debt is attributable to major capital projects for Melbourne Water, such as the Sugarloaf Pipeline and the Northern Sewer Project. Growth for the metropolitan water retailers has occurred to develop water and sewer infrastructure to service growth in the respective regions and infrastructure renewal. Over the trend period, borrowings have also been used to meet statutory obligations of the state, such as dividends, and to meet operational expenditure when cash-flow issues have arisen.
The Guidelines provide a recommended debt portfolio composition, to manage interest rate and liquidity risks. The current maturity profile of the metropolitan cohort is spread across a 15-year period as shown in Figure 4C.
Figure 4C
Debt balances outstanding at 30 June 2015 (maturity profile)
|
1 year ($ mil) |
1 to 5 years ($ mil) |
5 to 10 years ($ mil) |
10 to 15 years ($ mil) |
|
|---|---|---|---|---|
|
Metropolitan cohort |
888.5 |
3 667.2 |
3 156.1 |
570.0 |
Source: Victorian Auditor-General's Office.
Maturing loans—debt repayments vs debt rolled over
Over the past five years, the average rate of debt repayment for the metropolitan water cohort was 34 per cent, with approximately 66 per cent of debt being rolled over at maturity. The repayment of debt has only occurred at one entity in the cohort, Melbourne Water. No metropolitan retail water entity has repaid maturing loans over the five-year trend period.
In dollar terms, the cohort has rolled over $2 billion of their maturing debt, where Melbourne Water has been the only entity with capacity to repay debt, at $925 million, across the trend period.
Growth in borrowing costs
Total costs of servicing debt—interest expense and the FAL—for the metropolitan cohort has grown by 22 per cent over the trend period. In 2010–11, metropolitan water entities incurred a combined cost of $407.3 million, growing to $498.9 million in 2014–15. The average interest and FAL expense incurred by water entities in this cohort was $101.8 million in 2010–11, growing to approximately $124.7 million in 2014–15.
Debt to assets—gearing
The average debt-to-asset ratio across the metropolitan cohort in 2010–11 was 0.34, growing to 0.46 in 2014–15. On average, the sector has maintained an adequate level of gearing, however, Melbourne Water experienced a large increase in the ratio in 2012–13 due to the recognition of the desalination plant assets.
Forecast debt by cohort to 2018–19—analysis from the 2014–15 corporate plans
When assessing risks to longer-term financial sustainability, it is imperative to not only consider existing debt trends, but to also consider future expectations—the extent of future dependency on debt and plans to manage debt.
From analysis of the 2014–15 corporate plans, which forecast out to 2018–19, the metropolitan water retailers' borrowings are projected to increase by 17 per cent, from $4.8 billion in 2015–16 to $5.6 billion in 2018–19. The increase in debt is required to fund the capital expenditure programs and to meet dividend and tax payments.
Melbourne Water forecast a smaller increase of 8 per cent—$4.4 billion by 2018–19.
Figure 4D
Future expectations of total borrowings—metropolitan cohort
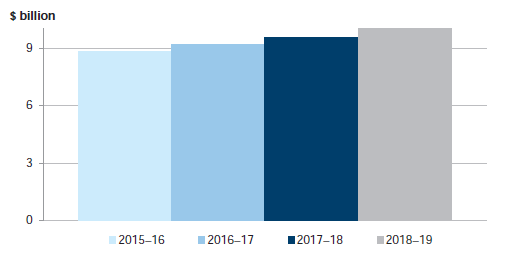
Note: Data in this graph is unaudited data taken from the 2014–15 corporate plans.
Source: Victorian Auditor-General's Office.
Regional urban water cohort
Growth in debt and the maturity profile
Total debt for the regional urban cohort has grown from $1.4 billion in 2010–11 to $2.0 billion in 2014–15, or 43 per cent.
The average loan balance held across the 13 regional urban water entities over the trend period has grown from $110.1 million in 2010–11 to $151.1 million in 2014–15.
The significant growth is attributable to major capital investment largely a result of drought conditions, particularly during the 2006–07 to 2008–09 period. The current maturity profile of the regional urban cohort is spread across a 27-year period as shown in Figure 4E.
Figure 4E
Debt balances outstanding at 30 June 2015 (maturity profile)
|
1 year |
1 to 5 years ($ mil) |
5 to 10 years ($ mil) |
10 to 15 years ($ mil) |
15 to 20 years ($ mil) |
25 to 27 years ($ mil) |
|
|---|---|---|---|---|---|---|
|
Regional urban cohort |
206.7 |
656.1 |
711.1 |
318.4 |
35.0 |
37.3 |
Source: Victorian Auditor-General's Office.
Case Study—Significant growth in debt, Coliban Water
Figure 4F is an illustration of the evolution of debt for a regional urban water entity, Coliban Water.
Figure 4F
Evolution of debt—Coliban Water
|
Severe drought conditions impacting North-Central Victoria gave rise to a number of significant capital works projects by Coliban Water. Between 2006–07 and 2008–09, Coliban Water invested a total $241.4 million on capital works which were driven by drought mitigation projects including the acquisition of permanent and temporary water entitlements and making a contribution to the Goldfields Superpipe in order to secure the region's water supplies. Under the regulatory pricing regime Coliban Water had limited capacity to fund the significant capital works with operating cash flows, and therefore relied on borrowings in 2006–07—this increased to $220 million in 2009–10. Prior to this period, Coliban Water did not have debt. Changes to the core operations of Coliban Water brought about by the severe drought conditions and its dependency on borrowings culminated in poor financial results. From 2006–07 to 2009–10, the entity reported net deficits from operations, as well as negative cash flows from operating activities. Coliban Water was also not able to adequately service its interest payments on borrowings from its operating cash flows—consequently proceeds from borrowings were not only being used for capital purposes, but also to support its operating activities, including servicing debt. In 2010, a standalone treasury management policy was developed in consultation with DTF, and monthly reporting on its borrowings provided the board with a snapshot of the corporation's debt maturities and its ongoing compliance with its treasury management policy. In addition, the board's commitment to managing its debt was further evidenced by recognising debt management as a strategic risk to the entity, in its risk register, which was actively monitored. Coliban Water also worked closely with TCV who assisted in restructuring the debt portfolio—restructuring its debt maturity profiles in an even fashion to spread the refinancing risks and consolidating debt into parcels of between $2 million and $5 million as and when debt profiles allow. The concerted effort by the board to more actively manage its debt profile has seen Coliban Water's reliance on debt slowly decrease, with annual increases in borrowings from 2009–10 to 2014–15 reducing from 24 per cent to 3 per cent respectively. Coliban Water's intention, as outlined in its 2015–16 Corporate Plan, is to align its borrowings maturity profile with its asset renewal profile, with the express intention to commence repaying debt each year in accordance with its asset renewal profile. Coliban Water has planned to peak its borrowings in 2015–16 at a level of $387.8 million and to commence the repayment of debt in 2016–17 of $7.5 million. |
Source: Victorian Auditor-General's Office.
Maturing loans—debt repayments vs debt rolled over
Over the past five years, the average rate of debt repayment for the regional urban cohort was 21 per cent, with approximately 86 per cent of debt being rolled over at maturity. The combined repayment and rollover rates exceed 100 per cent as certain entities have repaid loans in advance.
In dollar terms, the regional urban cohort has rolled over $613 million of its maturing debt, and only has the capacity to repay $159 million of its debt. Of the 13 regional urban water entities, eight entities have shown capacity to repay some debt across the trend period, leaving five that have not.
Growth in borrowing costs
The total cost of servicing debt for the regional urban cohort has grown in the same fashion as the debt balance. In 2010–11 regional urban water entities incurred a combined borrowing cost of $90.7 million, growing to $123.3 million in 2014–15.
The average interest and FAL expense incurred by regional urban water entities was $6.9 million in 2010–11, growing to approximately $9.5 million in 2014–15.
Debt to assets—gearing
The average debt-to-asset ratio across the regional urban water cohort in 2010–11 was quite low at 0.13 growing to 0.15 in 2014–15.
Forecast debt by cohort to 2018–19—analysis from the 2014–15 corporate plans
From analysis of the 2014–15 corporate plans, which forecast out to 2018–19, borrowings are expected to increase by 4.5 per cent, from $2.1 billion in 2015–16 to $2.2 billion in 2018–19, in order to fund the respective entities capital expenditure programs, as can be seen in Figure 4G.
Figure 4G
Future expectations of total borrowings– regional urban cohort
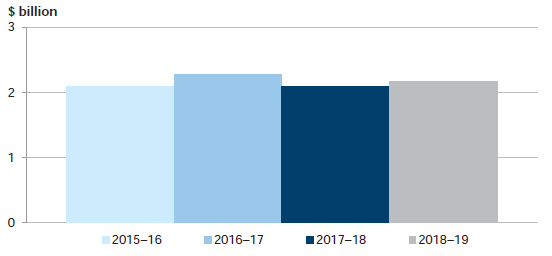
Note: Data in this graph is unaudited data taken from the 2014–15 corporate plans.
Source: Victorian Auditor-General's Office.
Rural sector
The rural water cohort consists of two water entities that do not hold a substantial portion of debt. At 30 June 2015 the cohort collectively held $134.1 million in debt, with borrowing costs of $4.5 million in 2014–15. The debt position has increased over the trend period, from $99.7 million in 2010–11 or by 35 per cent.
These entities have shown a strong capacity to repay debt, including being able to repay debt in advance of maturity. Both entities within the cohort have a responsibility to deliver significant capital projects, predominantly funded by the state and Commonwealth governments.
4.4.2 Longer-term risks to debt management
There has been and continues to be significant reliance on financing capital projects through debt in the metropolitan and regional urban cohorts, as water entities do not generate sufficient funds from operations to fully fund this investment.
A longer-term financial risk exists for the state if the primary source of funding capital projects is derived from debt which continues to be rolled over—not repaid.
The longer-term financial sustainability risks of water entities will be adversely impacted if debt management strategies employed by those entities are not sustainable and supported by a formal debt management plan or strategy.
Given the longer-term risks posed for the sector, as part of our analysis to water entity debt management, we considered:
- debt management plans or strategies established at each water entity
- debt management or financial sustainability risks identified and reflected in entities' risk registers.
Debt management strategies
Of the 19 water entities, three had formal debt management strategies or plans. Two of these plans focused on reducing the overall level of debt held by the entity, and included debt forecasts, noting consideration of alternative funding sources to finance capital investment—i.e. use of surplus funds from operations. The other plan focused on maintaining debt at an 'acceptable' risk level.
The overarching objectives of these three plans aligned with the overall objectives of each entity's respective corporate plan for 2014–15. It is noted that all of these entities have shown the capacity to repay debt over the past five years and the entities' debt forecasts directly correlate with their planned capital investment—on average both aspects are decreasing.
For the remainder of the sector, no other entity had a formal debt management strategy or plan. Elements of debt management objectives or plans were captured within other corporate documents such as the 2014–15 corporate plans and treasury management policies.
There is no mandatory requirement for a water entity to have a separate debt management strategy, however, given the financial impact and longer-term risk debt has on water entities, we recommend that water entity management and boards have in place a dedicated document that maps out the intentions of debt management and usage over the medium and longer term. The plan should also comment on the appropriate mix of financing capital investment through debt or funds from other sources—i.e. operations or government—while maintaining core service obligations.
Such a plan will be key in educating newly appointed boards on the financial risks associated with existing debt portfolios, and plans to implement ongoing responsible debt management strategies, which will assist water entities' longer-term sustainability.
Risk registers
Analysis of the 19 risk registers shows all entities, with the exception of one, included risks associated with longer-term debt management and its impact on financial sustainability. Figure 4H shows the risks raised by rating and theme.
Figure 4H
Risk register analysis—risks associated with debt management
|
Risk rating (inherent) |
|||||
|---|---|---|---|---|---|
|
Risk theme |
Extreme |
High |
Medium |
Low |
N/A(a) |
|
Debt management |
1 |
1 |
2 |
1 |
1 |
|
Interest rate volatility |
– |
1 |
2 |
– |
– |
|
Cash flow/liquidity |
1 |
3 |
3 |
– |
– |
|
Financial sustainability |
3 |
4 |
– |
– |
– |
|
Treasury management |
1 |
– |
1 |
– |
2 |
(a) Risk register did not contain an inherent risk rating.
Note: 18 of the 19 water entities' risk registers contained risks relating to debt management. Some water entities raised more than one risk relating to these themes.
Source: Victorian Auditor-General's Office.
The ratings across the registers are quite diverse—from extreme to low—however, this appears to be driven by the quantum of debt the entity has.
- Key mitigating controls or procedures identified against these risks included:
- the corporate planning process
- development of the treasury management policy
- regular reporting to those charged with governance
- cash-flow forecasting and budgets functions within the organisations.
It is a positive sign that water entities have identified debt management or the associated longer-term financial sustainability risks in their risk registers; however, the mitigation strategies in most cases are at a high level and not as specific to the management of debt as they could be. This would be aided by development of a medium to longer-term debt management strategy.
Recommendation
- That water entities establish a dedicated debt management strategy or plan that maps out their approach to debt management and usage over the medium and longer term.
Appendix A. Water entity list
Figure A1 lists the legal and trading names of the 21 entities including two controlled entities that form part of the Victorian water industry.
Figure A1
Water entities and controlled entities
Legal name |
Trading name |
|---|---|
Metropolitan cohort |
|
Wholesaler Melbourne Water Corporation |
Melbourne Water |
Retailers City West Water Corporation South East Water Corporation Yarra Valley Water Corporation |
City West Water South East Water Yarra Valley Water |
iota Services Pty Ltd (subsidiary of South East Water Corporation) |
iota |
Regional urban cohort |
|
Barwon Region Water Corporation |
Barwon Water |
Central Gippsland Region Water Corporation |
Gippsland Water |
Central Highlands Region Water Corporation |
Central Highlands Water |
Coliban Region Water Corporation |
Coliban Water |
East Gippsland Region Water Corporation |
East Gippsland Water |
Goulburn Valley Region Water Corporation |
Goulburn Valley Water |
Grampians Wimmera Mallee Water Corporation |
GWMWater |
Lower Murray Urban and Rural Water Corporation |
Lower Murray Water |
North East Region Water Corporation |
North East Water |
South Gippsland Region Water Corporation |
South Gippsland Water |
Wannon Region Water Corporation |
Wannon Water |
Western Region Water Corporation |
Western Water |
Westernport Region Water Corporation |
Westernport Water |
Rural cohort |
|
Gippsland and Southern Rural Water Corporation |
Southern Rural Water |
Goulburn-Murray Rural Water Corporation |
Goulburn-Murray Water |
Watermove Pty Ltd (subsidiary of Goulburn-Murray Rural Water Corporation) |
Watermove |
Source: Victorian Auditor-General's Office.
Controlled entities
iota Services Pty Ltd
iota Services Pty Ltd (iota) is a wholly-owned subsidiary of South East Water, incorporated on 29 October 2014 under the Corporations Act 2001 and commenced trading on 1 January 2015. The then Minister for Water approved the establishment of iota under the provisions of the Water Act 1989.
iota is responsible for the profitable commercialisation of South East Water's innovations, products and services.
The entity is consolidated into the financial report of South East Water, as per the requirements of AASB 10 Consolidated Financial Statements. As the entity is consolidated, the results of that audit are addressed throughout this report as part of the South East Water results.
For the 2014–15 reporting period, a financial report was prepared and audited, where an unqualified audit opinion was issued.
Watermove
Watermove is a controlled entity of Goulburn-Murray Water. At a board meeting on 10 August 2012, the directors of Watermove resolved to discontinue the operations of the company. Watermove ceased trading on 13 August 2012.
During the 2014–15 financial year, Watermove existed as a legal entity under the ownership of Goulburn-Murray Water and did not actively trade. As a result, a 2014–15 financial report is required to be prepared, however, at the date of this report, the financial report has not been finalised.
As the entity no longer actively trades, no comment on the results of that audit are addressed in this report. On 1 July 2015 the company was deregistered.
Appendix B. Management letter risk ratings
Figure B1 shows the risk ratings applied to management letter points raised during an audit.
Figure B1
Risk definitions applied to issues reported in audit management letters
Rating |
Definition |
Management action required |
|---|---|---|
Extreme |
The issue represents:
|
Requires immediate management intervention with a detailed action plan to be implemented within one month. Requires executive management to correct the material misstatement in the financial report as a matter of urgency to avoid a modified audit opinion. |
High |
The issue represents:
|
Requires prompt management intervention with a detailed action plan implemented within two months. Requires executive management to correct the material misstatement in the financial report to avoid a modified audit opinion. |
Medium |
The issue represents:
|
Requires management intervention with a detailed action plan implemented within three to six months. |
Low |
The issue represents:
|
Requires management intervention with a detailed action plan implemented within six to 12 months. |
Source: Victorian-Auditor General's Office.
Appendix C. Risks to financial sustainability
Financial sustainability risk assessment indicators
This Appendix sets out the definitions, criteria and changes made to the financial indicators applied in this report from prior years that assist us in conducting our assessment of risks to financial sustainability across the water sector.
The financial sustainability indicators used in this report are indicative and merely highlight risks to ongoing financial sustainability at a sector and cohort level—metropolitan, regional urban and rural.
It is important to note that forming a definitive view of financial sustainability requires a holistic analysis that moves beyond historical financial considerations to also include consideration of financial forecasts and plans, operations and an entity's environment, particularly the regulatory environment within which these water entities operate.
Figure C1 shows the indicators used in assessing the financial sustainability risks of entities covered by this report. These indicators should be considered collectively, and are more useful when assessed over time as part of a trend analysis.
Figure C1
Financial sustainability risk assessment indicators
Indicator |
Formula |
Description |
|---|---|---|
Net result (%) |
Net result / Total revenue |
A positive result indicates a surplus, and the larger the percentage, the stronger the result. A negative result indicates a deficit. Operating deficits cannot be sustained in the long term. Net result and total revenue are obtained from the comprehensive operating statement. |
Liquidity (ratio) |
Current assets / Current liabilities |
This measures the ability of an entity to pay existing liabilities in the next 12 months. A ratio of one or more means there are more cash and liquid assets than short-term liabilities. Current assets and current liabilities are obtained from the balance sheet. |
Internal financing (%) |
Net operating cash flow / Net capital expenditure |
This measures the ability of an entity to finance capital works generated from operating cash flows. The higher the percentage, the greater the ability for the entity to finance capital works from their own funds. This indicator is taken directly from the water entities published performance reports. |
Capital replacement (ratio) |
Cash outflows for property, plant and equipment / Depreciation |
Comparison of the rate of spending on infrastructure with its depreciation. Ratios higher than 1:1 indicate that spending is faster than the depreciating rate. This is a long-term indicator, as capital expenditure can be deferred in the short term if there are insufficient funds available from operations, and borrowing is not an option. Cash outflows for property, plant and equipment are taken from the cash flow statement. Depreciation is taken from the comprehensive operating statement. |
Interest cover |
Net operating cash flows before net interest and tax payments / Net interest payments |
This measures an entity's ability to meet ongoing interest payments and ability to service debt. Net operating cash flows and net interest and tax payments are obtained from the cash flow statement. |
Debt service cover |
Profit plus interest, depreciation and amortisation / Total interest, debt repayments and finance lease repayments |
This measures the ability of an entity to repay its debt (includes finance lease arrangements) from operating profits. Profit (i.e. net result), interest, depreciation and amortisation are taken from the comprehensive operating statement. Total interest, debt repayments and finance lease repayments are taken from the cash flow statement (net of any gross up rollover/refinancing impacts). Where any entity has not made an actual repayment of their debt, this indicator will result in a ìN/Aî outcome. |
Debt-to-assets |
Debt / Total assets |
This is a longer-term measure that compares all current and non-current interest bearing liabilities to total assets. It complements the liquidity ratio which is a short‑term measure. A low ratio indicates less reliance on debt to finance the assets of an organisation. Balances are obtained from the balance sheet. |
The financial sustainability of each water entity has been assessed using the risk criteria outlined in Figure C2.
Figure C2
Financial sustainability risk indicators
– risk assessment criteria
Risk |
Net result (%) |
Liquidity (ratio)(a) |
Internal financing (%) (b) |
Capital replacement (ratio) |
Interest cover |
Debt service cover |
Debt-to-assets |
|---|---|---|---|---|---|---|---|
High |
Negative 10% or greater |
Less than 0.75 |
Less than 10% |
Less than 1.0 |
Less than 1.0 |
Less than 0.9 |
More than 1.0 |
Insufficient revenue is being generated to fund operations and asset renewal. |
Immediate sustainability issues with insufficient current assets to cover liabilities. |
Limited cash generated from operations to fund new assets and asset renewal. |
Spending on capital works has not kept pace with consumption of assets. |
Insufficient interest cover to meet ongoing interest payments. |
Insufficient operating profit to meet debt and interest repayments. |
Long-term risk over ability to repay debt. |
|
Medium |
Negative 10%–0% |
0.75–1.0 |
10–35% |
1.0–1.5 |
1.0–2.0 |
0.9–1.0 |
0.5–1.0 |
A risk of long‑term run down of cash reserves and inability to fund asset renewals. |
Need for caution with cash flow, as issues could arise with meeting obligations as they fall due. |
May not be generating sufficient cash from operations to fund new assets and asset renewal. |
May indicate spending on asset renewal is insufficient. |
May not be able to service debt as interest payments fall due. |
May indicate risks over the ability to repay debt. |
May indicate risks over the ability to repay the debt. |
|
Low |
More than 0% |
More than 1.0 |
More than 35% |
More than 1.5 |
More than 2.0 |
More than 1.0 |
Less than 0.5 |
Generating surpluses consistently. |
No immediate risks with repaying short-term liabilities as they fall due. |
Generating enough cash from operations to fund new assets and asset renewal. |
Low risk of insufficient spending on asset renewal. |
Low risk of debt servicing issues. |
Low risk over ability to repay debt. |
Low risk over repaying debt from own source revenue. |
(a) Criteria
has been adjusted from the prior year to ensure consistency across the four
sector 'snapshot reports'—in prior year high risk was less than 0.70, medium
risk was 0.70–1.0 and low risk was more than 1.0.
(b) This
is a new indicator for 2014–15.
Source: Victorian
Auditor-General's Office.
Financial sustainability risk assessment reporting changes
The presentation of our financial sustainability risk assessment for the 2014–15 report has changed compared to prior year reports.
The driver for these changes has been to place a greater focus on a high-level 'snap shot' of the water industry financial sustainability risk position, to then only report on any significant or key outcomes.
As a result, this report has moved away from disclosing the following:
- an overall financial sustainability risk rating for each entity
- the former Appendix listing individual entity financial sustainability risks.
Instead, a financial sustainability risk indicator 'dashboard' has been captured in Part 2.4 Risks to financial sustainability, to assist with summarising sustainability risk results on a whole-sector level and cohort level.
In addition, commentary following the 'dashboard' highlights this report's focus on only examining key areas, as opposed to the traditional indicator-by-indicator analysis performed in past reports.
Financial sustainability risk assessment indicator changes
We also conducted a review of the financial sustainability risk indicators used in our risks to financial sustainability assessments.
For the 2014–15 report, we have identified four core indicators that are being used in all four 2014–15 audit sector 'snapshot reports'. These four core indicators—net result percentage, liquidity ratio, internal financing percentage and capital replacement ratio.
In addition to these four core indicators, another three water-entity specific indicators have been selected for reporting—interest cover, debt service cover and debt-to-assets ratio. Figure C1 contains further details of the description and calculation of all ratios reported on.
It is important to also note that all indicators used in our assessments are now directly calculated from financial transactions and balances reported as per published financial reports or performance reports of the water entities—no adjustments have been made to these figures—this is to ensure consistency among entities within the sector and across sector reports.
A summary of changes to the financial sustainability risk indicators is shown in Figure C3.
Figure C3
Changes to financial sustainability risk indicators, 2014–15
Indicator from prior reports |
Indicator type |
Changed |
Removed |
Replaced with |
|---|---|---|---|---|
Underlying result |
Core |
Yes |
Yes |
Net result(a) |
Liquidity |
Core |
Yes(b) |
No |
– |
Self-financing |
Core |
Yes |
Yes |
Internal financing ratio(c) |
Capital replacement |
Core |
No |
– |
– |
Interest cover |
Sector specific |
No |
– |
– |
Debt to assets |
Sector specific |
No |
– |
– |
Debt service cover |
Sector specific |
No(d) |
– |
– |
(a) Taken
directly from the comprehensive operating statement of published financial
reports.
(b) Modification
to the liquidity calculation. For the revised calculation, no
adjustments/exclusions are made when determining current assets and current
liabilities.
(c) Taken
directly from the reported ratio on the published performance reports.
(d) Modification to
the previous ratio. For the revised calculation, if an entity has not made an
actual repayment of their debt, the ratio will result in an 'NA'. Please note,
some cash flow statements gross up repayments and proceeds of debt, taking into
account rollover/ refinancing of debt impacts. This impact has been disregarded
when determining a result for this indicator.
Source: Victorian
Auditor-General's Office.
Appendix D. Acronyms and glossary
Acronyms
AAS Australian Auditing Standard
AASB Australian Accounting Standards Board
CMA Catchment Management Authority
DELWP Department of Environment, Land, Water & Planning
DTF Department of Treasury & Finance
ESC Essential Services Commission
FAL Financial Accommodation Levy
FMA Financial Management Act 1994
FRD Financial Reporting Direction
MRD Ministerial Reporting Direction
NTER National Tax Equivalent Regime
RAV Regulatory Asset Value
REV Regulatory Expenditure Value
SAV Statutory Asset Value
SEV Statutory Expenditure Value
TCV Treasury Corporation of Victoria
VAGO Victorian Auditor-General's Office
VCAT Victorian Civil and Administrative Tribunal
VGV Valuer-General Victoria
WACC Weighted Average Cost of Capital
WIRO Water Industry Regulatory Order
Glossary
Accountability
Responsibility of public sector entities to achieve their objectives, with regard to reliability of financial reporting, effectiveness and efficiency of operations, compliance with applicable laws, and reporting to interested parties.
Amortisation
The systematic allocation of the depreciable amount of an intangible asset over its expected useful life.
Asset
A resource controlled by an entity as a result of past events, and from which future economic benefits are expected to flow to the entity.
Asset useful life
The period over which an asset is expected to provide the entity with economic benefits. Depending on the nature of the asset, the useful life can be expressed in terms of time or output.
Asset valuation
The fair value of a non-current asset on a specified date.
Audit Act 1994
The Audit Act 1994 establishes the operating powers and responsibilities of the Auditor-General. This includes the operations of his office, the Victorian Auditor‑General's Office (VAGO), as well as the nature and scope of audits conducted by VAGO.
Audit committee
Assists a governing board to fulfil its governance and oversight responsibilities, and strengthen accountability of senior management.
Auditor's opinion
Written expression within a specified framework indicating the auditor's overall conclusion on the fair presentation of the financial (and performance) report based on audit evidence obtained.
Catchment Management Authority
A body established under the Catchment and Land Protection Act 1994 that have management powers over regional waterways, floodplains, drainage and environmental water.
Capital expenditure
Amount capitalised to the balance sheet for contributions by a public sector entity to major assets owned by the entity, including expenditure on:
- capital renewal of existing assets that returns the service potential or the life of the asset
- new assets, including buildings, infrastructure, plant and equipment.
Clear audit opinion—financial report
A positive written expression provided when the financial report has been prepared and presents fairly the transactions and balances for the reporting period in accordance with the requirements of the relevant legislation and Australian Accounting Standards.
Clear audit opinion—performance report
A positive written expression provided when the performance report has been prepared and presents fairly the performance indicators and results of performance for the reporting period in accordance with the requirements of the relevant legislation.
Corporations Act 2001
An act of the Commonwealth of Australia that sets out the laws dealing with business entities in Australia at federal and state levels. It focuses primarily on companies, although it also covers some laws relating to other entities such as partnerships and managed investment schemes.
Debt
Amount of money owed by one party to another party.
Depreciation
The systematic allocation of the value of a physical asset over its expected useful life.
Emphasis of matter
An auditor's report can include an emphasis of matter paragraph that draws attention to a disclosure or item in the financial report that is relevant to the users of the auditor's report but is not of such nature that it affects the auditor's opinion—i.e. the auditor's opinion remains unmodified.
Entity
A body whether corporate or unincorporated that has a public function to exercise on behalf of the state or is wholly owned by the state, including: departments, statutory authorities, statutory corporations and government business enterprises.
Equity or net assets
Residual interest in the assets of an entity after deduction of its liabilities.
Ex-gratia expenses
The voluntary payment of money or other non-monetary benefit—e.g. a write-off—that is not made either to acquire goods, services or other benefits for the entity or to meet a legal liability, or to settle or resolve a possible legal liability of or claim against the entity.
Expense
Outflows or other depletions of economic benefits in the form of incurrence or liabilities or depletion of assets of the entity.
Fair value
The price that would be received to sell an asset or paid to transfer a liability in an orderly transaction between market participants at the measurement date.
Financial accommodation levy
Applied to government-owned entities declared to be leviable authorities under the Financial Management Act 1994.
The purpose of the levy is to remove the market advantage government entities may experience in borrowing, as a result of their sovereign status, thereby ensuring that borrowings are valued appropriately in financing decisions for capital projects.
The levy can be payable where borrowings are greater than $5 million.
Financial Management Act 1994
The Act of the State of Victoria that establishes the financial administration and accountability of the public sector, as well as annual reporting to the Parliament by all departments and public sector bodies.
Financial delegation
A schedule that specifies the level or approval required for each transaction category to facilitate the execution of functions necessary for the efficient operation of the entity.
Financial report
Structured representation of financial information, which usually includes accompanying notes, derived from accounting records and intended to communicate an entity's economic resources or obligations at a point in time or the changes therein for a period in accordance with a financial reporting framework.
Financial reporting direction
Financial reports are prepared in accordance with Australian Accounting Standards and Interpretations as issued by the Australian Accounting Standards Board (AASB). When an AASB standard provides accounting treatment options, the Minister for Finance issues financial reporting directions to ensure consistent application of accounting treatment across the Victorian public sector in compliance with that particular standard.
Financial sustainability
An entity's ability to manage financial resources so it can meet spending commitments, both at present and into the future.
Financial year
The period of 12 months for which a financial report (and performance report) is prepared.
Going concern
An entity which is expected to be able to pay its debts as and when they fall due, and continue in operation without any intention or necessity to liquidate or otherwise wind up its operations.
Hybrid price cap
A water entity can use a price cap but can also apply to the ESC for a tariff basket during the regulatory period.
Hybrid revenue cap
A water entity can use a revenue cap but can also apply to the ESC for a tariff basket during the regulatory period.
Independent auditor's report
An expression of the independent auditor's opinion on an entity's financial or performance report.
Internal audit
A function of an entity's governance framework that examines and reports to the governing body and management on the effectiveness of risk management, control and governance processes.
Internal control
A means by which an entity's resources are directed, monitored and measured. It plays an important role in preventing and detecting error and fraud and protecting the entity's resources.
Liability
A present obligation of the entity arising from past events, the settlement of which is expected to result in an outflow from the entity of resources embodying economic benefits.
Materiality
Information is material if its omission of misstatement could influence the economic decisions of users taken on the basis of the financial report. Materiality depends on the size or nature of the item or error judged in the particular circumstances of its omission or misstatement.
Net result
The net result is calculated by subtracting an entity's total expenses from the total revenue, to show what the entity has earned or lost in a given period of time.
Non-reciprocal
Transfers in which an entity receives assets without directly giving equal value in exchange to the other party to the transfer.
Performance report
A statement containing predetermined performance indicators and targets and actual results achieved against these for that financial year, with an explanation for any significant variance between the results and targets.
Price cap
An imposed limit on how high a price is charged for a product.
Qualified audit opinion
A qualification is issued when the auditor concludes that an unqualified opinion cannot be expressed due to one of the following reasons:
- disagreement with those charged with governance
- conflict between applicable financial reporting frameworks
- limitation of scope.
A qualified opinion shall be expressed as being unqualified except for the effects of the matter to which the qualification relates.
Refinance
Replacement of an existing debt obligation with another debt obligation under different terms. Usually performed to extend the original debt over a longer period of time, reduce fees or interest rates, or move from a fixed to variable interest rate.
Regulatory period
The regulatory period is a statutory guideline, generally a defined term and reflects all of the financial/operational activities occurred during that time.
Relevant
Measures or indicators used by an entity are relevant if they have a logical and consistent relationship to an entity's objectives and are linked to the outcomes to be achieved.
Revaluation
Recognising a reassessment of values for non-current assets at a particular point in time.
Revenue
Inflows of funds or other enhancements or savings in outflows of service potential, or future economic benefits in the form of increases in assets or reductions in liabilities of the entity, other than those relating to contributions by owners which result in an increase in equity during the reporting period.
Rollover
Prior to or at maturity of a loan, the parties of the loan agreement continue to carry over the loan for another successive period of time.
Water Plan
A document prepared and published by a water business, setting out the services, key projects and prices that the business proposes to deliver over the regulatory period.
Appendix E. Performance reporting
Financial indicators
Figure E1 Financial indicators
|
Indicator number |
Indicator |
Metropolitan wholesaler |
Metropolitan retailer |
Regional urban |
Rural |
|---|---|---|---|---|---|
|
F1 |
Cash interest cover Net operating cash flows before net interest and tax / net interest payments |
✔ |
✔ |
✔ |
✔ |
|
F2 |
Gearing ratio Total debt (including finance leases) / total assets * 100 |
✔ |
✔ |
✔ |
✔ |
|
F3 |
Internal financing ratio Net operating cash flow less dividends / net capital expenditure * 100 |
✔ |
✔ |
✔ |
✔ |
|
F4 |
Current ratio Current assets / current liabilities (excluding long-term employee provisions and revenue in advance) |
✔ |
✔ |
✔ |
✔ |
|
F5 |
Return on assets Earnings before net interest and tax / average assets * 100 |
✔ |
✔ |
✔ |
✔ |
|
F6 |
Return on equity Net profit after tax / average total equity * 100 |
✔ |
✔ |
✔ |
✔ |
|
F7 |
EBITDA margin Earnings before interest, tax, depreciation and amortisation / total revenue * 100 |
✔ |
✔ |
✔ |
✔ |
|
Total |
7 |
7 |
7 |
7 |
Note: ✔ Performance indicator included in the performance report.
EBITDA—Earnings before interest, tax, depreciation and amortisation.
Source: Victorian Auditor-General's Office.
Non-financial indicators
Figure E2
Non-financial indicators, water and sewerage services
|
Indicator number |
Indicator |
Metropolitan wholesaler |
Metropolitan retailer |
Regional urban |
Rural |
|---|---|---|---|---|---|
|
WS1 |
Unplanned water supply interruptions No. of customers receiving (x) unplanned interruptions in the year / total number of water (domestic and non-domestic) customers * 100 |
✔ |
✔ |
||
|
WS2 |
Interruption time Average duration of unplanned water supply interruptions |
✔ |
✔ |
||
|
WS3 |
Restoration of unplanned water supply Unplanned water supply interruptions restored within (x) hours / total unplanned water supply interruptions * 100 |
✔ |
✔ |
||
|
WSR1 |
Rural water supply deliveries Number of orders delivered / total number of orders * 100 |
✔ |
|||
|
WSR2 |
Unavailability of Domestic and Stock supply Duration that domestic and stock service is unavailable in excess of on-property storage requirement / length of water season * 100 |
✔ |
|||
|
WSR3 |
Groundwater supply Number of transfers processed within target period / total number of transfers processed * 100 |
✔ |
|||
|
SS1 |
Containment of sewer spills Sewer spills from reticulation and branch sewers contained within (x) hours / total sewer spills from reticulation and branch sewers |
✔ |
✔ |
||
|
SS2 |
Sewer spills interruptions No. of residential sewerage customers affected by sewerage interruptions restored within (x) hours |
✔ |
✔ |
||
|
WQ1 |
Water quality Compliance with BWSA: Microbiological Standards - E. coli |
✔ |
|||
|
WQ2 |
Water quality Compliance with BWSA: Aesthetics - Turbidity |
✔ |
|||
|
CRM1 |
Customer responsiveness Complaints referred to EWOV responded to within EWOV established time |
✔ |
|||
|
EM1 |
Non-compliance with EPA Victoria Corporate License and SEPP parameters—Sewerage system failure Zero spills due to sewerage system failure |
✔ |
|||
|
EM2.1 |
Compliance with EPA Victoria discharge licence requirements—Western Treatment Plant |
✔ |
|||
|
EM2.2 |
Compliance with EPA Victoria discharge licence requirements—Eastern Treatment Plant |
✔ |
|||
|
WW1 |
Waterways—drainage and flood protection A further 10% of currently known intolerable (extreme) flood risks will be reduced by 2018 |
✔ |
|||
|
WW2 |
Waterways condition Achievement of Water Plan implementation targets set out in the Healthy Waterways Strategy |
✔ |
|||
|
RW1.1 |
Recycled water—WTP recycled water schemes—volume demands WTP recycled water schemes fully compliant with regulatory obligations and their contractual requirements, as outlined in the relevant BRWSAs |
✔ |
|||
|
RW1.2 |
Recycled water—WTP recycled water schemes—reliability Refer RW1.1 |
✔ |
|||
|
RW1.3 |
Recycled water—WTP recycled water schemes—quality Refer RW1.1 |
✔ |
|||
|
RW2.1 |
Recycled water—ETP recycled water schemes—volume demands ETP recycled water schemes fully compliant with regulatory obligations and their contractual requirements, as outlined in the relevant BRWSAs |
✔ |
|||
|
RW2.2 |
Recycled water—ETP recycled water schemes—reliability Refer RW2.2 |
✔ |
|||
|
RW2.3 |
Recycled water—ETP recycled water schemes—quality Refer RW2.2 |
✔ |
|||
|
Total water and sewerage services |
14 |
5 |
5 |
3 |
|
Note: ✔ Performance indicator included in the performance report.
BWSA—Bulk Water Supply Agreement.
EPA—Environment Protection Authority.
SEPP—State Environment.
Protection Policy.
WTP—Western Treatment Plant.
ETP—Eastern Treatment Plant.
BRWSA—Bulk Recycled Water Service Agreement.
Source: Victorian Auditor-General's Office.
Figure E3
Non-financial indicators, customer responsiveness
|
Indicator Number |
Indicator |
Metropolitan wholesaler |
Metropolitan retailer |
Regional urban |
Rural |
|---|---|---|---|---|---|
|
CR1 |
Water quality complaints No. of complaints per 100 customers for colour, turbidity, taste and odour and other |
✔ |
✔ |
||
|
CR2 |
Sewerage service quality complaints No. of complaints per 100 customers |
✔ |
✔ |
||
|
CR3 |
Sewage odour complaints No. of complaints per 100 customers |
✔ |
✔ |
||
|
CR4 |
Billing complaints No. of complaints per 100 customers |
✔ |
✔ |
✔ |
|
|
Total customer responsiveness |
0 |
4 |
4 |
1 |
|
Note: ✔ Performance indicator included in the performance report.
Source: Victorian Auditor-General's Office.
Figure E4
Non-financial indicators, environmental
|
Indicator Number |
Indicator |
Metropolitan wholesaler |
Metropolitan retailer |
Regional urban |
Rural |
|---|---|---|---|---|---|
|
E1 |
Effluent re-use volume (end use) Percentage recycled for each category urban and industrial, agricultural, environmental flows and other uses. |
✔ |
✔ |
||
|
E2 |
Total net CO2 emissions Net tonnes CO2 equivalent |
✔ |
✔ |
✔ |
|
|
Total environmental |
0 |
2 |
2 |
1 |
|
Note: ✔ Performance indicator included in the performance report.
Source: Victorian Auditor-General's Office.
Appendix F. Audit Act 1994 section 16—submissions and comments
Introduction
In accordance with section 16(3) of the Audit Act 1994 a copy of this report, or relevant extracts from the report were provided to all water entities, the Department of Environment, Land, Water & Planning, the Department of Treasury & Finance, the Essential Services Commission and the Treasury Corporation of Victoria with a request for submissions or comments.
The submissions and comments provided are not subject to audit nor the evidentiary standards required to reach an audit conclusion. Responsibility for the accuracy, fairness and balance of those comments rests solely with the agency head.
RESPONSE provided by the Secretary, Department of Environment, Land, Water & Planning