Water Entities: Results of the 2010–11 Audits
Overview
This report covers the results of our financial audits of 20 entities in the water industry, comprising 19 water entities and one controlled entity. The report informs Parliament about significant issues arising from the audits of financial and performance reports and augments the assurance provided through audit opinions included in the respective entities’ annual reports.
The report comments on the quality and timeliness of financial reporting, the financial sustainability of water entities, performance reporting and the effectiveness of internal controls over asset valuations, declarations of interest and outsourcing.
Parliament can have confidence in the 20 financial reports and 16 performance reports that received clear audit opinions.
The internal control structures over financial reporting within audited entities were adequate, that is they enabled production of accurate, complete and reliable information for reporting. However, controls over information technology, asset valuations, declarations of interest and outsourcing can be improved.
Overall the financial sustainability risk for the water industry is low. However, the risk is uneven across the metropolitan, regional urban and rural categories. The longitudinal trends indicate that the risk profile for the industry is deteriorating and deeper analysis of indicators suggests that the sustainability of entities within the regional urban category could be at risk over time unless these trends are reversed.
Debt levels continue to increase and a number of sustainability indicators such as liquidity and interest cover show deteriorating trends.
The ability of water entities to increase the price they charge for water and the provision of sewerage services is regulated and based on five-year water plans developed by each entity. The plans were developed over a period of drought, below-average rainfall and the imposition of water restrictions. There is now a risk that assumptions in the plans are no longer appropriate, that revenue and expenditure will not be as forecast.
Water Entities: Results of the 2010–11 Audits: Message
Ordered to be printed
VICTORIAN GOVERNMENT PRINTER November 2011
PP No 83, Session 2010–11
President
Legislative Council
Parliament House
Melbourne
Speaker
Legislative Assembly
Parliament House
Melbourne
Dear Presiding Officers
Under the provisions of section 16AB of the Audit Act 1994, I transmit my report on Water Entities: Results of the 2010–11 Audits.
Yours faithfully
![]()
D D R PEARSON
Auditor-General
9 November 2011
Audit summary
Background
This report covers the results of our financial audits of 20 entities in the water industry, comprising 19 water entities and one controlled entity. It informs Parliament about significant issues arising from the audits of financial and performance reports and augments the assurance provided through audit opinions included in the entities' annual reports.
The report comments on the quality and timelines of financial reporting, the financial sustainability of water entities, and the effectiveness of internal controls over asset valuations, declarations of interests and outsourcing.
Conclusion
Clear audit opinions were issued on all 20 financial reports and 16 performance reports for the financial year ended 30 June 2011.
The 19 water entities reported a net profit before tax of $405.4 million in 2010–11, a decrease of $18.5 million or 4.4 per cent from 2009–10. However, while the four metropolitan water entities continue to generate strong profits year‑on‑year, eight of the 13 regional urban water entities (62 per cent) reported a lower net profit before tax in 2010–11 relative to the prior year, and five reported a net loss before tax. The two rural water entities continued to report losses.
The overall risk to financial sustainability for the water industry is low. However, the risk is uneven across the metropolitan, regional urban and rural categories. The longitudinal trends indicate that the risk profile for the industry is deteriorating and deeper analysis of indicators suggests that the sustainability of other entities within the regional urban category could be at risk over time unless these trends are reversed.
Debt levels continue to increase and a number of sustainability indicators, such as liquidity, interest cover, and capital replacement ratio show deteriorating trends.
The ability for water entities to increase the price they charge for water and the provision of sewerage services is regulated by the Essential Services Commission (ESC), based on five-year water plans developed by each entity. The funding model, therefore, restricts the ability of water entities' boards to take key decisions on the cost of water to offset the increasing costs of service provision.
The approved water plans cover from 2008–09 to 2012–13 and were developed over a period of ongoing drought, a decade of below-average rainfall and the imposition of water restrictions. There is now a risk that assumptions in those plans are no longer appropriate and that revenue and expenditure will not be as forecast. In the event that revenue reduces due to reduced demand for water, the financial sustainability of entities can be adversely affected.
Consequently, it is timely to revisit the ESC's pricing model and the planning activities of water entities to determine their suitability in a time of changing environmental conditions.
Findings
Audit opinions and quality of financial reporting
Audit opinions issued on financial reports
Clear audit opinions were issued on the financial reports of all 20 entities, consistent with the prior year result.
An emphasis of matter paragraph was included in the audit report issued on the financial report of Watermove, a controlled entity of Goulburn-Murray Water (G-MW). It outlined Watermove's reliance on the continuing financial support of its parent entity to sustain its operations. Without this support, the entity would not have met the 'going concern' requirement of the Australian Accounting Standards at 30 June 2011.
Audit opinions issued on performance reports
Melbourne Water, the 13 regional urban water corporations, and the two rural water corporations each prepared and submitted for audit a performance report. Clear audit opinions were issued on all 16 performance reports.
Quality of reporting
Overall, the financial and performance report preparation processes of water entities were adequate and produced accurate, complete and reliable information, but there were opportunities for improvement in:
- establishing preparation plans outlining processes, resources, milestones, oversight and quality assurance practices for financial and performance reporting
- preparing and providing timely shell financial and performance reports to enable issues to be identified and resolved earlier
- preparing materiality assessments to identify potential errors in the financial and performance reports
- performing rigorous quality control and assurance to improve the accuracy of the draft financial and performance reports
- performing rigorous analytical reviews to help improve the accuracy of the financial and performance reports.
All entities, except for Watermove, finalised their financial report, and performance report where applicable, within the 12-week legislative reporting time frame, consistent with the prior year. Watermove's financial report was finalised after 16.6 weeks, compared to 8.9 weeks in 2009–10. Material uncertainty regarding its ability to continue as a going concern required an assessment of the financial viability of the business, and resulted in additional disclosures and adjustments to the financial report.
The average time taken by the 16 water corporations to finalise their financial and performance reports was 9.0 weeks in 2010–11, compared to 7.4 weeks in 2009–10, due to delays in the revaluation of infrastructure assets for the regional urban and rural entities.
The average time for the three metropolitan retail distribution companies to finalise their financial reports was 8.2 weeks in 2010–11 compared to 8.0 weeks in 2009–10.
Financial results
The 19 water entities reported a net profit before tax of $405.4 million in 2010–11, a decrease of $18.5 million or 4.4 per cent from 2009–10. The decrease was predominantly due to higher finance costs, depreciation expenses, and the write-off of impaired assets. Regular rainfall during the financial year resulted in lower water consumption. This reduced the revenue generated by the entities and nullified the impact of approved price increases.
While the four metropolitan water entities continue to generate strong profits year‑on‑year, eight of the 13 regional urban water entities (62 per cent) reported a lower net profit before tax in 2010–11 relative to the prior year, and five reported a net loss before tax (three in 2009–10). The two rural water entities continued to report losses.
Revenue increased by $411.2 million or 12.6 per cent from 2009–10 due to higher service and usage charges.
Our analysis of the service and usage charges revealed that a large portion of the customer total water bill is fixed, especially for the regional urban and rural sectors. This means that for many customers, reducing water consumption will not result in a substantially lower water bill.
Financial sustainability
To be financially sustainable, entities need to be able to meet current and future expenditure as it falls due. They must also be able to absorb foreseeable changes and the effect of financial risks materialising, without significantly changing their revenue and expenditure policies.
The six financial sustainability indicators, analysed for the five years from 2006–07 to 2010–11 were:
- the underlying result
- interest cover
- liquidity
- debt-to-assets
- self-financing
- capital replacement.
These indicators were reviewed and revised during 2010–11. This year we considered the liquidity and interest cover ratios collectively rather than individually to assess financial sustainability given the treasury management policies of the water entities. The 'debt-to-equity' ratio was replaced by the 'debt-to-assets' ratio as this measure is more widely applied across the water industry.
The results of our analysis of the 19 water entities, at the entity sector level are provided in Figure A.
Figure A
Financial sustainability risk assessment by water sector for 2010–11 and 2009–10
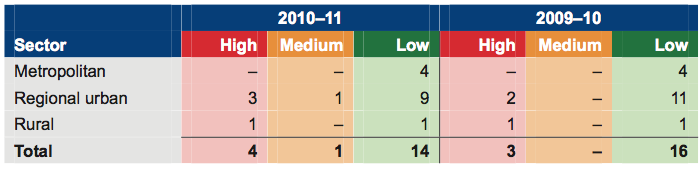
Source: Victorian Auditor-General's Office.
Four entities (three entities in 2009–10) rated as being a high financial sustainability risk at 30 June 2011 had poor liquidity, inadequate interest cover, or large operating losses. Three of the four were identified as high risk in most years over the past five‑year period.
Our analysis of the trend in financial sustainability risk results over the five years to 2010–11 showed a deteriorating risk profile for the industry as a whole.
Analysis of the trend in sustainability indicators over the same period showed the trend for the metropolitan water entities to be relatively stable. They have a large customer base and continue to generate strong profits and positive cash flows from operations annually.
The regional urban water entities, as a cohort are also relatively well placed. However, the results for Coliban Water and Grampians Wimmera Mallee Water Corporation over the past five years are less favourable and require monitoring. Deeper scrutiny indicates that the sustainability of other entities within the sector could be at risk over time unless downward trends are redressed.
For the rural water entities, the results for G-MW are unsustainable and overshadow the results for that sector. In 2010–11 the entire G-MW board resigned and a number of senior managers departed. A new board was appointed late May 2011 and a new managing director in August 2011. The impact of these changes and of decisions they take to improve the financial performance and position of the entity should become more evident in subsequent reporting periods.
Regulation of water prices
Over and above the analysis of financial sustainability indicators, trends and risks, the capacity of management and the governing body to take decisions necessary to affect an entity's operations needs to be taken into account in assessing the entity's performance.
Since 1 January 2004 the ESC has been responsible for regulating and approving the price a water entity may charge its customers for the supply of water and the provision of sewerage services.
The price is determined based on an entity's water plan which specifies the outcomes the entity plans to deliver, how they will be achieved, and the revenue needed to deliver them over the life of the plan. An entity's water plan also outlines the proposed operating and capital expenditure over the period of the plan. A range of assumptions underpin the proposed revenue and expenditure forecasts. Should actual and forecast figures vary or their underpinning assumptions prove to be incorrect, the actual financial performance and financial sustainability of the entity can fall short of the plan.
The current water plans cover from 2008–09 to 2012–13 and were developed during a period of ongoing drought with around a decade of below-average rainfall and the imposition of water restrictions. With many customers adopting water conservation measures the volume of water supplied in recent years has also been less than forecast resulting in revenue being less than forecast. Following a period of above average rainfall, and with water storages nearing capacity, especially in regional Victoria, there is now a risk that assumptions in the plans are no longer appropriate and that revenue and expenditure will not be as forecast. In the event that revenue further reduces due to reduced demand for water, financial sustainability may be adversely affected.
Given that the financial sustainability of some water entities and sector categories has deteriorated it would be timely to revisit:
- the duration of water plans
- the appropriateness of the funding model and its flexibility in times of unpredictable weather patterns
- the rigour of the planning and forecasting by water entities.
Performance reporting
VAGO's report titled Water Entities: Results of the 2008–09 Audits recommended that the Department of Sustainability and Environment (DSE), in conjunction with the Department of Treasury and Finance, develop a consistent and contemporary performance reporting framework. The report also concluded that it was timely that the relevance, appropriateness and usefulness of the indicators be reviewed.
Key developments during 2010–11 were:
- including Melbourne Water in the list of entities required to prepare a performance report and submit it for audit
- review and revision of key performance indicators
- amendment of explanatory material, which includes a performance report template, by DSE to clarify the expectations of government and with the aim of improving the quality and consistency of reporting by the water entities.
Our key observations were:
- five of the 16 entities (31 per cent) prepared and submitted for audit a performance report that included indicators not specified by the directives issued under section 51 of the Financial Management Act 1994
- 12 of the 16 performance reports (13 of 15 in 2009–10) included indicators without targets.
When performance indicators have no related targets the usefulness of performance reports is reduced because a comparison of actual performance against the target cannot occur.
Given that performance reporting has been in place for more than five years, it is now appropriate that future audit opinions relating to the performance report conclude on the relevance and appropriateness of the performance indicators presented. It is intended that this approach be in place from 2012–13 onwards.
During consultation with my office regarding the proposed audit approach, representatives from both DSE and VicWater, the peak industry body, indicated support for the establishment of a working party with responsibility for developing relevant and appropriate indicators to be included in a performance report.
Internal controls
General internal controls
The internal control structures for all entities were adequate for producing reliable, accurate and timely financial reports. However, entities could strengthen their internal controls by:
- improving information system processes, restrictions, and access rights
- reporting and reviewing masterfile changes, access rights and termination payments relating to payroll
- reviewing and updating the methodology for calculating unbilled revenue accruals and monitoring long outstanding receivables.
Information system control weaknesses were identified at 45 per cent (nine of 20) entities which is concerning given the sensitivity of information captured by the entities, and the heavy reliance on information systems.
Controls over asset valuations
At 30 June 2011, the water industry had total assets of $35.2 billion ($27.8 billion in 2009–10). Infrastructure assets, property, plant and equipment accounted for $34 billion ($26.8 billion in 2009–10) or 96 per cent of total assets. In accordance with Financial Reporting Direction 103D Non-Current Physical Assets the 19 water entities revalued land, buildings and infrastructure assets during 2010–11.
Internal controls across the industry with respect to asset valuation were considered effective. However, there are opportunities for improvement of controls over valuations including the:
- 47 per cent of water entities that did not have asset valuation policies and procedures
- 20 per cent that had policies and procedures that were not reviewed by the governing body
- 50 per cent of policies and procedures that did not address the requirement to value assets at a component level
- 40 per cent of policies and procedures that did not specify who was authorised to make changes to them or how often they should be reviewed
- 20 per cent of policies and procedures that did not indicate how fair value should be determined.
The revaluation exercise within regional urban and rural entities identified significant differences of opinion between management and the Valuer-General Victoria (VGV) regarding the methodology adopted. It also identified a need for VGV to improve its quality assurance processes to minimise errors and adjustments in valuations.
Controls over declarations of interests
Overall, there were adequate internal controls over declarations of interests by board members or nominated officers. However, they could be strengthened by developing more comprehensive policies and procedures, and monitoring compliance with approved policies and legislative requirements.
Controls over declarations of interests could be further improved by addressing the following identified weaknesses:
- 21 per cent of water entities did not have declaration of interests policies and procedures
- 47 per cent of policies and procedures did not specify who was authorised to make changes or how often they should be reviewed
- 40 per cent of policies and procedures did not specify what records must be maintained and who was responsible for maintaining a central register
- 11 per cent of water entities did not maintain a central register
- only 53 per cent provided declarations of interest refresher training sessions to their board and nominated officers
- 68 per cent had not commissioned an internal audit of their compliance with legislative requirements in the past three years.
Controls over outsourcing
The water industry had $3.3 billion of operating expenses and $1.6 billion of capital works for 2010–11.
Controls over outsourcing were adequate, although improvements can be made by developing more comprehensive policies and by enhancing the monitoring and oversight activities.
Controls over outsourcing should be improved by the:
- 42 per cent of entities that did not have outsourcing policies and procedures
- 95 per cent that did not obtain assurance over the effectiveness of the internal controls from the outsourced provider
- 21 per cent that did not include the risks linked to outsourcing in their risk register
- 58 per cent that had not used their internal auditors to perform a review of their outsourcing activities in the last three years.
It is of concern that management of only 5 per cent of water entities obtained a letter of comfort from their outsourced provider. Outsourcing an activity does not absolve management of its responsibility for maintaining adequate internal controls. This is a control weakness in the current outsourcing arrangements across the entire water industry.
Recommendations
- That water entities further refine their financial and performance reporting processes by developing consolidated financial reporting preparation plans, preparing shell statements, performing materiality assessments, improving their quality assurance processes, and conducting rigorous analytical reviews.
- That the Essential Services Commission revisit the duration of water plans, the appropriateness of the funding model and its flexibility in times of changed weather patterns and the rigour of the planning and forecasting by water entities.
- That the Department of Sustainability and Environment in conjunction with the Department of Treasury and Finance develop a consistent and contemporary performance reporting framework for the 19 water entities.
- That a working party, comprising key stakeholders, be established to develop relevant and appropriate key performance indicators for inclusion in future performance reports of water entities.
- That water entities assess their policies and processes against the commonly identified internal control environment weaknesses and act to address them to make sure they are operating reliably and cost-effectively.
- That water entities take timely action to address identified information technology control weaknesses.
- That water entities develop and maintain comprehensive policies and procedures which are appropriately approved and subject to regular review.
- That the water industry work with the Department of Treasury and Finance and the Valuer-General Victoria (VGV) to determine the most appropriate valuation methodology for infrastructure assets.
- The VGV should ensure all valuations conducted, including those by service providers, be subjected to rigorous quality assurance processes, and that appropriate effort is invested in establishing agreement with client entities before valuations are conducted.
- That water entities obtain letters of comfort about the effectiveness of internal controls of outsourced providers.
- That water entities use internal audit to periodically review outsourcing practices and related policy compliance.
- That water entities report regularly to their boards on outsourced activities to enable effective monitoring of performance, including of actual performance against key performance indicators in contractual arrangements, risk mitigation activity, cost-benefit analysis, and actual costs against budget.
Submissions and comments received
In addition to progressive engagement during the course of the audit, in accordance with section 16(3) of the Audit Act 1994 a copy of this report, or relevant extracts from the report, was provided to the Department of Treasury and Finance, the Department of Sustainability and Environment, the Valuer‑General Victoria, the Essential Services Commission, the State Owned Enterprise for Irrigation Modernisation in Northern Victoria and the 20 entities with a request for submissions or comments.
Agency views have been considered in reaching our audit conclusions and are represented to the extent relevant and warranted in preparing this report. Their full section 16(3) submissions and comments however, are included in Appendix H.
1 Background
1.1 Introduction
The Victorian water industry consists of 20 entities, comprising 19 water entities and one controlled entity. All entities are wholly owned by the state government. The entities are stand-alone businesses responsible for their own management and performance. Each governing board appoints a managing director responsible for the day-to-day operating activities of the entity. An overview of the accountability arrangements of the water industry is provided at Appendix B.
The entities are to adopt sustainable management practices which give due regard to environmental impacts and which allow water resources to be conserved, properly managed, and sustained.
The water industry can be divided into the metropolitan, regional urban and rural sectors. Figure 1A details the number of entities by sector.
Figure
1A
Water industry
Sector |
Water corporations |
Retail distribution companies |
Controlled entities |
Total |
|---|---|---|---|---|
Metropolitan |
1 |
3 |
– |
4 |
Regional urban |
13 |
– |
– |
13 |
Rural |
2 |
– |
1 |
3 |
Total |
16 |
3 |
1 |
20 |
Source: Victorian Auditor-General's Office.
This report addresses significant issues arising from the 2010–11 financial audits of the water industry, and augments the assurance provided through audit opinions on financial and performance reports included in the respective entities' annual reports.
The report comments on the financial sustainability of the entities and their financial management and reporting activities. It also comments on the effectiveness of internal controls, in particular, controls over asset valuations, declarations of interest and outsourcing.
This is the third of six reports to be presented to Parliament covering the results of our 2010–11 financial audits. The reports in this series are outlined in Figure 1B.
Figure
1B
VAGO reports on the results of the 2010–11 financial audits
Report |
Description |
|---|---|
Auditor-General's Report on the Annual Financial Report of the State of Victoria, 2010–11 |
The report provided the results of the audit of the state's annual financial report. It addressed the quality and timeliness of financial reporting, explained significant financial results for the state and made observations on the status and financial implications of significant projects and developments that occurred during 2010–11 and subsequent to year-end. Tabled in Parliament on 9 November 2011. |
Public Hospitals: Results of the 2010–11 Audits |
The report provided the results of the audits of approximately 110 entities. It addressed the timeliness of their financial reporting, their financial sustainability, and aspects of how they managed procurement and information technology security. Tabled in Parliament on 9 November 2011. |
Water Entities: Results of the 2010–11 Audits |
This report provides the results of the audits of 20 entities and addresses the timeliness of their financial and performance reporting, their financial sustainability and aspects of how they manage declarations of interest, asset valuations and outsourcing. Tabled in Parliament on 9 November 2011. |
Portfolio Departments and Associated Entities: Results of the 2010–11 Audits |
The report will provide the results of the annual financial statement audits of approximately 210 entities. The report will include comment on the timeliness of their financial reporting, financial sustainability and aspects of how they manage grants administration, employee leave, information technology change, and information technology security. Proposed to be tabled in Parliament in November 2011. |
Local Government: Results of the 2010–11 Audits |
The report will provide the results of the audits of approximately 100 entities in the local government sector. The report will address the timeliness of their financial and performance reporting, their financial sustainability, their utilisation of internal audit and aspects of how they manage assets and procurement. Proposed to be tabled in Parliament in November 2011. |
Tertiary Education and Other Entities: Results of the 2011 Audits |
The report will provide the results of the annual financial audits of approximately 120 entities with a financial year-end other than 30 June 2011. The report will address the timeliness of their financial and performance reporting, their financial sustainability and aspects of how they manage capital projects, information technology security, and international student fee revenue. Proposed to be tabled in Parliament in May 2012. |
Source: Victorian Auditor-General's Office.
1.2 Financial audit framework
1.2.1 Audit of financial reports
An annual financial audit has two aims:
- to give an opinion consistent with section 9 of the Audit Act1994, on whether financial reports are fairly stated
- to consider whether there has been wastage of public resources or a lack of probity or financial prudence in the management or application of public resources, consistent with section 3A(2) of the Audit Act 1994.
The financial audit framework applied in the conduct of the 2010–11 audits is set out in Figure 1C.
Figure 1C
Financial audit framework
Planning
Planning is not a discrete phase of a financial audit, rather it continues throughout the engagement. However, initial audit planning is conducted at two levels:
- At a high or entity level, planning involves obtaining an understanding of the entity and its environment, including its internal controls. The auditor identifies and assesses: the key risks facing the entity; the entity’s risk mitigation strategies; any significant recent developments; and the entity’s governance and management control framework.
- At a low or financial reports line item level, planning involves the identification, documentation and initial assessment of processes and controls over management, accounting and information technology systems.
The output from the initial audit planning process is a detailed audit plan and a client strategy document, which outlines the proposed approach to the audit. This strategy document is issued to the client after initial audit planning and includes an estimate of the audit fee.
Conduct
The conduct phase involves the performance of audit procedures aimed at testing whether or not financial statement balances and transactions are free of material error. There are two types of tests undertaken during this phase:
- Tests of controls, which determine whether controls identified during planning were effective throughout the period of the audit and can be relied upon to reduce the risk of material error.
- Substantive tests, which involve: detailed examination of balances and underlying transactions; assessment of the reasonableness of balances using analytical procedures; and a review of the presentation and disclosure in the financial reports, for compliance with the applicable reporting framework.
The output from this phase is a final (and possibly an interim) management letter which details significant findings along with value-adding recommendations on improving controls and processes. These documents are issued to the client after any interim audit work and during the reporting phase.
Reporting
The reporting phase involves the formal presentation and discussion of audit findings with the client management, and/or the audit committee. The key outputs from this process are:
- A signed audit opinion, which is presented in the client’s annual report alongside the certified financial reports.
- A report to Parliament on significant issues arising from audits either for the individual entity or for the sector as a whole.
Source: Victorian Auditor-General's Office.
1.2.2 Audit of performance reports
Section 8(3) of the Audit Act 1994 authorises the Auditor-General to audit performance indicators included in the annual reports of a public sector entity to determine whether they fairly represent the entity's actual performance.
The Auditor-General uses this authority to audit the performance reports prepared by the water industry under Financial Reporting Direction 27B Presentation and Reporting of Performance Information.
1.2.3 Audit of internal controls
An entity's governing body is responsible for developing and maintaining its internal control framework. Internal controls are systems, policies and procedures that help an entity to reliably and cost-effectively meet its objectives. Sound internal controls enable the delivery of reliable, accurate and timely external and internal reporting.
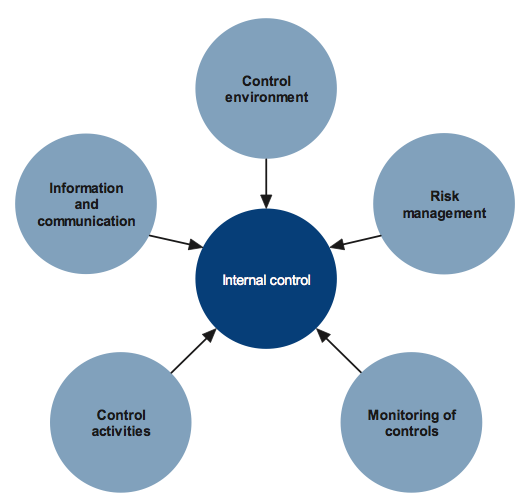
Figure 1D identifies the main components of an effective internal control framework.
Figure
1D
Components of an internal control framework
Source: Victorian Auditor-General's Office.
In the diagram:
- the control environment provides the fundamental discipline and structure for the controls and includes governance and management functions and the attitudes, awareness, and actions of those charged with governance and management of an entity
- risk management involves identifying, analysing and mitigating risks
- monitoring of controls involves observing the internal controls in practice and assessing their effectiveness
- control activities are policies, procedures and practices prescribed by management to help meet an entity's objectives
- information and communication involves communicating control responsibilities throughout the entity and providing information in a form and time frame that allows officers to discharge their responsibilities.
The annual financial audit enables the Auditor-General to form an opinion on an entity's financial report. An integral part of this, and a requirement of Australian Auditing Standard 315 Understanding the Entity and its Environment and Assessing the Risk of Material Misstatement, is to assess the adequacy of an entity's internal control framework and governance processes related to its financial reporting.
Internal control weaknesses we identify during an audit do not usually result in a 'qualified' audit opinion. A qualification is usually warranted only if weaknesses cause significant uncertainty about the accuracy, completeness and reliability of the financial information being reported. Often, an entity will have compensating controls that mitigate the risk of a material error in the financial report.
Weaknesses we find during an audit are brought to the attention of an entity's chairperson, managing director and audit committee by way of a management letter.
Section 16 of the Audit Act 1994 empowers the Auditor-General to report to Parliament on the results of audits. This report includes the results of our review of internal controls related to the financial reporting responsibilities of the water industry.
1.3 Audit conduct
The audits were undertaken in accordance with the Australian Auditing Standards.
The total cost of preparing and printing this report was $180 000.
1.4 Structure of this report
Figure 1E outlines the structure of this report.
Figure
1E
Report structure
Part |
Description |
|---|---|
Part 2: Audit opinions and quality of reporting |
Covers the results of the audits of the 2010–11 financial and performance reports of the 19 water entities and the one controlled entity, as applicable. It comments on the timeliness and accuracy of financial and performance reporting and compares practices in 2010–11 against better practice, legislated time lines and past performance. |
Part 3: Financial results |
Illustrates the financial results of the 19 water entities, including financial performance for 2010–11, and financial position at 30 June 2011. |
Part 4: Financial sustainability |
Provides insight into the financial sustainability of the 19 water entities obtained from analysing the trends in six financial sustainability indicators over a five-year period. |
Part 5: Performance reporting |
Outlines the current performance reporting framework and comments on work underway to influence the development of indicators included in performance reports in future reporting periods. |
Part 6: Internal controls |
Assesses internal controls at the 20 entities and summarises the control weaknesses commonly identified for the year‑ended 30 June 2011. |
Source: Victorian Auditor-General's Office.
2 Audit opinions and quality of reporting
At a glance
Background
Independent audit opinions add credibility to financial and performance reports by providing reasonable assurance that the information reported is reliable. The quality of an entity's reporting can be measured by the timeliness and accuracy of the preparation of the reports. This Part covers the results of the 2010–11 audits of the 19 water entities and one controlled entity. It also compares financial reporting practices in 2010–11 against better practice, legislated time lines and 2009–10 performance.
Conclusion
Parliament can have confidence in each of the 20 financial reports and 16 performance reports that received clear audit opinions. Financial reporting preparation processes were adequate although opportunity for improvement exists. The entities generally produced complete, accurate and reliable information.
Findings
- Clear audit opinions were issued on the 20 financial and 16 performance reports.
- While a clear audit opinion was issued on the financial report of Watermove, the audit report included an emphasis of matter paragraph because of the entity's reliance on the financial support from its parent entity.
- All entities except Watermove met the legislated 12-week financial reporting time frame.
- Adjustments arising from the audits resulted in a reduction of the net asset position of the water industry by $214.4 million in 2010–11.
- The quality of reporting would improve if all entities prepared shell statements, completed materiality assessments and undertook rigorous analytical reviews.
Recommendation
- That water entities further refine their financial and performance reporting processes by developing consolidated financial reporting preparation plans, preparing shell statements, performing materiality assessments, improving their quality assurance processes, and conducting rigorous analytical reviews.
2.1 Introduction
This Part covers the results from the audits of the 19 water entities and one controlled entity for the 2010–11 reporting period.
Figure 2A lists the legal and trading names of the 20 entities.
Figure 2A
Water entities and the controlled entity
|
Legal name |
Trading name |
|---|---|
|
Metropolitan sector |
|
|
Wholesaler Melbourne Water Corporation |
Melbourne Water |
|
Retail distribution companies City West Water Limited South East Water Limited Yarra Valley Water Limited |
City West Water South East Water Yarra Valley Water |
|
Regional urban sector |
|
|
Barwon Region Water Corporation |
Barwon Water |
|
Central Gippsland Region Water Corporation |
Gippsland Water |
|
Central Highlands Region Water Corporation |
Central Highlands Water |
|
Coliban Region Water Corporation |
Coliban Water |
|
East Gippsland Region Water Corporation |
East Gippsland Water |
|
Goulburn Valley Region Water Corporation |
Goulburn Valley Water |
|
Grampians Wimmera Mallee Water Corporation |
GWMWater |
|
Lower Murray Urban and Rural Water Corporation |
Lower Murray Water |
|
North East Region Water Corporation |
North East Water |
|
South Gippsland Region Water Corporation |
South Gippsland Water |
|
Wannon Region Water Corporation |
Wannon Water |
|
Western Region Water Corporation |
Western Water |
|
Westernport Region Water Corporation |
Westernport Water |
|
Rural sector |
|
|
Gippsland and Southern Rural Water Corporation |
Southern Rural Water |
|
Goulburn-Murray Rural Water Corporation |
Goulburn-Murray Water |
|
Controlled entity |
|
|
Watermove Pty Ltd |
Watermove |
Note: Watermove is a controlled entity of Goulburn-Murray Water.
Source: Victorian Auditor-General's Office.
2.2 Reporting framework
2.2.1 Financial reporting
Each of the audited water entities, including the controlled entity, must prepare its financial report in accordance with Australian Accounting Standards (AAS), including the Australian Accounting Interpretations. The AAS prescribe the accounting treatment to be adopted by for-profit and not-for-profit entities.
For financial reporting purposes the four metropolitan entities are designated as for‑profit-entities under Financial Reporting Direction (FRD) 108 Classification of Entities as For-Profit.
The principal legislation governing financial reporting by water entities are the Financial Management Act 1994 (FMA) and the Corporations Act 2001. Figure 2B summarises the number of entities reporting under each Act.
Figure 2B
Legislative framework for water entities and controlled entities
|
Legislative framework |
Water corporations |
Retail distribution companies |
Controlled entities |
Total |
|---|---|---|---|---|
|
Financial Management Act 1994 |
16 |
– |
– |
16 |
|
Corporations Act 2001 |
– |
3 |
1 |
4 |
|
Total |
16 |
3 |
1 |
20 |
Source: Victorian Auditor-General's Office.
Appendix C details the legislative framework that applies to each entity listed in Figure 2A.
The FMA requires an entity to submit its annual report to its minister. The report should include financial reports for the entity and is to be prepared and audited within 12 weeks of the end of the financial year. The annual report should be tabled in Parliament within four months of the end of the financial year.
The Corporations Act 2001 requires a company to report to its members within four months after the end of the financial year.
However, the need to consolidate the results of controlled entities into their parent entity's financial reports means that controlled entities reporting under the Corporations Act 2001 are in effect also required to report within 12 weeks of the end of the financial year.
Figure 2C summarises the legislative reporting time frames for the water industry entities.
Figure 2C
Legislative reporting time frames
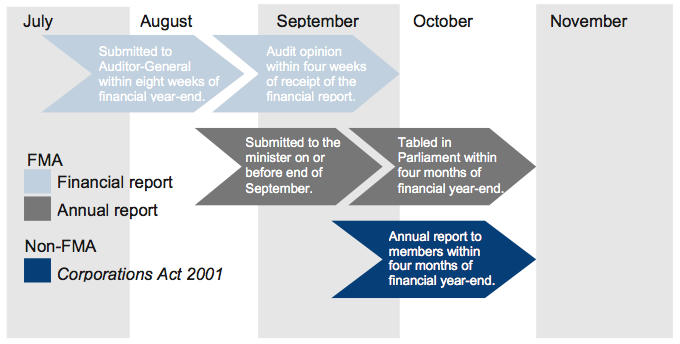
Source: Victorian Auditor-General's Office.
Despite the legislative time frames, on 18 May 2011, the Premier issued a circular requiring that annual reports of all public sector entities be tabled in Parliament by 15 September 2011.
2.2.2 Performance reporting
FRD 27B Presentation and Reporting of Performance Information requires the 16 water entities subject to the FMA, that is, Melbourne Water, the 13 regional urban water corporations and the two rural water corporations, to prepare and submit for audit a performance report. The three retail distribution companies, while not subject to the FMA, are encouraged to comply with FRD 27B.
Ministerial directives issued under section 51 of the FMA specify the form and content of the performance report. The performance report forms part of an entity's annual report tabled in Parliament.
2.3 Audit opinions issued
2.3.1 Financial reports
Clear audit opinions were issued on the financial reports for the 19 water entities and the controlled entity for the financial year ended 30 June 2011. The audit report on the financial report of Watermove included an 'emphasis of matter' paragraph. This was because of the entity's reliance on the financial support from its parent entity. In the absence of a letter of financial support from Goulburn-Murray Water, material uncertainty would have existed in relation to Watermove's ability to continue as a going concern.
Independent audit opinions add credibility to financial reports by providing reasonable assurance that the information presented is reliable. A clear audit opinion confirms that the financial report has been prepared according to the requirements of relevant accounting standards and legislation.
An auditor shall modify the opinion in the auditor's report when the auditor:
- concludes that, based on the audit evidence obtained, the financial report as a whole is not free from material misstatement
- is unable to obtain sufficient appropriate audit evidence to conclude that the financial report as a whole is free from material misstatement.
Definitions of clear and modified audit opinions are included in Appendix A.
2.3.2 Performance reports
Clear audit opinions were issued on the 16 performance reports audited.
The three retail distribution companies did not prepare and submit performance reports for audit. Performance information was included within their annual report; however it was not subject to audit.
2.4 The quality of reporting
The quality of an entity's financial reporting can be measured by the timeliness and accuracy of the preparation and finalisation of its financial and performance reports. To achieve cost-effective financial reporting, entities need to have well planned and managed financial report preparation processes.
In assessing the quality of the financial and performance reports an assessment was made against better practice criteria. The following rating scale was used:
- non-existent—function not conducted by the entity
- developing—partially encompassed in the entity's financial statements preparation processes
- developed—entity has implemented the process, however, it is not fully effective or efficient
- better practice—entity has implemented the processes which are effective and efficient.
2.4.1 Financial reporting
Figure 2D sets out better practice elements for producing complete, accurate and compliant financial reports within the legislative time frame.
Figure 2D
Selected better practice—financial report preparation
|
Key area |
Better practice |
|---|---|
|
Financial report preparation plan |
Establish a plan that outlines the processes, resources, milestones, oversight, and quality assurance practices required in preparing the financial report. |
|
Preparation of shell statements |
Prepare a shell financial report and provide it to the auditors early to enable early identification of amendments, minimising the need for significant disclosure changes at year-end. |
|
Materiality assessment |
Assess materiality, including quantitative and qualitative thresholds, at the planning phase in consultation with the audit committee. The assessment assists preparers to identify potential errors in the financial report. |
|
Monthly financial reporting |
Adopt full accrual monthly reporting to assist in preparing the annual financial report. This allows the year-end process to be an extension of the month-end process. |
|
Quality control and assurance procedures |
Require rigorous review of the supporting documentation, data and the financial report itself by an appropriately experienced and independent officer prior to providing it to the auditors. |
|
Supporting documentation |
Prepare high-standard documentation to support and validate the financial report and provide a management trail. |
|
Analytical reviews |
Undertake rigorous and objective analytical review during the financial report preparation process to help to improve the accuracy of the report. |
|
Reviews of controls/ self-assessment |
Establish sufficiently robust quality control and assurance processes to provide assurance to the audit committee on the accuracy and completeness of the financial report. |
|
Competency of staff |
The preparers of the financial report have a good understanding of, and experience in, applying relevant accounting standards and legislation. They also have effective project management and interpersonal skills. |
|
Financial compliance reviews |
Undertake periodic compliance reviews to identify areas of non‑compliance or changes to legislation that impact the financial report. |
|
Adequate security |
Protect and safeguard sensitive information throughout the process to prevent inappropriate public disclosure. |
Source: Victorian Auditor-General's Office, and Australian National Audit Office Better Practice Guide Preparation of Financial Statements, June 2009.
We assessed the 20 entities against the better practice elements and the results are summarised in Figure 2E.
Figure 2E
Results of assessment of financial report preparation processes against better practice elements
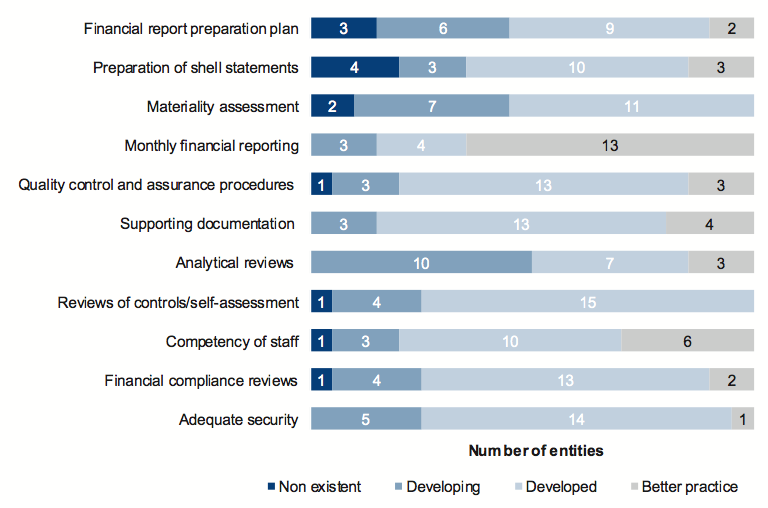
Source: Victorian Auditor-General's Office.
The developed or better practice elements commonly shared by the 20 entities included:
- preparation of shell statements
- monthly financial reporting
- quality control and assurance procedures
- supporting documentation
- reviews of controls/self-assessment
- competency of staff
- financial compliance reviews
- adequate security.
However, further improvement was needed in relation to:
- the financial report preparation plan
- materiality assessment
- analytical reviews.
Improving these areas will assist the timely preparation of quality financial reports, resource allocation planning and the early detection and correction of errors.
Based on our assessment of the financial reporting process, the overall quality of financial reporting in 2010–11 was substantially the same as in 2009–10.
2.4.2 Performance reporting
The performance report should be subject to the same level of internal quality assurance as the financial report. However, our review of the performance reports in previous years indicated that this was not the case.
Figure 2F sets out the best practice elements entities should aim for to assist them to produce a complete, accurate and compliant performance report within the legislative time frame.
Figure 2F
Selected better practice—performance report preparation
|
Key area |
Better practice |
|---|---|
|
Performance report preparation plan |
Establish a plan that outlines the processes, resources, milestones, oversight, and quality assurance practices required in preparing the performance report. |
|
Preparation of shell statements |
Prepare a shell performance report and provide to the auditors early to enable early identification of amendments, minimising the need for significant disclosure changes at year-end. |
|
Materiality assessment |
Assess materiality, including quantitative and qualitative thresholds, at the planning phase in consultation with the audit committee. The assessment assists preparers to identify potential errors in the performance report. |
|
Quality control and assurance procedures |
Require rigorous review of the supporting documentation, data and the performance report itself by an appropriately experienced and independent officer prior to providing it to the auditors. |
|
Supporting documentation |
Prepare high-standard documentation to support and validate the performance report, and provide a management trail. |
|
Reviews of controls/ self-assessment |
Establish sufficiently robust quality control and assurance processes to provide assurance to the audit committee on the accuracy and completeness of the performance report. |
|
Competency of staff |
The preparers of the performance report have a good understanding of, and experience in, applying relevant requirements and legislation. They also have effective project management and interpersonal skills. |
Source: Victorian Auditor-General's Office.
An assessment of performance against best practice criteria was undertaken for the 16 entities required to prepare and submit a performance report for audit. The results of our assessment are summarised at Figure 2G.
Figure 2G
Results of assessment of performance report preparation processes against better practice elements
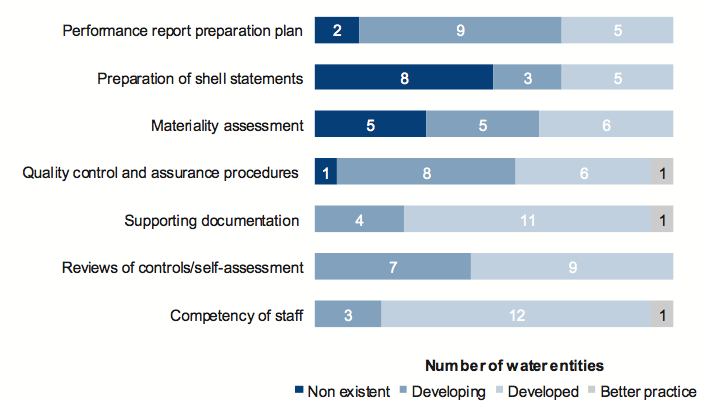
Source: Victorian Auditor-General's Office.
The developed or better practice elements commonly shared by the 16 entities include:
- supporting documentation
- reviews of controls/self-assessment
- competency of staff.
However, further improvement is needed in relation to:
- the performance report preparation plan
- preparation of shell statements
- materiality assessment
- quality control and assurance procedures.
VAGO's February 2011 Acquittal Report: Results of the 2009–10 Audits recommended that where an entity is required to prepare a performance report, the financial report preparation plan should consolidate the key requirements for preparing both the financial and performance reports. However, our 2010–11 review of reporting processes of the 16 water entities revealed that only five (31 per cent) developed a financial reporting preparation plan that consolidated the key requirements associated with preparing their financial and performance reports.
2.5 Timeliness of reporting
Recognising the importance of financial and performance reports in providing accountability for the use of public monies, entities should prepare and publish their financial and performance information on a timely basis. The later the reports are produced and published after year-end, the less useful they are for stakeholders and for informing decision-making.
It was encouraging that the shortened annual reporting time frames were achieved by the 19 water entities for 2010–11, consistent with the Premier's Circular No. 2011/02 requiring all annual reports to be tabled in Parliament by 15 September 2011.
Watermove did not meet the shortened annual reporting time frame due to the existence of a material uncertainty regarding its ability to continue as a going concern. This required an assessment of the financial viability of the business, and resulted in additional disclosures and adjustments to the financial report. Its financial report was finalised on 24 October 2011.
Appendix C specifies when the financial and performance reports were finalised.
2.5.1 Water corporations
Figure 2H shows that the average time taken by the 16 water corporations to finalise their 2010–11 financial and performance reports increased from the prior year. The average time was 9.0 weeks in 2010–11 compared to 7.4 weeks in 2009–10.
Figure 2H
Average time to finalise the financial and performance reports
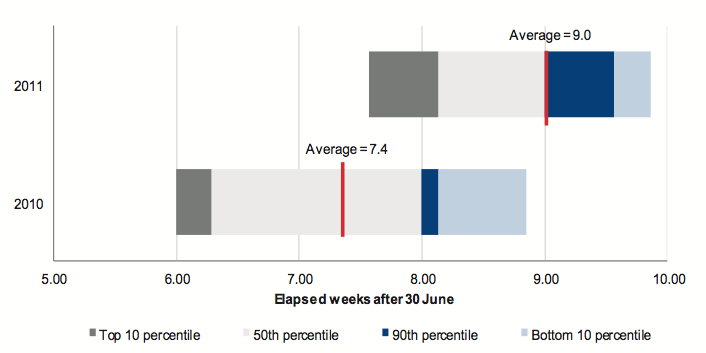
Source: Victorian Auditor-General's Office.
The financial reports took longer to finalise in 2010–11 due to the revaluation of infrastructure assets. Delays were initially encountered with the engagement of a qualified valuer, then issues regarding the appropriateness of the valuation methodology and data integrity had to be resolved. This delayed the finalisation and availability of the asset valuation reports which in turn delayed the preparation and finalisation of the financial reports.
2.5.2 Companies
Under the Corporations Act 2001 the three metropolitan distribution companies and the one controlled water entity are required to finalise financial reports within four months of the end of the financial year. However, because the results of controlled entities need to be consolidated into the annual financial report of the state, the reporting provisions of the FMA are also applied to the four entities.
The three metropolitan retail distribution companies met the FMA requirements in 2010–11, consistent with last year. The average time taken to finalise their financial reports was 8.2 weeks in 2010–11 compared to 8.0 weeks in the prior year. Watermove did not meet the FMA time frame. Its financial report was finalised after 16.6 weeks in 2010–11, compared to 8.9 weeks in 2009–10.
2.6 Accuracy
The frequency and size of errors requiring adjustment are direct measures of accuracy of draft financial and performance reports. Ideally, there should be no errors or adjustments arising through the audit.
When our staff detect errors in the draft financial and performances reports they are raised with management. Material errors need to be corrected before a clear audit opinion can be issued. The entity itself may also change its draft financial and performance reports after submitting them to audit, if their quality assurance procedures identify that reported information is incorrect or incomplete.
Overall, there are two types of adjustments:
- financial balance adjustments—changes to the balances being reported
- disclosure adjustments—changes to the commentary or financial note disclosures within the financial report.
2.6.1 Financial reporting
There were 11 material financial balance adjustments required in 2010–11 compared to 13 in the prior year. The adjustments resulted in changes to the net result and/or the net asset position of an entity.
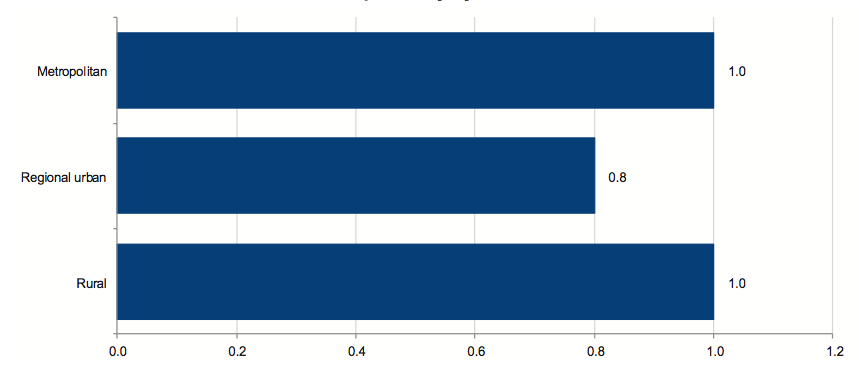
Figure 2I shows the average number of material financial balance adjustments per entity, by sector.
Figure 2I
Average number of material financial balance adjustments per entity by sector
Source: Victorian Auditor-General's Office.
The net asset position of the water industry declined by $214.4 million in 2010–11 ($0.9 million in 2009–10) due to adjustments arising from the audits, with:
- assets decreased by $31.7 million ($5.0 million in 2009–10)
- liabilities increased by $182.7 million ($5.9 million in 2009–10).
A number of the adjustments were related to the revaluation of land and infrastructure assets. Other adjustments included the incorrect capitalisation of repairs as assets and the incorrect recognition of grants received as income in advance.
The net result before income tax decreased by $7.5 million in 2010–11 ($1.7 million in 2009–10) in light of adjustments arising from the audits, with:
- revenue increased by $1.0 million ($1.7 million in 2009–10)
- expenses increased by $8.5 million (nil in 2009–10).
The adjustments related to the incorrect treatment of grants as income in advance, the incorrect capitalisation of repairs and the incorrect treatment of asset impairments.
An adjustment of $40.5 million relating to income tax was also processed by a regional urban entity, resulting in a higher net result after income tax.
In addition to the financial balance adjustments, there were 29 disclosure errors that required adjustment in the 2010–11 financial reports (14 in 2009–10). Figure 2J shows the average number of material disclosure adjustments per entity, by sector.
Figure 2J
Average number of material disclosure adjustments per entity by sector
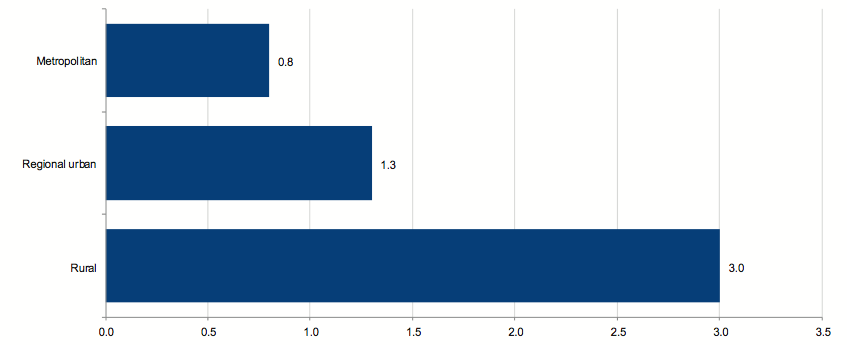
Source: Victorian Auditor-General's Office.
Figure 2K provides a summary of the material adjustments.
Figure 2K
Material financial balance and disclosure adjustments for 2010–11
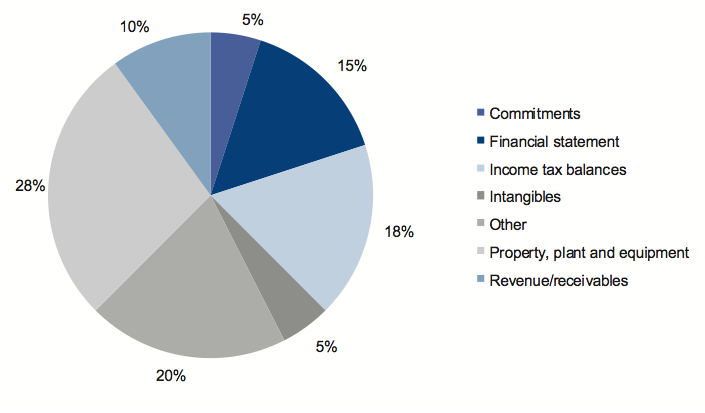
Source: Victorian Auditor-General's Office.
The following further comment is provided on the nature of the material adjustments and classification errors:
- Commitments—were understated due to GST being omitted from the total commitment figure or lease commitment receivables not being quantified and disclosed.
- Financial statement—adjustments were required to reclassify balances within line items in the statement of comprehensive income, statement of changes in equity and cash flow statement.
- Income tax balances—tax effect accounting journals as a result of an asset revaluation were either not recorded or the disclosures were incomplete.
- Intangibles—adjustments were required to reflect the amendment of useful lives and to separately disclose newly acquired water licences.
- Other—adjustments relate to incorrect split of balances between current and non‑current, the inclusion of notes that are no longer relevant or those that lack all required disclosures, and the inclusion of additional going concern narrative.
- Property, plant and equipment—a substantial number of adjustments were required due to the valuation of land, building and infrastructure assets. The adjustments stemmed from missing data, duplicated data and errors in valuation worksheets and journals posted.
- Revenue/receivables—adjustments were required to the amount of revenue recognised where entities had incorrectly brought certain revenue to account or incorrectly classified revenue, contrary to the applicable accounting standard.
The number of adjustments to both financial balances and disclosures indicates that water entities can further improve their financial reporting preparation processes and quality assurance.
2.6.2 Performance reporting
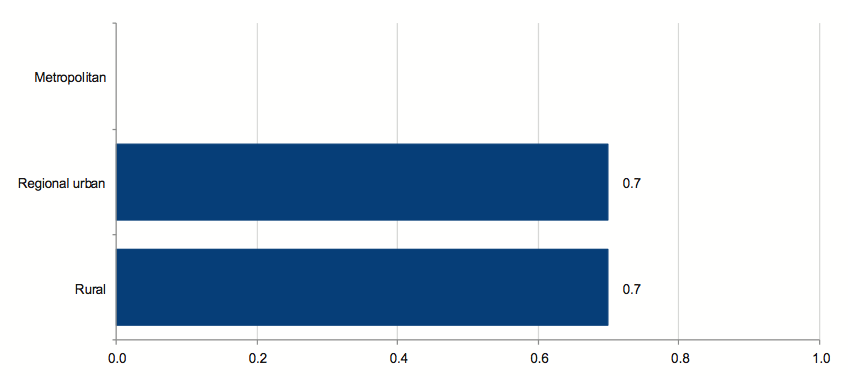
Our audit of the 16 performance reports generated 13 queries which resulted in a minimum of 13 adjustments being processed by entities across the three sectors. At times an audit query required more than one element of the report to be amended.
Five of 16 performance reports submitted for audit included performance indicators not required by the Ministerial directives issued under section 51 of the FMA. This was disappointing as the Department of Sustainability and Environment clarified the expectations of government during 2010–11 and enhanced its explanatory material with respect to form and content of the performance report.
Figure 2L shows the average number of queries that resulted in adjustments to performance reports per entity, by sector.
Figure 2L
Average number of performance report queries resulting in adjustments per entity by sector
Source: Victorian Auditor-General's Office.
Further comment on the nature of the adjustments and errors follows:
- Performance indicators—removal of additional performance indicators from the final performance report to achieve compliance with the Ministerial directives.
- Calculation—adjustments were required because variances between the current year and the target were not correctly computed.
- Comparatives—incorrect comparatives were disclosed.
- Notes to the accounts—a number of entities did not provide any, or adequate, explanations for material variances.
The nature of the adjustments indicates that the water entities can also improve their performance reporting preparation processes and quality control.
Recommendation
- That water entities further refine their financial and performance reporting processes by developing consolidated financial reporting preparation plans, preparing shell statements, performing materiality assessments, improving their quality assurance processes, and conducting rigorous analytical reviews.
3 Financial results
At a glance
Background
The financial performance of entities is measured by their net operating result—the difference between revenue and expenses. Their financial position is measured by reference to its net assets—the difference between its total assets and total liabilities. This Part covers the financial results of the 19 water entities for the year ended 30 June 2011.
Findings
- The water industry generated a net profit before income tax of $405.4 million for the year ended 30 June 2011, a decrease of $18.5 million or 4.4 per cent from the prior year.
- Eight of the 13 regional urban water entities (62 per cent) reported a lower profit before tax in 2010–11 relative to the prior year, with five entities reporting a loss (three in 2009–10). The two rural water entities continued to report losses.
- There was a $104.8 million reduction in dividend payments in 2010–11 as there were no interim dividend payments.
- At 30 June 2011 the 19 water entities controlled $35.2 billion in total assets ($27.8 billion at 30 June 2010) and had total liabilities of $13.9 billion ($11.1 billion at 30 June 2010).
- The revaluation of land, buildings and infrastructure assets resulted in a $6 billion upward adjustment in asset values in 2010–11.
- Interest-bearing liabilities increased by $1.2 billion or 17 per cent in 2010–11, with the new borrowings financing the construction of infrastructure assets.
- The profitability of the 19 water entities will be impacted by higher depreciation expenses and finance costs in the future.
- For many customers, especially for the regional urban and rural sectors, reducing water consumption will not result in a substantially lower water bill.
3.1 Introduction
The financial objective for water entities should be to generate a sufficient surplus from operations to fund asset replacement, acquire new assets and retire debt. Their ability to achieve this objective is subject to the regulatory environment in which they operate, and on their ability to manage costs and maximise revenue. This is reflected in the composition of, and rate of change in, their operating revenue and expenses.
An entity's financial performance is measured by the net operating result—the difference between revenue and expenses. An entity's financial position is generally measured by reference to its net assets—the difference between its total assets and total liabilities.
Appendix D provides information on the composition of revenue, expenses, assets and liabilities for the 19 water entities, by sector, for 2010–11.
3.2 Financial results
3.2.1 Financial performance
Net result
The 19 water entities are subject to the National Tax Equivalent Regime, which is administered by the Australian Taxation Office. Accordingly, the net result before and after income tax is referenced in this section of the report.
Net result before income tax
The water industry generated a net profit before income tax of $405.4 million for the year ended 30 June 2011. This represented a decrease of $18.5 million or 4.4 per cent from the prior year. The decrease was predominantly due to higher finance costs, depreciation expenses, and the write-off of impaired assets. Regular rainfall during the financial year resulted in lower water consumption which in turn reduced the revenue generated by the entities and nullified the impact of approved price increases.
While it decreased, the overall net profit before income tax result was nevertheless strong, and continued to be driven by the ability of the four metropolitan entities to generate profits year-on-year. Eight of the 13 regional urban water entities (62 per cent) reported a lower net profit before tax in 2010–11 relative to the prior year, and five reported a net loss before tax (three in 2009–10). The two rural water entities continued to report losses.
Figure 3A shows the net profit or loss before income tax for each entity for the past two years.
Figure
3A
Net profit/(loss) before income tax for each water entity
2010–11 Net profit/(loss) before tax ($mil) |
2009–10 Net profit/(loss) before tax ($mil) |
|
|---|---|---|
Metropolitan sector |
||
Wholesaler |
||
Melbourne Water |
214.1 |
238.5 |
Retail distribution companies |
||
City West Water |
87.4 |
87.2 |
South East Water |
95.4 |
95.4 |
Yarra Valley Water |
86.3 |
59.9 |
Regional urban sector |
||
Barwon Water |
23.8 |
18.2 |
Central Highlands Water |
(1.3) |
(3.0) |
Coliban Water |
(24.3) |
(32.7) |
East Gippsland Water |
(0.2) |
0.4 |
Gippsland Water |
1.3 |
21.1 |
Goulburn Valley Water |
0.3 |
2.8 |
GWMWater |
(22.1) |
(17.6) |
Lower Murray Water |
(9.5) |
2.5 |
North East Water |
0.4 |
1.8 |
South Gippsland Water |
1.4 |
4.1 |
Wannon Water |
1.4 |
0.5 |
Western Water |
4.3 |
6.0 |
Westernport Water |
2.1 |
2.5 |
Rural sector |
||
Goulburn-Murray Water |
(52.9) |
(62.0) |
Southern Rural Water |
(2.5) |
(1.7) |
Total |
405.4 |
423.9 |
Source: Victorian Auditor-General's Office.
Net result after income tax
The water sector reported a net profit after income tax of $334.5 million in 2010–11, an increase of $26.1 million or 8.5 per cent from the prior year.
The recognition of deferred tax assets by a number of entities resulted in an income tax benefit rather than income tax expense in 2010–11. This contributed to the overall increase in the net result after tax.
Revenue
In 2010–11, the 19 water entities collectively generated revenue of $3.7 billion, an increase of $411.2 million, or 12.6 per cent from the prior year.
The increase was driven by higher service and usage charges. The current Water Plan will nearly double pricing in nominal terms over the five years to 2012–13.
The largest sources of revenue are service and usage charges. The service charge is a fixed charge levied on each property. The usage charge is a variable charge with the level of water consumption driving the amount the customer pays.
Excluding revenue arising from transactions between Melbourne Water and the three retail distribution companies, service and usage charges accounted for 83 per cent of total revenue generated in 2010–11.
Figure 3B summarises service and usage charges as a percentage of the total service and usage charges revenue for 2010–11.
Figure
3B
Service and usage charges as a percentage
of the total service and usage charges revenue
2010–11 Service Charge (Fixed) % |
2010–11 Usage Charge (Variable) % |
|
|---|---|---|
Metropolitan sector |
||
City West Water |
37 |
63 |
South East Water |
43 |
57 |
Yarra Valley Water |
42 |
58 |
Average |
41 |
59 |
Regional urban sector |
||
Barwon Water |
58 |
42 |
Central Highlands Water |
73 |
27 |
Coliban Water |
60 |
40 |
East Gippsland Water |
74 |
26 |
Gippsland Water |
67 |
33 |
Goulburn Valley Water |
61 |
39 |
GWMWater |
72 |
28 |
Lower Murray Water |
80 |
20 |
North East Water |
46 |
54 |
South Gippsland Water |
70 |
30 |
Wannon Water |
54 |
46 |
Western Water |
72 |
28 |
Westernport Water |
86 |
14 |
Average |
67 |
33 |
Rural sector |
||
Goulburn-Murray Water |
85 |
15 |
Southern Rural Water |
96 |
4 |
Average |
91 |
9 |
Note: Service and usage charges include water and wastewater charges.
Source: Victorian Auditor-General's Office.
Our analysis of the service and usage charges revealed that a large portion of the total water bill is fixed, especially for the regional urban and rural sectors. This means that for many customers, reducing water consumption will not result in a substantially lower water bill.
Expenses
In 2010–11, the 19 water entities collectively incurred $3.3 billion in operating expenses, an increase of $430.3 million or 15.1 per cent from the prior year. The increase was predominantly because:
- depreciation and amortisation expenses increased by $188 million (40 per cent)
- finance costs increased by $109 million (27 per cent)
- bulk water and sewerage charges increased by $111 million (21 per cent).
The revaluation of infrastructure assets by the four metropolitan water entities in 2009‑10 and construction of new infrastructure assets by the 19 entities in recent years has increased the value of assets held and depreciation.
Higher finance costs reflect the substantial increase in the level of borrowings across the industry since 1 July 2008.
Bulk water and sewerage charges relate to the services provided by Melbourne Water to the three retail distribution companies. These charges were increased to cover the costs associated with the delivery of major infrastructure projects under the Water Plan.
The largest expense items for the water entities in 2010–11 were operating and administration expenses, bulk water and sewerage charges, depreciation and amortisation expenses, finance costs, and employee costs.
Dividends
The 19 water entities are obliged to pay a dividend to the government if a formal determination to do so is made by the Treasurer, after consultation with the governing board and responsible minister.
In 2010–11, the four metropolitan water entities paid dividends of $71 million, a decrease of $104.8 million or 60 per cent compared with 2009–10. The decrease was because there were no interim dividend payments required during the year.
3.2.2 Financial position
The ability of water entities to maintain their infrastructure assets depends on the adequacy of their asset and debt management policies. Their effectiveness is reflected in the composition and rate of change of the value of their assets and liabilities over time.
Assets
At 30 June 2011, the water industry had assets valued at $35.2 billion, an increase of $7.4 billion or 27 per cent compared to the prior year. Property, plant, equipment and infrastructure assets represented 96 per cent of total assets.
The revaluation of land, buildings and infrastructure assets contributed $6 billion or 81 per cent of the overall increase in 2010–11.
The regional urban and rural water entities recorded infrastructure assets at fair value for the first time at 30 June 2011, resulting in an increase in infrastructure asset values of $5.3 billion. The fair value of the infrastructure assets was determined using a depreciated replacement cost approach.
The four metropolitan water entities transitioned to fair value in 2009–10, with the fair value of infrastructure assets determined using an income approach. The revaluation increment in that year was $4.8 billion. A managerial or independent revaluation of infrastructure assets also occurred during 2010–11 with a revaluation increment of $0.2 billion brought to account at 30 June 2011.
Both the depreciated replacement cost and income valuation approaches comply with the requirements of the Australian Accounting Standard AASB 116 Property, Plant and Equipment. The variation in approach is driven by an entity's designation as 'for-profit' or 'not‑for‑profit' for financial reporting purposes.
Liabilities
At 30 June 2011, the water industry had liabilities of $13.9 billion, an increase of $2.8 billion or 25 per cent in comparison with the prior year.
Deferred tax liabilities increased by $1.6 billion or 52 per cent in 2010–11, primarily due to the revaluation of infrastructure assets by the regional urban and rural entities.
Interest-bearing liabilities increased by $1.2 billion or 17 per cent in 2010–11. The new borrowings financed the construction of infrastructure assets. Over the past five years infrastructure assets, excluding the impact of the asset revaluations, increased by $6.0 billion. Interest-bearing liabilities increased over the same period by $4.8 billion.
Figure 3C highlights the growth in infrastructure assets and new borrowings over the past five years. It shows that new borrowings have largely funded the growth in infrastructure assets over the period.
Figure
3C
Comparison of infrastructure assets and borrowings
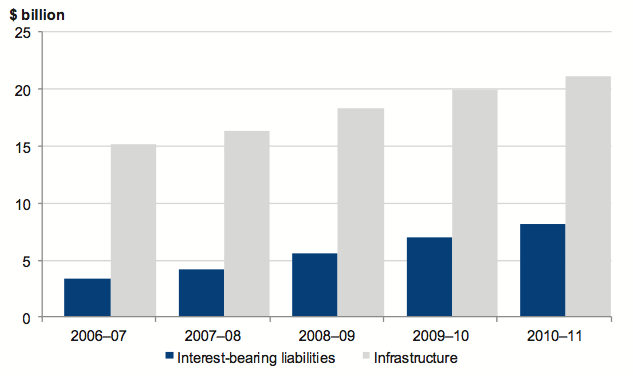
Note: The infrastructure asset value excludes the effect of asset revaluations in 2009–10 and 2010–11.
Source: Victorian Auditor-General's Office.
The profitability of the 19 water entities will continue to be impacted by higher depreciation expense and finance costs in the future, as a result of the higher asset values and increased borrowings.
4 Financial sustainability
At a glance
Background
To be financially sustainable, entities need to be able to meet current and future expenditure as it falls due. They also need the ability to absorb foreseeable changes and materialising risks without significantly changing their revenue and expenditure policies. This Part provides our insight into the financial sustainability of the 19 water sector entities based on our analysis of the trends in six indicators over a five‑year period.
Conclusion
Water sector entities operate in a highly regulated environment. The five-year Water Plan prepared by each water business and approved by the Essential Services Commission (ESC) forms the basis for determining the price entities can charge their customers for water. The accuracy of assumptions underpinning the proposed revenue and expenditure streams, and the achievement of forecast results in the plans is therefore critical.
Metropolitan water entities continue to generate strong profits and positive cash flows. However, there has been an increase in the number of regional urban entities reporting losses, and the two rural entities continue to report losses. It is timely to revisit the duration of the water plans, the appropriateness of the pricing model, and the capacity to provide water entities with a sustainable revenue stream.
Findings
- The timing and magnitude of price increases approved by the ESC has a direct impact on the financial performance and position of an entity over time.
- Overall the industry's underlying result deteriorated in 2010–11 with 37 per cent of entities (seven of 19) reporting a net loss, 10per cent more than in 2009–10.
- The level of interest cover continues to decline across the industry, with oneentity unable to service the finance costs associated with its debt at 30June2011.
- While consistent with the past three years, the number of entities with a poor liquidity has increased by 21 per cent since 2006–07.
4.1 Introduction
To be financially sustainable, entities need the capacity to meet their current and future expenditure as it falls due. They also need the ability to absorb foreseeable changes and financial risks as they materialise.
In this Part we provide insight into the financial sustainability of Victoria's water entities through analysis of the trends in each of six financial sustainability indicators over a five-year period. The six indicators are the:
- underlying result percentage
- interest cover ratio
- liquidity ratio
- debt-to-assets ratio
- self-financing percentage
- capital replacement ratio.
Appendix E of this report describes the sustainability indicators and risk assessment criteria we use in this report.
This year we extended our analysis to examine the six indicators as a basket of indicators for each entity, and for each of the sub-sectors, to identify early signs of improving or deteriorating trends. The results of the extended analysis are presented in this Part, and the underlying data can be found in Appendix F.
The financial sustainability indicators and assessments flag departures from the norm that warrant attention. However, to form a definitive view of any entity's financial sustainability requires a holistic analysis that moves beyond financial considerations to include the entity's operations and environment, and the regulatory environment in which the entity operates. These further considerations are not examined in this report.
4.2 Financial sustainability
4.2.1 Overall assessment
Four entities were rated a high financial sustainability risk at 30 June 2011 due either to poor liquidity and inadequate interest cover, or the magnitude of their operating loss.
Figure 4A provides a summary of our financial sustainability risk assessment results by sector for the past two years.
Figure 4A
Financial sustainability risk assessment by water sector
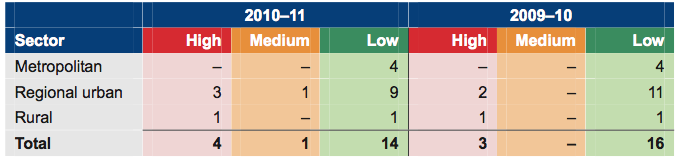
Source: Victorian Auditor-General's Office.
The financial sustainability results for 2006–07 to 2010–11 per entity are provided in Appendix F.
Our financial sustainability risk assessment criteria was reviewed and revised during 2010–11. Liquidity and interest cover ratios have been considered collectively rather than individually to assess financial sustainability given the treasury management policies of the water entities. Most water entities transfer customer receipts on a daily basis to their 11am loan account to minimise interest charges. In combination they provide a measure of an entity's ability to service its debt and interest repayments from operating cash flows. The 'debt-to-equity' ratio was also replaced by the 'debt-to-assets' ratio as this measure is more widely applied across the water industry.
The revised criteria are considered to provide a more meaningful insight into the financial sustainability of the industry, sector and the 19 water entities. The changes have been applied to the financial data for the five-year period 2006–07 to 2010–11.
4.2.2 Summary of trends in risk assessments over the five‑year period
When the risk assessments for each indicator are analysed they show the following trends over the five years to 2010–11:
- Underlying result—the number of entities in the high- and medium-risk categories has gone up and down, and other than 2008–09 and 2009–10, the number in the low‑risk category has remained stable.
- Interest cover—the number of entities in the medium-risk category increased in 2010–11, reflecting a shift from the high- and low-risk categories during the year. Over the five-year period the number of entities in the low-risk category has consistently decreased.
- Liquidity—there has been an increase in the number of entities in the high-risk category and a decrease in the low-risk category over the five-year period indicating tightening liquidity.
- Debt-to-assets—the number of entities in the low-risk category has remained stable.
- Self-financing—the number of entities in the low-risk category has remained stable over the five years, however, there has been a movement from the medium-risk category to high risk.
- Capital replacement—there has been a significant shift over the five years from low to medium risk.
In summary, the trend shows a deteriorating position for the sector over the five-year period to 2010–11. Further information about the risk assessments for each indicator is presented later in this Part.
4.2.3 Analysis of trends in sustainability indicators across the five-year period
To further understand the results we analysed the five-year data for the basket of six indicators for each of the metropolitan, regional urban and rural categories, and for each entity individually. The relevant data is reproduced in Appendix F.
The trend for the metropolitan water entities is relatively stable. They have a large customer base and continue to generate strong profits and positive cash flows from operations annually.
The regional urban water entities, as a cohort are also relatively well placed. However, the results for Coliban Water and Grampians Wimmera Mallee Water Corporation (GWMWater) over the past five years are less favourable and require monitoring. Deeper scrutiny indicates that the sustainability of other entities within the regional urban category may be at risk over time unless downward trends are redressed.
For the rural water entities, the results for Goulburn-Murray Water (G-MW) are unsustainable and overshadow the results for the remaining water entity in that sector. In 2010–11 the entire G-MW board resigned and a number of senior managers departed. A new board was appointed late May 2011 and a new managing director in August 2011. The impact of these changes and of decisions they take to improve the financial performance and position of the entity should become more evident in subsequent reporting periods. Further information about the financial sustainability of entities is presented later in this Part.
Specific comments
Coliban Water continues to generate an operating loss, has poor liquidity and a low level of interest cover. Its cash flows from operations are insufficient to fund new assets and asset renewals. Factors that have adversely impacted the business over the past five years include:
- below average rainfall through to 2009–10 resulted in the lowest and second lowest inflows to storages in recorded history, ongoing water restrictions, actual water sales being lower than forecast, and the requirement to purchase water to guarantee water supply
- high rainfall during 2010–11, which saw water storages near capacity for the first time in many years, also resulted in revenue being less than forecast due to lower water consumption whilst contributing to higher operating costs
- a fixed cost structure due to the outsourcing of a number of activities.
Coliban Water obtained approval from the Essential Services Commission (ESC) during 2009–10 to alter its approved price path by bringing forward price increases that were approved under the existing water plan to 1 July 2010. While a number of indicators improved during 2010–11, the sustainability of that result remains to be tested.
GWMWater has a high financial sustainability risk rating due to the size of its operating losses. The need to secure water supplies has impacted its financial performance. A number of its infrastructure assets were subject to accelerated depreciation during the period 1 July 2005 to 30 June 2008 as a result of the Grampians Wimmera Mallee pipeline project. The decommissioning of channels also increased the entity's operating expenses in recent years. The entity has increased its borrowings from $17 million at 30 June 2008 to $110 million at 30 June 2011, resulting in higher finance costs.
Both G-MW and Southern Rural Water have predominately generated operating losses over the five years. Both have substantial infrastructure assets. In accordance with a determination by the former Minister for Water, assets of rural water authorities acquired or constructed prior to 1 July 2004, or funded by government since 2004, were assigned a zero regulatory asset value. Depreciation and capital charges associated with those assets are therefore not funded under the pricing principles established by the Water Industry Regulation Order.
Accordingly, both G‑MW and Southern Rural Water expect to generate operating losses as revenue generated will continue to be insufficient to meet their total operating costs.
4.2.4 Regulating the price of water
Since 1 January 2004 the ESC has had responsibility for regulating and approving the price a water entity may charge its customers for the supply of water and the provision of sewerage services. Principles considered by the ESC when approving prices include:
- providing the regulated entity with a sustainable revenue stream
- allowing the regulated entity to recover its operational, maintenance and administrative costs
- allowing the regulated entity to recover its expenditure on renewing and rehabilitating existing assets
- allowing the regulated entity to recover costs associated with existing debt
- providing a rate of return on assets
- providing incentives for the sustainable use of Victoria's water resources.
In approving the price an entity can charge it customers, the ESC considers an entity's water plan. The plan specifies the outcomes the entity plans to deliver, how they will be achieved, and the revenue needed to deliver them over the life of the plan. It also outlines the entity's proposed operating and capital expenditure over the period of the plan.
A range of assumptions underpin the proposed revenue and expenditure forecasts. If actual and forecast figures vary, or the assumptions prove wrong, the actual financial performance and financial sustainability of the entity can fall short of the plan. For example, if customer growth is lower than expected or the level of water restrictions more severe than forecast, the price set may prove too low to generate the forecast revenue, negatively affecting the entity's net result or sustainability.
The ESC has the ability to re-open or review prices in the event of unforeseen circumstances if a water entity makes a submission.
Current water plans
The current approved water plans cover the period from 2008–09 to 2012–13. This represents the second regulatory period: the first water plan covered 2005–06 to 2007–08. The current plans provide for substantial increases in water prices to fund significant capital works, with price increases generally higher in the early years.
The plans were developed by the 19 entities during a time of ongoing drought with around a decade of below-average rainfall and the imposition of water restrictions. With many customers adopting water conservation measures the volume of water supplied in recent years has also been less than forecast resulting in revenue being less than forecast. Following a period of above average rainfall, and with water storages nearing capacity, especially in regional Victoria, there is now a risk that assumptions in the existing water plans are no longer appropriate and that revenue and expenditure will not be as forecast. In the event that revenue further reduces due to reduced demand for water, financial sustainability may be adversely affected.
The strategic direction and decisions of many entities may now need to change from those set out in the approved plans. For example, strategies that encourage water consumption may replace those that were previously aimed at securing supply.
Given that the financial sustainability of some water entities and sector categories has deteriorated it would be timely to revisit:
- the duration of water plans
- the appropriateness of the funding model and its flexibility when weather patterns change
- the rigour of the planning and forecasting by water entities.
This would enable the ESC and management of water entities to better assure a sustainable revenue stream.
4.3 Five-year trend analysis
This section analyses and comments on the trend for each of our six sustainability indicators for the past five years. The six indicators used are the:
- underlying result percentage
- interest cover ratio
- liquidity ratio
- debt-to-assets ratio
- self-financing percentage
- capital replacement ratio.
The indicators reflect each entity's funding and expenditure policies, and indicate whether these policies are sustainable.
Financial sustainability should be viewed from both a short-term and long-term perspective. The shorter-term indicators—the underlying result, interest cover, and liquidity indicators—focus on an entity's ability to maintain a positive operating cash flow and adequate cash holdings, and to generate an operating surplus over time.
The longer-term indicators—the self-financing, capital replacement and debt-to-assets indicators—identify whether adequate funding is available to replace assets to maintain the quality of service delivery and to meet community expectations and the demand for services.
4.3.1 Underlying result
The average underlying result has fluctuated over the five years; however, the results in 2010–11 are not too dissimilar to those of 2006–07.
Figure 4B
Average underlying result
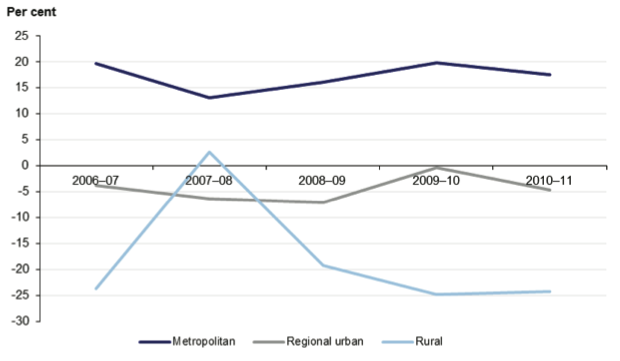
Source: Victorian Auditor-General's Office.
Key factors contributing to the fluctuating results include:
- the timing and magnitude of price increases approved by the ESC, as higher prices were generally levied in the early years of the five-year water plan
- the receipt of government grants, as illustrated by the rural sector in 2007–08
- the existence and severity of water restrictions and their associated impact on water consumption
- the need for water entities to purchase temporary water entitlements to guarantee water supply to enable the continuous provision of essential services
- the value of asset write-offs as a result of the construction and commissioning of new infrastructure assets
- the level of maintenance and repairs required due to increased incidences of burst mains and pipes because of the sustained period of below-average rainfall.
However, if operating deficits persist there is a risk that cash reserves will be depleted and expenditure on capital programs will need to be funded by new borrowings or be curtailed. In particular, expenditure that is perceived to be discretionary, especially for maintenance, may need to be deferred or abandoned.
Figure 4C shows that the underlying result deteriorated in 2010–11 with 37 per cent of water entities (seven of 19) reporting a net loss, an increase of 10 per cent from 2009–10.
Figure 4C
Underlying result risk assessment
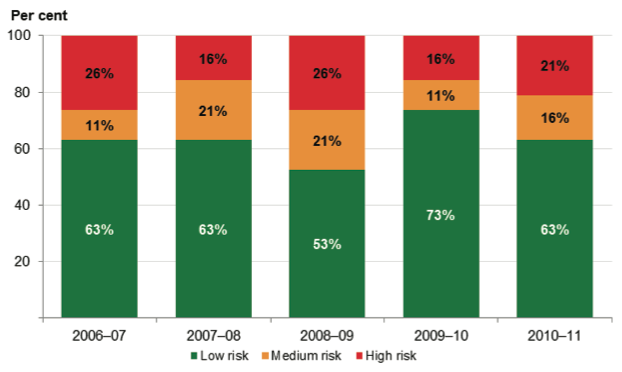
Source: Victorian Auditor-General's Office.
The overall decline in 2010–11 relative to the prior year reflects the impact of:
- lower water consumption as a result of above average rainfall during the year
- higher finance costs
- higher depreciation expense
- the write-off of assets or write down of impaired assets during the period.
The higher finance costs were driven by a substantial increase in borrowings across the sector from 1 July 2008 to finance the construction of infrastructure. This in turn has increased the value of assets and contributed to an increase in depreciation. The revaluation of infrastructure assets by the four metropolitan water entities in 2009–10 also contributed to higher depreciation expenses in 2010–11.
Figure 4C shows that over the five-year period, the number of entities in the high and medium-risk categories has shifted. With the exception of 2008–09 and 2009–10 the number of entities in the low-risk category has remained stable.
4.3.2 Interest cover
Figure 4D shows that the average interest cover varied by sector over the five years.
Figure 4D
Average interest cover ratio
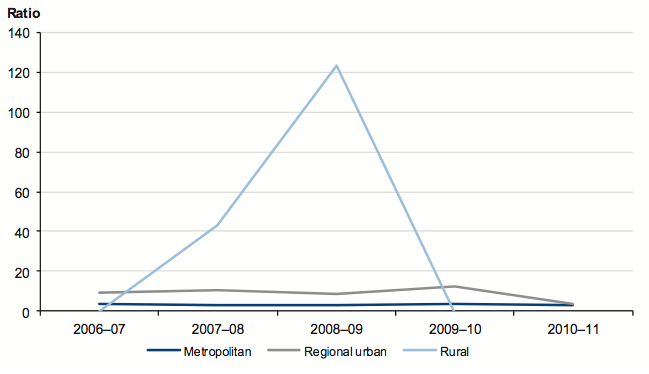
The four metropolitan water entities maintained a consistent and adequate level of interest cover over the period. While their debt levels and finance costs increased significantly, they continue to generate strong profits and positive cash flows from their operations annually.
In contrast, 11 of the 13 regional urban water entities experienced a deteriorating level of interest cover over the period. Finance costs rose because of additional borrowings; however profits and operating cash inflows remained stable or declined. Despite this, the level of interest cover is still adequate for the majority.
When analysing the trend of the rural entities the financial performance and position of the two entities need to be considered individually as the result for each is quite different.
For the past two years G-MW generated negative operating cash flows, that is, cash payments have exceeded cash receipts. As a result, it had no interest cover. The entity was unable to service the finance costs associated with its existing debt from the cash flows generated by its day-to-day operations. Drawing on new borrowings to pay operating costs is not sustainable in the long term.
Southern Rural Water by comparison generated positive operating cash flows over the period. Interest received also exceeded interest paid. The entity has a strong ability to service its debts and meet ongoing interest payments.
Accordingly, the overall downward trend for the rural water entities has been driven by G-MW.
Figure 4E indicates that the interest cover risk was assessed as low for 74 per cent of water entities (14 of 19) at 30 June 2011.
Figure 4E
Interest cover risk assessment
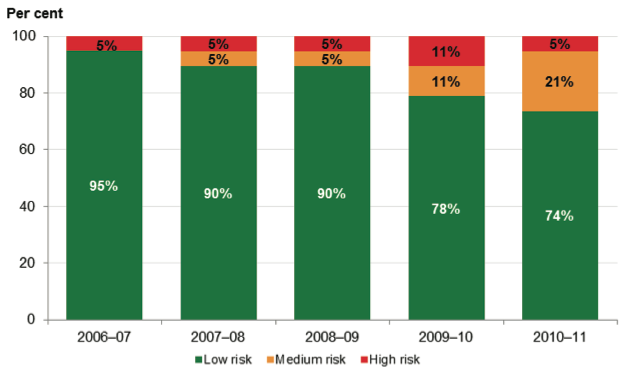
Source: Victorian Auditor-General's Office.
The interest cover for the one entity rated as high risk was insufficient to cover its ongoing finance charges, indicating immediate financial sustainability concerns.
Twenty-one per cent of entities (four of 19) were assessed as at medium risk, that is, concerns about financial sustainability may arise in the medium term. Management should closely monitor the financial performance of these five entities and implement strategies to improve their financial sustainability.
The number of entities in the medium-risk category increased in 2010–11, reflecting a shift from the high- and low-risk categories during the year. Over the five-year period the number of entities in the low-risk category has consistently decreased.
4.3.3 Liquidity
Figure 4F shows that the average liquidity of the water entities has deteriorated over the five years, most significantly in the regional urban and rural categories.
Figure 4F
Average liquidity ratio
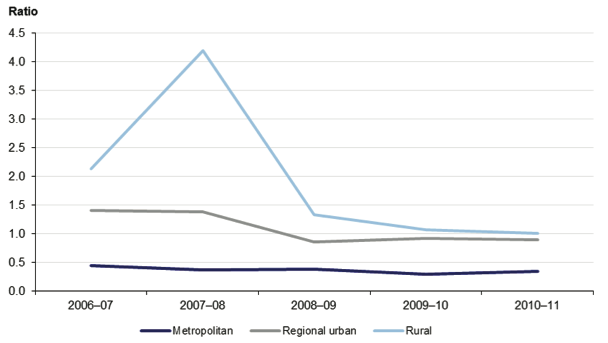
Source: Victorian Auditor-General's Office.
The decline is a consequence of increased borrowings and payables, driven by the significant increase in capital works activity. Lower water consumption also adversely affected revenue generated and available cash reserves. After a decade of below average rainfall and water restrictions, 2010–11 was one of the wettest years on record.
The 19 entities source their borrowings from the Treasury Corporation of Victoria with debt maturing within the next 12 months classified as a current liability at balance date. However, the entities have approval to refinance the maturing debt and in recent years have refinanced their debt.
While entities have approval to refinance maturing debt, they need to generate sufficient cash flows from operations to:
- service the increasing interest charges as debt levels increase and the variable interest rates rise
- repay the growing debt in the long term.
Figure 4G indicates that 74 per cent of water entities (14 of 19) at 30 June 2011 were assessed at high or medium risk for liquidity, that is, their current liabilities exceeded current assets.
Figure 4G
Liquidity risk assessment
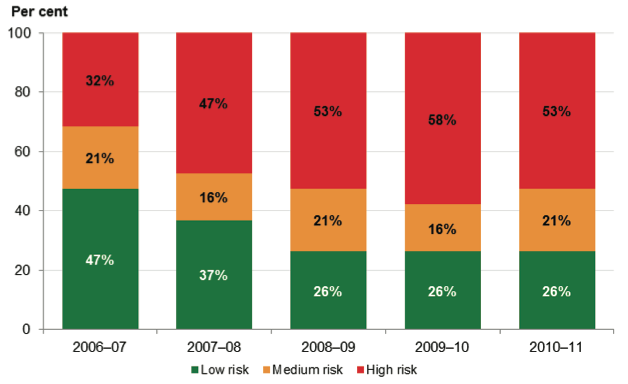
Source: Victorian Auditor-General's Office.
For 53 per cent of entities (10 of the 19) the liquidity ratio was less than 0.7 for the past three years.
While consistent with the past three years, the number of entities with poor liquidity has increased by 21 per cent since 2006–07.
4.3.4 Debt-to-assets
Figure 4H summarises the average debt-to-assets ratio for the water industry by sector over the past five years. The graph indicates that an entity's reliance on debt to fund their assets does vary depending on the sector.
Figure 4H
Average debt-to-assets ratio
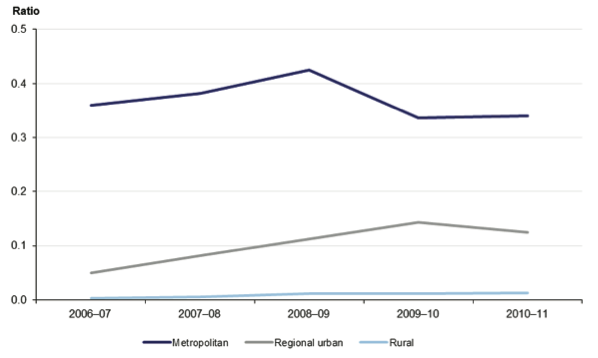
Source: Victorian Auditor-General's Office.
Over the five years the rural entities maintained a low debt-to-assets ratio indicating limited reliance on debt to fund the assets they manage. Regional urban entities increased their level of debt to fund the acquisition of new assets. By contrast, the metropolitan entities continued to fund a larger proportion of their assets through debt.
For the metropolitan entities the ratio decreased sharply in 2009–10 as a result of the sector recording infrastructure assets at fair value for the first time. The regional urban and rural entities transitioned to fair value in 2010–11, with the revaluation contributing to the slight improvement in the sectors' level of gearing.
Figure 4I indicates that all entities, with the exception of one entity in 2008–09, maintained an adequate level of gearing over the period.
Figure 4I
Debt-to-assets risk assessment
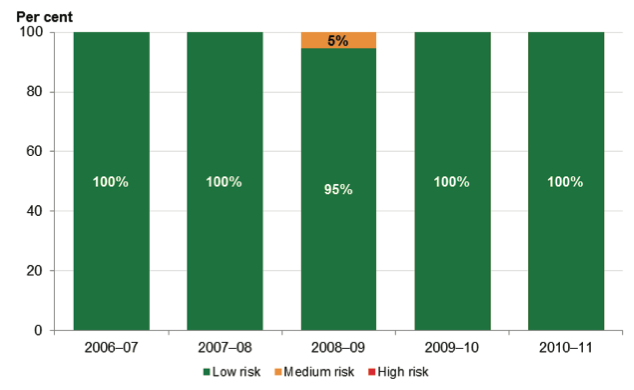
Source: Victorian Auditor-General's Office.
4.3.5 Self-financing
Figure 4J shows that over the five years, the average self-financing ratio fluctuated on a yearly basis. However, the result in 2010–11 is similar to that of 2006–07.
Figure 4J
Average self-financing indicator
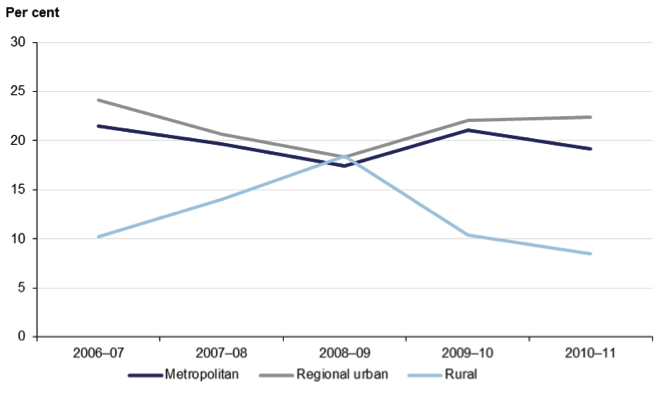
Source: Victorian Auditor-General's Office.
The timing and magnitude of water price increases has a direct impact upon a water entity's revenue and the cash flows from operations. An entity's ability to control operating costs during the period of lower water consumption also impacts the net cash flows from operations. A downward movement in the self-financing indicator indicates that an entity's ability to fund new assets or replace existing assets using cash generated by their operations has declined.
Figure 4K shows that in 2010–11, 21 per cent of entities (four of 19) had self-financing ratios with a high-risk rating compared with 11 per cent (two of 19) in 2009–10.
Figure 4K
Self-financing risk assessment
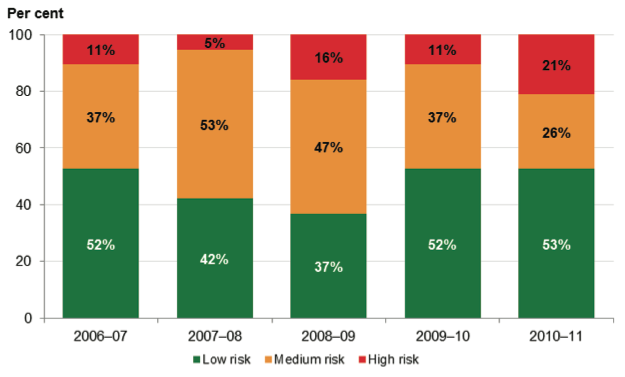
Source: Victorian Auditor-General's Office.
This was a significant increase in the number of entities assessed as being unable to replace their assets over the long term using income generated by their operations. These entities must rely on new borrowings or funds generated in the future for asset renewal and replacement.
While the number of entities in the low-risk category remained stable over the five years, there has been a movement from the medium-risk category to high risk.
4.3.6 Capital replacement
Figure 4L shows the average capital replacement indicator fluctuated over the five years.
Figure 4L
Average capital replacement indicator
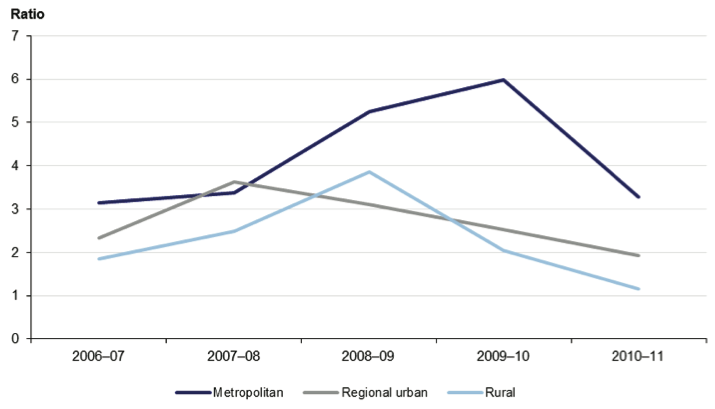
Source: Victorian Auditor-General's Office.
The downward trend indicates that depreciation expense increased at a rate higher than the level of spending on infrastructure assets. However, caution is required when interpreting these results as annual spending on assets includes new and expanded facilities, in addition to existing facilities but excludes the cost of newly constructed assets that are transferred from another entity.
For the metropolitan water entities the decline in 2010–11 reflects the impact of the revaluation of infrastructure assets in 2009–10. Depreciation expense increased significantly in the current year as a result of the higher asset values.
The Food Bowl Modernisation program, which aims to provide the Goulburn Murray Irrigation District with an irrigation delivery system that will reduce water losses and assist with the region's economic viability, must be considered when analysing the level of capital spending by the rural entities, in particular G-MW.
The State Owned Enterprise for Irrigation Modernisation in Northern Victoria, trading as NVIRP, was established in December 2007 to deliver the $2 billion system. Ownership and responsibility for the operation of the new irrigation infrastructure is being transferred from NVIRP to G-MW as discrete parts of the capital works are completed. At 30 June 2011 infrastructure assets with a value of $190.7 million had been transferred from NVIRP to G-MW.
Figure 4M indicates one water entity had a capital replacement indicator of equal to, or less than, one in 2010–11, which indicates the level of spending has not kept pace with the consumption of assets.
Figure 4M
Capital replacement risk assessment
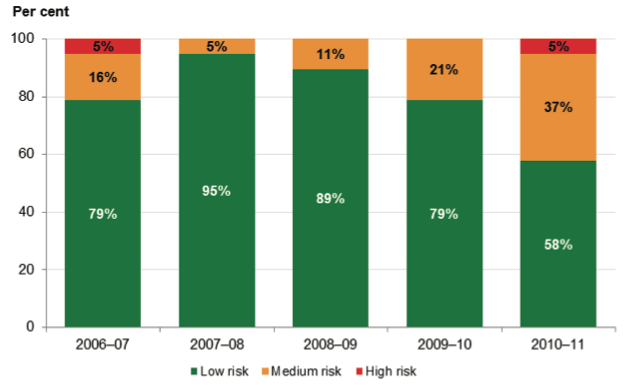
Source: Victorian Auditor-General's Office.
The shift over the five years from low to medium risk is significant and indicates a need to give greater attention to this area.
Recommendation
- That the Essential Services Commission revisit the duration of water plans, the appropriateness of the funding model and its flexibility in times of changed weather patterns and the rigour of the planning and forecasting by water entities.
5 Performance reporting
At a glance
Background
Sixteen of the 19 water entities are required to include an audited statement of performance in their annual report. The three water entities that report under the Corporations Act 2001 are encouraged to include these reports.
Conclusion
A contemporary performance reporting framework is yet to be developed for the water industry. The usefulness of the performance reports is limited because targets were not set for a number of indicators and the relevance and appropriateness of indicators requires review.
Findings
- Melbourne Water was included in the list of entities required to prepare a performance report and submit it for audit. The three water entities that report under the Corporations Act 2001 included performance information within their annual report, however, that information was not subject to audit.
- The key performance indicators were revised during 2010–11 by the Department of Sustainability and Environment and explanatory material to assist entities with their performance reports was amended.
- Five entities prepared performance reports that included indicators not required by the directives issued under section 51 of the Financial Management Act 1994.
- 12 of the 16 (13 of the 15 in 2009–10) performance reports included indicators without targets.
Recommendations
- That the Department of Sustainability and Environment in conjunction with the Department of Treasury and Finance develop a consistent and contemporary performance reporting framework for the 19 water entities.
- That a working party, comprising key stakeholders, be established to develop relevant and appropriate key performance indicators for inclusion in future performance reports of water entities.
5.1 Introduction
The Audit Act 1994 provides the Auditor-General with a mandate to audit any performance indicators in the report of operations of an audited entity to determine whether they:
- are relevant to any stated objectives of the entity
- are appropriate for the assessment of the entity's actual performance
- fairly represent the entity's actual performance.
The annual attest audit on the performance report of water entities expresses an opinion on whether the actual results reported present fairly and in compliance with the legislative requirements.
This Part sets out the current status of performance reporting by the water industry and signals our intention to further develop our audit of the performance reports.
5.2 Elements of effective performance reporting
Effective performance measurement and monitoring enables managers and the governing boards of entities to evaluate performance against a set of key indicators, and facilitates appropriate and timely action to achieve organisational objectives and outcomes. Reporting on performance to senior management and the community is an important part of a performance management framework and public sector accountability.
Central to effective performance measurement, management and reporting is a comprehensive suite of relevant and appropriate performance measures or indicators, and targets.
Relevant indicators have a logical and consistent relationship to an entity's objectives and are linked to the outcomes to be achieved. Ideally they should take into account immediate deliverables and long-term sustainability.
Appropriate indicators give enough information to assess the extent to which the entity has achieved a predetermined target, goal or outcome. They can include the trends in performance over time, performance relative to the performance of similar agencies, and performance relative to predetermined benchmarks.
Fair presentation of performance results requires that the information provided is capable of measurement, represents what it purports to indicate consistently and without bias, and is accurate and auditable.
5.3 Performance reporting by the water entities
Financial Reporting Direction (FRD) 27A Presentation and Reporting of Performance Information required water entities subject to the Financial Management Act 1994 to include in their annual report an audited statement of performance.
The 13 regional urban water entities have each prepared and submitted a performance report for audit since 2003–04. Rural water entities have done so since 2005–06.
5.3.1 Developments in 2010–11
In June 2011, the Department of Treasury and Finance (DTF) issued FRD 27B Presentation and Reporting of Performance Information, an update of FRD 27A. The key change was the inclusion of Melbourne Water in the list of entities required to prepare a performance report and submit it for audit. Consequently, 16 water entities (15 entities in 2009–10) are now required to prepare and submit a performance report for audit.
FRD 27B does not require the three water entities that are not public bodies, namely City West Water, South East Water and Yarra Valley Water, to comply with the direction. However, their compliance is encouraged.
FRD 27B applies to reporting periods commencing on or after 1 July 2010.
The key performance indicators to be included in the performance report were reviewed and revised during the 2010–11. As a result the regional urban and rural entities no longer report against indicators such as long-term profitability, owner's investment and operating efficiency.
The directives issued under section 51 of the Financial Management Act 1994 specify the required format, content, and indicators to be included in the performance report. The indicators vary across the three water sectors. Figure 5A summarises the number of indicators by sector.
Figure 5A
Number and nature of performance indicators by sector
Sector |
Number of financial indicators |
Number of non-financial indicators |
Total |
|---|---|---|---|
Metropolitan |
|||
Wholesaler |
6 |
10 |
16 |
Retailers |
6 |
12 |
18 |
Regional urban |
4 |
12 |
16 |
Rural |
4 |
– |
4 |
Source: Victorian Auditor-General's Office.
Appendix G provides further detail on the financial and non-financial indicators reported against by the entities.
Explanatory material, which includes a performance report template, was amended by the Department of Sustainability and Environment (DSE) during 2010–11 to clarify the expectations of the government and improve the quality and consistency of reporting by the water entities.
5.4 Analysis of performance reports submitted for audit
The 16 performance reports submitted for audit received a clear opinion. The key observations in 2010–11 were:
- five of the 16 entities (31 per cent) prepared and submitted for audit a performance report that included indicators not specified by the directives issued under section 51 of the Financial Management Act 1994
- 12 of the 16 performance reports included indicators without targets (13 of the 15 in 2009–10)
- a total of 72 non-financial indicators reported did not have targets (112 in 2009–10)
- the commentary for some significant variations in performance focused on the value of the change rather than the factors that led to it.
When performance indicators have no related targets the usefulness of performance reports are reduced because a comparison of actual performance against the target cannot occur.
VAGO's report titled Water Entities: Results of the 2008–09 Audits concluded that it was timely that the relevance, appropriateness and usefulness of the indicators be reviewed. It was recommended that DSE in conjunction with DTF develop a consistent and contemporary performance reporting framework.
While performance reporting arrangements were revisited in 2010–11, there is still opportunity for improvement.
5.5 Future audit approach
When performance reporting for the sector was first introduced and being established, VAGO focused on auditing whether the results fairly represented performance, and complied with the legislative requirements.
Given that performance reporting has been in place within the sector for more than five years, it is now intended that future audit opinions relating to the performance report will conclude on the relevance and appropriateness of the performance indicators presented. It is intended that this approach be in place from 2012–13 onwards.
During consultation regarding the proposed approach, representatives from both DSE and VicWater, the peak industry body, indicated support for the establishment of a working party with responsibility for developing relevant and appropriate indicators to be included in a performance report. They indicated that the working party may comprise representatives from DSE, DTF, VicWater and the water entities.
An initial task of the working group would be the development of criteria to assess the relevance and appropriateness of the indicators to be included in a performance report.
A transitional plan that considers the corporate plan time lines will also be critical as the water entities will require time to set targets and gather data for any new indicators to be reported.
Recommendations
- That the Department of Sustainability and Environment in conjunction with the Department of Treasury and Finance develop a consistent and contemporary performance reporting framework for the 19 water entities.
- That a working party, comprising key stakeholders, be established to develop relevant and appropriate key performance indicators for inclusion in future performance reports of water entities.
6 Internal controls
At a glance
Background
This Part presents the results of our assessment of general internal controls over declarations of interests, valuation of assets and outsourcing in water entities.
Conclusion
Internal controls at water entities were adequate for producing reliable, accurate and timely financial reports. Nevertheless, a number of areas requiring improvement were identified.
Findings
- Sixty-nine per cent of general control weaknesses related to information technology. The weaknesses in nine of 20 entities (45 per cent) related to information systems change management, password settings, systems access rights, disaster continuity and recovery planning, information system policies and procedures, or the operation or review of systems logs relating to financial databases.
- Controls at regional urban and rural water entities enabled problems with the revaluation of infrastructure assets to be identified, and ultimately redressed; delays could have been avoided through earlier and better communication of the methodology and assumptions underpinning the calculations.
Key recommendations
That water entities:
- assess their policies and processes against the commonly identified internal control environment weaknesses and act to address them to make sure they are operating reliably and cost-effectively
- work with the Department of Treasury and Finance and the Valuer-General Victoria to determine the most appropriate valuation methodology for infrastructure assets
- report regularly to their boards on outsourced activities to enable effective monitoring of performance, including of actual performance against key performance indicators in contractual arrangements, risk mitigation activity, cost-benefit analysis, and actual costs against budget.
6.1 Introduction
Effective internal controls help entities reliably and cost‑effectively meet their objectives. Reliable internal controls are a prerequisite for the delivery of reliable, accurate and timely external and internal financial reports.
In our annual financial audits, we focus on the internal controls relating to financial reporting and assess whether entities have managed the risk that their financial report will not be complete and accurate. Poor internal controls diminish management's ability to achieve their entity's objectives and comply with relevant legislation. They also increase the risk of fraud and error.
The governing body of each water entity is responsible for developing and maintaining adequate internal controls to enable:
- preparation of accurate financial records and other supporting information
- timely and reliable external and internal reporting
- appropriate safeguarding of assets
- prevention and detection of errors and other irregularities.
The Standing Directions of the Minister for Finance require management to implement effective internal control structures.
In this Part we report on aspects of internal controls in the state's 19 water entities and one controlled entity. At the 19 water entities we address general internal controls and controls over:
- asset valuations
- declarations of interests
- outsourcing.
6.2 General internal controls
Internal controls at water entities and the controlled entity were adequate for maintaining the reliability of financial reporting. Nevertheless, we identified a number of instances where important internal controls need to be strengthened. These matters were reported to the related entity's governing body and management team.
The commonly identified areas that require improving were:
- information system controls
- payroll
- billing systems and receivables.
Figure 6A sets out the financial areas and systems that had the highest occurrence of weaknesses in 2010–11. Sixty-nine per cent of findings were associated with information technology.
Figure 6A
Occurrence of controls weaknesses by account balance and system
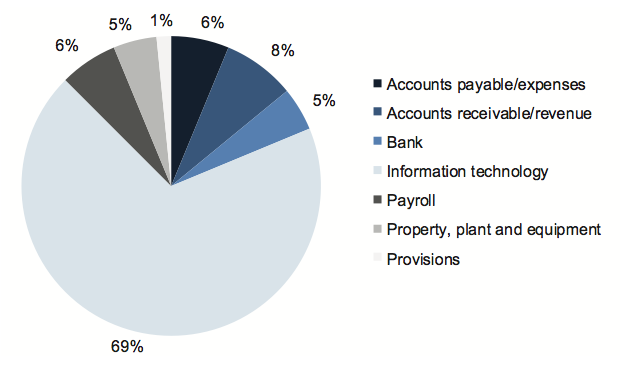
Source: Victorian Auditor-General's Office.
6.2.1 Information system controls
Information system controls protect computer applications, infrastructure and information assets from a wide range of security and access threats. Such controls promote business continuity, minimise business risk, reduce the risk of fraud and error and help meet business objectives.
There is extensive reliance placed on information systems across the water industry, and the continuous upgrade and replacement of systems to improve information management and the quality of services provided to the community. With the implementation and upgrade of new information technology (IT), and the on-going development of external threats, new security risks to the IT environment can arise.
Information held by water entities about employees, customers and suppliers, and the financial and operational aspects of the business can be highly sensitive. It needs to be protected from unauthorised access, theft or manipulation.
Nine of the 20 entities (45 per cent) had control weaknesses relating to:
- information systems change management
- password settings
- systems access rights
- disaster continuity and recovery planning
- information system policies and procedures
- operation or reviews of systems logs relating to financial databases.
The information system control weaknesses were identified across the metropolitan, regional urban and rural sectors.
The following weaknesses identified in prior periods continue at three entities:
- lack of an information technology strategic plan
- limited monitoring to identify possible security events on the servers and databases
- lack of testing of business continuity or disaster recovery plans in recent years.
6.2.2 Payroll
Salaries and wages are a significant cost to entities. Adequate internal controls should therefore exist for the processing and monitoring of salaries and related costs to mitigate the risk of error, fraud or mismanagement.
Payroll control weaknesses were found at three of the 20 entities (15 per cent). The following common payroll related weaknesses were identified:
- masterfile amendments not reported
- termination pay calculations not independently checked prior to payment.
6.2.3 Billing systems and receivables
The billing system is a key financial reporting system for a water entity, given the materiality of the service and usage charges raised. Effective internal controls are critical and policies and procedures should clearly specify criteria for recognising revenue, and be responsive to changing circumstances.
While the internal controls were assessed as adequate, the following weaknesses were identified:
- long outstanding receivables not monitored and/or investigated in a timely manner
- absence of review of the methodology for calculating unbilled revenue accruals when environmental conditions impacting water consumption changed.
Weaknesses in controls over billing systems and receivables were found at six of the 20 entities (30 per cent).
6.3 Controls over asset valuations
6.3.1 Background
At 30 June 2011 the water industry had total assets of $35.2 billion ($27.8 billion in 2009–10). Infrastructure assets, property, plant and equipment accounted for $34.0 billion ($26.8 billion in 2009–10) or 96 per cent of assets.
Australian Accounting Standard AASB 116 Property, Plant and Equipment allows an entity to measure its non-current physical assets, that is, its infrastructure assets, property, plant and equipment, either at cost or valuation.
Financial Reporting Direction FRD 103D Non-Current Physical Assets requires public sector entities to measure such assets at valuation. They are to be recorded at 'fair value' less any subsequent accumulated depreciation and accumulated impairment losses. Fair value is usually determined on market-based evidence. However, if no market evidence exists because of the specialised asset type or because the asset is rarely sold as a standalone unit, fair value may be estimated using an income or depreciated replacement cost approach.
Water entities have traditionally recorded land and buildings at fair value. Infrastructure assets, however, have been recorded at cost because FRD 121 Infrastructure Assets (Water/Rail) provided the industry with an exemption from the fair value approach.
In 2009–10 the four metropolitan water entities used the valuation model for all asset categories for the first time.
The 13 regional urban and two rural water entities transitioned to fair value in 2010–11, having been granted an additional 12 months to validate and update information within their asset systems.
The metropolitan water businesses use an income approach to determine fair value, that is, a discounted cash flow method that requires the determination of an appropriate discount rate and the projection of future cash flows. The regional urban and rural water entities determine fair value using depreciated replacement cost, that is, the current replacement cost of an asset less, where applicable, accumulated depreciation calculated on the basis of such cost to reflect the already consumed or expired future economic benefits of the asset. The varied approach is driven by the 'for‑profit' and 'not-for-profit' designation applied to the entities under the financial reporting requirements.
Figure 6B summarises the movement in asset values due to revaluations over the past two years.
Figure 6B
Movement in asset values due to the asset revaluations
|
Sector |
Increase in land values ($mil) |
Increase in building values ($mil) |
Increase in infrastructure values ($mil) |
Total increase ($mil) |
|---|---|---|---|---|
|
2009–10 Metropolitan |
47.2 |
– |
4 845.8 |
4 893.0 |
|
Total |
47.2 |
– |
4 845.8 |
4 893.0 |
|
2010–11 Metropolitan |
393.5 |
– |
243.0 |
636.5 |
|
Regional urban |
54.6 |
6.9 |
2 782.9 |
2 844.4 |
|
Rural |
12.1 |
(0.8) |
2 473.9 |
2 485.2 |
|
Total |
460.2 |
6.1 |
5 499.8 |
5 966.1 |
Note: Only the metropolitan entities performed a revaluation in 2009–10.
Source: Victorian Auditor-General's Office.
The 19 water entities were required to revalue their land, buildings and infrastructure assets during 2010–11, even if an independent revaluation had been conducted in the prior period.
6.3.2 Asset valuation framework
As Figure 6B shows, the revaluation of land, buildings and infrastructure assets can significantly alter the values disclosed in an entity's financial report. Effective internal controls in relation to asset valuations are therefore important and will mitigate the following strategic and operational risks:
- failure to engage, understand and manage the valuation process
- lack of co-ordination with stakeholders
- lack of data integrity
- inability to maintain accurate and current asset information
- recording of incorrect asset values
- failure to comply with regulatory and legislative requirements.
Effective asset valuation controls and processes include:
- comprehensive policies and procedures
- appropriate management practices
- sound governance and oversight.
Figure 6C outlines the key elements of an effective asset valuation management framework. It draws on the requirements of the:
- Australian Accounting Standards
- Financial reporting directions issued by the Minister for Finance
- Australian Auditing Standards
- Financial Management Act 1994.
Figure 6C
Key elements of an effective asset valuation framework
|
Component |
Key elements |
|---|---|
|
Policies and procedures |
Measurement and valuation of non-current physical assets policy and guidelines exist and:
Policy and guidelines approved by the board. |
|
Management practices |
Terms of engagement with the qualified valuer documented and agreed with management, and align with the requirements of the exercise. Comprehensive and regular reporting to management and board. Relevance of valuation methodology reviewed. Reasonableness of the valuation result assessed considering:
Recommendation by management to the board regarding adoption of valuation results. Management review of policy, procedures and practices periodically. |
|
Governance and oversight |
Policy and procedures approved by the board. Periodic review of policies by management and board. Compliance with approved policy and procedures monitored. Proposed valuation methodology reviewed. Reasonableness of the fair values assessed. Fair values adopted for financial reporting. |
Source: Victorian Auditor-General's Office.
We assessed the asset valuation framework of the 19 water entities by considering the above elements.
Controls over asset valuations were adequate, although improvements can be made by developing more comprehensive policies and by enhancing the monitoring and oversight activities.
6.3.3 Policies and procedures
Existence of asset valuation policies and procedures
Comprehensive policies enable boards and management to communicate the responsibilities and expectations of staff, and to align an entity's operations with its strategic direction. Documented policies and procedures also provide guidance for staff in executing their day-to-day tasks and should facilitate consistency. They make it easier to identify control weaknesses or instances of non-compliance.
Only 10 of 19 water entities (53 per cent) had an asset valuation policy. For six of the 10 it had been at least two years since the policies had been reviewed. A number of entities indicated that they regard FRD 103D or the accounting policy at Note 1 of their financial report as being a sufficient substitute to a policy. However, we consider that neither document encompasses all elements of a comprehensive policy.
It is of concern that nine of 19 water entities (47 per cent) did not have an asset valuation policy. The water entities were advised in November 2008 that they were required to adopt the revaluation model for all classes of non-current physical assets by 2009–10 or 2010–11.
Adequacy of established policies and procedures
One water entity had asset valuation policies and procedures that contained the desired elements set out in Figure 6C.
Another had detailed asset policies and procedures although some content was out‑dated. For example, the policy stated that infrastructure assets are measured at cost when in fact they had been measured at fair value for the past two years.
Of the 10 water entities that had policies and procedures, the majority:
- incorporated an objective—90 per cent
- specified the scope of the policy—100 per cent
- identified when the policy was in effect from—80 per cent
- set out the frequency at which the policy should be reviewed and updated—60percent
- identified responsibility for approving changes to the policy—60 per cent
- specified the valuation approach for determining fair value—80 per cent
- referred to the requirements of the financial reporting framework and outlined the requirements that applied to the entity—100 per cent.
However, 50 per cent of the policies and procedures did not require assets to be valued at a component level.
6.3.4 Management practices
Terms of engagement of independent valuer
In 2010–11 the valuation of land, buildings and infrastructure assets for the water industry was managed and coordinated by the Valuer-General Victoria (VGV) to achieve consistency in the methodology applied across the sectors. Given the specialised nature of the assets, VGV engaged a firm of valuers specifically to value the infrastructure assets of the regional urban and rural water entities.
The four metropolitan water entities engaged their own valuers to value their infrastructure assets, as they use an income approach rather than depreciated replacement cost to determine fair value.
VGV engaged separate valuers to value the land and buildings of the entities.
Figure 6D sets out a chronology of events related to the engagement and valuation of infrastructure assets of the regional urban and rural water sector entities in 2010–11.
Figure 6D
Infrastructure asset valuation time line
|
Date |
Event |
|---|---|
|
June 2010 |
Entity asset data analysed by VGV to understand nature of assets and assess quality of data for asset valuation purposes. Project scoped and tender documents prepared by VGV. |
|
July 2010 |
Email from VGV provided entities with overview of proposed valuation methodology. Fair value to be determined by reference to depreciated replacement cost. Approach to use mix of physical inspections and desktop assessments. VGV to review valuation reports for completeness, accuracy, substance and consistency. Process to commence July 2010. Completion February 2011. VAGO supportive of approach involving depreciated replacement cost given specialised nature of assets. |
|
July and August 2010 |
VGV provided the water entities with a summary of assets selected for physical inspection and sought entity feedback. |
|
September and October 2010 |
Tender process commenced and submissions evaluated. |
|
November 2010 |
Letter from VGV to entities detailing:
Contract between VGV and preferred valuer not yet signed. |
|
December 2010 |
VGV preferred valuer requests asset data from the water entities. |
|
January 2011 |
Preferred valuer determined that the water entities maintained different management and financial systems, and that asset records and the quality of asset data varied. |
|
February 2011 |
Contract between VGV and valuer signed, after contract clause issues resolved. Commencement of project delayed due to contract delay. Valuation reports to be available May or June 2011. Entities briefed on methodology and process by valuer. Valuer sought assistance from VGV to obtain asset data from entities that had not provided requested data. |
|
March and April 2011 |
Assets inspected and condition assessed by valuer. |
|
May and June 2011 |
Draft valuation reports to entities for review and comment. Entities initially given three days to do so. Use of condition based consumption curve and non-linear assumptions to determine depreciated replacement cost was questioned by entities. Data integrity and quality assurance issues raised by entities and reasonableness of values produced questioned. |
|
July 2011 |
A number of entities reject initial valuation. Department of Treasury and Finance, Department of Sustainability and Environment, and VAGO agreed certain assumptions to determine fair value for financial reporting purposes were to be revised. |
|
August 2011 |
Final valuation reports progressively issued. |
|
Late August and early September 2011 |
Financial reports finalised. All annual reports printed and available for tabling in Parliament by 15 September 2011. |
Source: Victorian Auditor-General's Office.
Clear terms of engagement establish a common understanding and provide the basis for an individual or team to undertake an agreed assignment. They also enable monitoring of progress against key milestones and provide a basis against which the success of an assignment can be measured.
While contractual arrangements between VGV and the preferred contractors should be finalised in a timely manner, it is also important that the proposed methodology be discussed and agreed with entities before the valuations commence.
This serves to reduce the risk of material misstatement of values, wasted time and effort and delays to finalisation of financial reports due to concerns raised at the eleventh hour.
Regular and comprehensive reporting to management and the board
The board and/or audit committee of each water entity was briefed by management in relation to the revaluations, with the valuation of infrastructure assets the subject of much debate. The briefings occurred on a monthly or quarterly basis.
Valuation methodology reviewed
Management is ultimately responsible for an entity's financial report and for making recommendations to the board and/or audit committee.
Each of the 19 water entities reviewed the valuation reports and assessed the relevance and appropriateness of the methodology used to value land, buildings and infrastructure assets.
Of the 13 regional urban and two rural entities, 11 had reservations with the methodology with six indicating they would reject the initial valuation. Five indicated that they would accept the fair value if audit was satisfied with the valuation methodology. This situation highlights the need for improved effectiveness of co-ordination, management and oversight within and across these entities.
Assessing the reasonableness of the valuation
When assessing the reasonableness of the fair values generated by the asset valuation, management should consider:
- the appropriateness of sample selection, sample size and mix of physical and desktop assessments
- the appropriateness of the unit costs
- whether an asset's condition was considered when assessing useful lives
- whether the movement in asset value is reasonable given their understanding of the assets.
The majority of the 19 water entities considered these matters when assessing the reasonableness of the revaluations, specifically:
- 84 per cent considered sample selection, sample size and mix of physical and desktop assessments
- 89 per cent considered the appropriateness of the unit costs
- 89 per cent considered asset condition when assigning useful lives
- 89 per cent considered the reasonableness of the movement in asset values given their understanding of the assets revalued.
Eight-nine per cent also considered whether the valuation had been performed at a major component level.
Detailed analysis of the valuation reports by management identified errors that included instances of missing data, duplicated data and calculation errors. A number of entities also sought clarification from the valuer regarding the appropriateness of the unit rates applied as some led to unreasonably high movements in the asset values. The valuation reports were revised as appropriate.
While the errors were subsequently corrected and queries addressed, the number and type of errors and adjustments required suggest that the quality assurance processes at the VGV and valuer should be improved.
Recommendations by management to the board
Following the satisfactory resolution of issues identified during the review of the draft valuation reports, management at the 19 water entities recommended that their board adopt the fair values for financial reporting purposes.
6.3.5 Governance and oversight
Governance and oversight exercised by the boards over the valuation exercise was appropriate. For example:
- the boards of 80 per cent of the 10 water entities with asset valuation policies and procedures had reviewed and approved their policies and procedures
- the valuation methodology and fair values were subject to a high level of scrutiny by entity management and boards
- the land, building and infrastructure asset fair values stemming from the asset revaluation were considered and adopted by the boards.
6.4 Controls over declarations of interests
The Public Administration Act 2004 and the Code of Conduct for Victorian Public Sector Employees require officers of public sector agencies to avoid any real or perceived conflicts of interest.
The Water Act 1989 requires board members and nominated officers of the 16 water corporations, namely Melbourne Water, the 13 regional urban and the two rural water entities to disclose all conflicts of interest:
- as part of primary and ordinary returns
- at board and sub-committee meetings.
A primary return is completed by a board member and/or a nominated officer upon their appointment. An ordinary return is required to be completed by each board member and/or a nominated officer at 30 June every year.
Primary and ordinary returns must disclose:
- the name of any company or other body in which the board member or nominated officer held an office as director or otherwise
- the name or description of any company, partnership, association or other body in which the board member and/or nominated officer holds a beneficial interest which exceeds $2 000 in value
- the address or description of any land in any district of the water corporation or in a district which adjoins a district of the water corporation
- a description of any trust in which the board member and/or nominated officer holds a beneficial interest or is a trustee
- any other substantial interest.
Within an ordinary return the board member and/or nominated officer is also required to disclose particulars of any gift of $2 000 or more in value received from a person other than a relative.
Regular and timely disclosure is required once a potential or actual conflict of interest is identified. The person affected is responsible for declaring and mitigating the conflict.
The management of real or perceived conflicts of interests is important for effective governance. It is intended to mitigate the risks that:
- dealings are not honest, open and transparent
- any real or apparent conflicts of interest are hidden
- decisions are made with bias, caprice, favouritism or self-interest
- behaviours that violates laws, rules or regulations, represents corrupt conduct or mismanagement of public resources do not happen
- transactions do not comply with legislative requirements.
6.4.1 Declaration of interests framework
The key elements of an effective declaration of interests management framework are detailed in Figure 6E. It draws on the:
- requirements under the Water Act 1989
- State Services Authority's Conflict of Interest Policy Framework
- New South Wales Independent Commission Against Corruption and the Queensland Crime and Misconduct Commission's joint publication, Managing Conflicts of Interest in the Public Sector.
Figure 6E
Key elements of an effective declaration of interests framework
|
Component |
Key element |
|---|---|
|
Policies and procedures |
Declaration of interests policy exists and:
Policy approved by the board. |
|
Management practices |
Declarations of interest completed by the directors and nominated officers. Declaration of interests returns (primary and ordinary returns) comply with the legislative requirements. A register of interests is updated on a regular basis. Training and support provided to the governing board and employees upon commencement and refresher training provided periodically. Register of interests used for year-end financial reporting purposes (that is, related party disclosure purposes), as applicable. Management review of policy, procedures and practices periodically. |
|
Governance and oversight |
Policy and procedures approved by the board. Compliance with approved policies and procedures monitored. Declarations of interests made by board members and nominated officers recorded in board and sub-committee minutes when made. Internal audit of compliance with declaration of interests requirements. |
Source: Victorian Auditor-General's Office.
We assessed the declaration of interests policies and practices of the 19 water entities by considering the above elements.
Controls over declarations of interests were adequate, although improvements can be made by developing more comprehensive policies and monitoring compliance with the approved policies and legislative requirements.
6.4.2 Policies and procedures
Existence of policies and procedures
Fifteen of 19 water entities (79 per cent) had policies and procedures relating to declarations of interests. The remaining four comprised one metropolitan water entity and three regional urban entities. In absence of a specific policy a number of those entities referred to their code of conduct, conflicts of interest and/or gift policy. However, given the legislative requirements of the Water Act 1989, one would expect a specific policy to exist.
Adequacy of established policies and procedures
None of the water entities had declaration of interests policies and procedures that contained all the desired elements set out in Figure 6E. Nevertheless, the policies and procedures were quite detailed. The majority of policies and procedures of the 15 entities:
- incorporated an objective—73 per cent
- specified the scope of the policy—93 per cent
- specified the date the policy was effective from—80 per cent
- contained references to state government requirements—80 per cent
- contained references to the legislative requirements under the Water Act 1989,as applicable—87 per cent
- referred to related policies—93 per cent
- specified when a declaration of interests should be declared—93 per cent
- specified when a declaration of interests return should be completed—87 per cent.
Conversely, the following were not included in many of the policies and procedures reviewed:
- the frequency at which the policy should be reviewed and updated—47 per cent
- who is responsible for approving changes to the policy—47 per cent
- the records that must be maintained and who has responsibility for maintaining a central register—40 per cent
- an explanation of the consequences for breaching the policy—53 per cent.
Policies of the metropolitan and regional urban entities were more comprehensive than those of the rural entities.
6.4.3 Management practices
Completion of declarations of interest
Declarations of interests returns were completed at all water entities, with just one return missing at the time of the audit. The returns complied with the legislative requirements of the Water Act 1989.
Register of interests
Water entities should maintain a register of interests detailing all declarations of interest made by board members and other nominated officers. Entities that did not maintain a register of interests did not comply with the Water Act 1989.
Water entities are to allow a person to inspect the register, if that person applies in writing and in accordance with the regulations. A record of individuals who access the register should be maintained. Sixty-eight per cent of entities had not received a request to access the register. Where entities had received a request, a record of individuals who accessed the register was maintained.
Eighty-nine per cent (17 of the 19) water entities maintained a register of interests. It is of concern that 11 per cent of water entities, that is, one metropolitan and one regional urban water entity, did not.
Training and support
It is important that board members and staff are aware of and understand an entity's expectations regarding declaration of interests to minimise the risk of actual or perceived conflicts arising and not being effectively managed. Ideally an induction program would cover declarations of interests and conflicts of interest and be supplemented with refresher training over time. The training should address the legislative requirements of the Water Act 1989.
Seventy-nine per cent of entities provided training to board members and nominated officers upon commencement. Fifty-three per cent provided refresher sessions.
The Water Group at the Department of Sustainability and Environment also runs an induction session for new board members.
Year-end financial reporting
An up-to-date declaration of interests register can assist management when preparing the financial report that is for the preparation of the related party disclosure.
Of the 17 entities that maintained a register of interests, 76 per cent considered the information captured by the register when preparing the related party note disclosure within their financial report.
6.4.4 Governance and oversight
Approval of policies and procedures
At 14 of the 15 entities with declaration of interests policies and procedures the board approved the policies and procedures. At one entity this responsibility was delegated to the managing director.
Monitoring of compliance and performance
Consistent with its responsibilities under legislation, the board is responsible for reviewing the adequacy of declaration of interests processes and assessing compliance with relevant internal policies and procedures and external requirements.
Ninety-three per cent of the boards with policies and procedures assessed compliance with legislation and their approved policies and procedures.
Board and sub-committee minutes
Declarations of interests and/or conflicts of interest were generally a standing agenda item at every board or sub-committee meeting. Our attendance at board and/or audit committee meetings during the year and review of board and sub-committee minutes confirmed this.
Internal audit
Internal audit can provide comfort that internal controls and processes are working as intended, and that the governance and risk management framework is in place and effective. Internal audits can assist water entities in achieving their desired outcomes, address shortcomings, and mitigate associated risks.
Over the past three years, only 32 per cent of water entities used internal auditors to assess the degree of compliance with the legislative requirements and the entity's policies and procedures relating to declarations of interests.
6.5 Controls over outsourcing
An entity may choose to outsource its activities when it does not have the specialised skills or competencies to conduct the activities, to allow greater focus on core business functions, or to gain cost-benefits from an outsourced arrangement.
The nature and extent of outsourcing varies across the metropolitan, regional urban and rural sectors. Figure 6F summarises the cost of outsourced activities by the water entities in 2010–11.
Figure 6F
Value of outsourced activities in 2010–11
|
Outsourced activity |
Metropolitan ($mil) |
Regional urban ($mil) |
Rural ($mil) |
Total ($mil) |
|---|---|---|---|---|
|
Capital works |
1 231.0 |
238.7 |
39.0 |
1 508.7 |
|
Operational expenditure |
260.2 |
82.3 |
50.8 |
393.3 |
|
Total |
1 491.2 |
321.0 |
89.8 |
1 902.0 |
Source: Victorian Auditor-General's Office.
Outsourced activity can be provided through an alliance, contract and/or managed contract. Management must decide on the most appropriate nature based on an entity's objectives, project specifications, capability, available resources and desired outcomes.
Figure 6G shows the proportion of the total value of outsourced activities by nature of engagement for 2010–11.
Figure 6G
Proportion of the total value of outsourced activities by nature of engagement – 2010–11
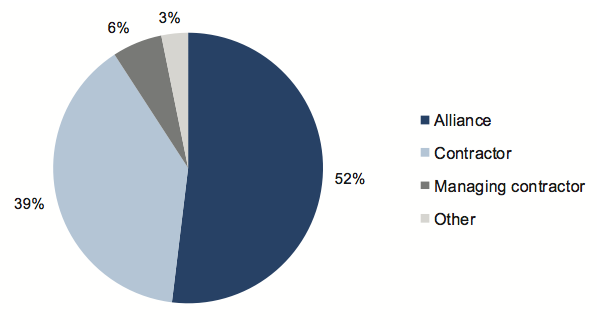
Source: Victorian Auditor-General's Office.
6.5.1 Outsourcing framework
Effective management of outsourcing can mitigate the following strategic and operational risks:
- reduced value-for-money for the government, the water entity and the community due to inadequate competition
- unnecessary costs from poorly managed processes
- probity deficiencies
- lack of transparency.
In establishing controls water entities should adopt an outsourcing management framework with:
- comprehensive policies and procedures
- appropriate management practices
- sound governance and oversight.
The key elements of an effective outsourcing management framework are further detailed in Figure 6H. This framework draws on the:
- VAGObetter practice guide on Public Sector Procurement: Turning Principles into Practice (October 2007)
- Victorian Government Purchasing Board procurement policies
- Department of Treasury and Finance guidance statements
- Financial Management Act 1994.
The framework provides entities with a comprehensive approach to managing outsourcing, and outlines best practice guidelines. The specific elements applied to each outsourcing exercise may vary depending on the value, volume and complexity of the goods or services being outsourced.
Figure 6H
Key elements of an effective outsourcing framework
|
Component |
Key element |
|---|---|
|
Policies and procedures |
Policy and procedures relating to the outsourcing of activities exist and:
Policy approved by the board. |
|
Management practices |
Cost-benefit analysis completed prior to outsourcing. Business case prepared and submitted to the board and/or a sub‑committee for approval. Due diligence on outsourcing arrangements undertaken with focus on supplier capacity to perform at the required quality level over the period of the agreement. Appropriate attention given to legal matters when drafting or revising outsourcing arrangements. Strategies in place for acquiring and transferring key knowledge regarding the capital or operating activity under the arrangement. Payments made in line with normal terms of trade and signed agreements. Agreements in place provide for entity to obtain a 'letter of comfort' over the adequacy of the internal controls of the service provider. Independent checks of data integrity under outsourced arrangements. Regular reporting to senior management and the board. Post implementation and progressive evaluation reviews of outsourcing arrangements. Management review of policy, procedures and practices periodically. |
|
Governance and oversight |
Policies and procedures approved by the board. Compliance with approved policy and procedures monitored. Activity/function to be outsourced approved by the board. Progressive review of the outsourcing arrangement and the expected benefits underpinning the outsourcing decision. Independent assessments of the integrity of the outsourcing arrangement and compliance with legislative requirements. Periodic review of policy by management and the board. |
Source: Victorian Auditor-General's Office.
We assessed the outsourcing framework of the 19 water entities by considering the above elements.
Controls over outsourcing were adequate, although improvements can be made by developing more comprehensive policies and by enhancing the monitoring and oversight activities.
6.5.2 Policies and procedures
Existence of policies and procedures
Fifty-eight per cent of water entities had policies and procedures that specifically addressed outsourcing. These comprised seven regional urban entities and one rural entity. A number of entities considered their procurement, purchasing and/or tendering policies and procedures adequately addressed outsourcing, a form of procurement.
Adequacy of established policies and procedures
The outsourcing policy and procedures of one water entity contained all of the desired elements set out in Figure 6H. Two water entities each lacked only one of the desired elements.
Of the 11 entities that had specific outsourcing policies and procedures, the majority reviewed incorporated:
- the frequency at which the policies and procedures should be reviewed and updated—55 per cent
- references to state government requirements—100 per cent
- a requirement for an evaluation of the risks associated with outsourcing, and specified when a business case and cost-benefit analysis was to be undertaken—55 per cent
- the involvement and role of a probity auditor—64 per cent.
The majority of the policies and procedures reviewed did not include:
- an outsourcing objective—82 per cent
- specification of the scope of the policy—55 per cent
- an outline of the likely accounting treatment and financial reporting implications for the outsourcing arrangement—73 per cent
- a requirement for assurance that internal controls of the provider operated effectively—73 per cent
- reporting requirements including the establishment of key performance indicators for monitoring performance of the provider—55 per cent.
6.5.3 Management practices
Probity and outsourcing evaluation arrangements
Our selective examination of service and capital work outsourced arrangements in progress at each of the entities indicated that the majority of entities had adequate probity arrangements in place. Specifically:
- 74 per cent had prepared business cases
- 89 per cent had approved the outsourcing activity in line with financial delegations
- 82 per cent had undertaken a due diligence review of the supplier's capacity to perform the required service or to deliver the project
- 68 per cent had completed a cost benefit analysis.
A risk to achieving value for money is a lack of probity in outsourcing. It is important for water entities conducting outsourcing arrangements to have clearly documented probity practices. It is best practice for an entity to prepare a probity plan to oversee complex outsourcing arrangements. Effective probity controls maximise the value for money gained from outsourcing and reduce the risk of fraud and waste.
The high proportion of outsourced operating and capital expenditure within the industry increases the need for entities to have good probity arrangements. Overall, probity arrangements were assessed as satisfactory.
While 76 per cent of the specific examples of outsourced service and capital works arrangements we examined did not involve a probity auditor, this was reasonable and consistent with the Victorian Government Purchasing Board guidelines as they were for amounts below $10 million.
Letter of comfort
Once a service or project is outsourced, the water entity cannot directly implement controls over the provider's activities. A letter of comfort providing a description of the provider's systems, control objectives and related controls, their design, implementation and operating effectiveness can provide the water entity with an understanding of the nature and effectiveness of the provider's internal controls.
Management of only 5 per cent of water entities obtained a letter of comfort from their outsourced provider. Outsourcing an activity does not absolve management of its responsibility to maintain adequate internal controls. This indicates a shortfall with current outsourcing arrangements across the entire water industry.
Some entities did not request a letter of comfort because they considered that the nature of the outsourced services and projects did not require them to obtain comfort over the provider's internal controls. Management at other entities gained comfort over the arrangement through monitoring compliance and completion of contract terms.
Management oversight
Our review of management oversight of outsourcing showed that:
- 82 per cent of entities established performance indicators, and monitored performance against the indicators
- 95 per cent authorised payments in accordance with contractual arrangements
- 63 per cent prepared and provided status reports to the board and/or sub‑committee.
6.5.4 Governance and oversight
Approval and review of policies and procedures
Periodic review of policies and processes is important for keeping them up to date, enabling changes to be made to address revisions to guidelines or operational requirements, changed circumstances, to address areas of concern and to address business improvements or other opportunities for improvement.
For the 11 water entities that had outsourcing policies and procedures, 10 had been approved by their board. Four had reviewed their approved policies and procedures consistent with the timing in the policy. Four had not reviewed the policies and procedure in line with the stated timing, while three did not state when the approved policies and procedures should have been reviewed.
Risk recognition and management
The extent to which outsourcing is a risk to an entity needs to be assessed in light of matters such as the volume of activity outsourced, and the quality of an entity's procurement and contract management practices. If outsourcing arrangements are not appropriate or managed effectively, excessive costs and poor relationships can adversely affect services provided or delivery of capital projects to time, cost and quality requirements.
Any risks identified should appear in an entity's risk register and mitigation plans developed and put in place to effectively manage them.
Seventy-nine per cent of water entities included outsourcing in their risk register. Those entities that did not deemed the risks to be low given the nature of their operations.
Eighty-nine per cent of entities had identified and included related strategies in mitigation plans. One entity identified risks associated with its outsourcing arrangements but did not develop and implement mitigation plans. One entity, that had a small number of outsourced activities, did not identify any risks associated with outsourcing.
Monitoring of compliance and performance
A number of boards had delegated responsibility for monitoring and reviewing compliance and performance of outsourcing to management. Such monitoring activities were generally delegated where the dollar value was small or where the activity outsourced was not part of the entity's core business.
Consistent with their responsibilities under legislation, boards are responsible for reviewing the adequacy of outsourcing practices and assessing compliance with relevant internal policies and legislative requirements. Where monitoring and review has been delegated, the board should nevertheless require regular status reporting by management.
Sixty-eight per cent of entities reported information on outsourced activities to the board. Information reported included performance against key performance indicators in contractual arrangements and actual costs against budget.
Boards in only 47 per cent of entities evaluated the benefits associated with the outsourcing arrangements.
Internal audit
Internal audit can provide comfort that the entity's controls are in place and operating effectively, and identify control weaknesses and potential process improvements.
Over the past three years, internal audit in only 42 per cent of entities had performed a review of outsourcing. Given the value and volume of outsourced activity, this is concerning.
Recommendations
- That water entities assess their policies and processes against the commonly identified internal control environment weaknesses and act to address them to make sure they are operating reliably and cost-effectively.
- That water entities take timely action to address identified information technology control weaknesses.
- That water entities develop and maintain comprehensive policies and procedures which are appropriately approved and subject to regular review.
- That the water industry work with the Department of Treasury and Finance and the Valuer-General Victoria (VGV) to determine the most appropriate valuation methodology for infrastructure assets.
- The VGV should ensure all valuations conducted, including those by service providers, be subjected to rigorous quality assurance processes, and that appropriate effort is invested in establishing agreement with client entities before valuations are conducted.
- That water entities obtain letters of comfort about the effectiveness of internal controls of outsourced providers.
- That water entities use internal audit to periodically review outsourcing practices and related policy compliance.
- That water entities report regularly to their boards on outsourced activities to enable effective monitoring of performance, including of actual performance against key performance indicators in contractual arrangements, risk mitigation activity, cost-benefit analysis, and actual costs against budget.
Appendix A. Acronyms and glossary
Acronyms
| AAS | Australian Accounting Standard |
| AASB | Australian Accounting Standards Board |
| CRC | Current Replacement Cost |
| DRC | Depreciated Replacement Cost |
| DSE | Department of Sustainability and Environment |
| DTF | Department of Treasury and Finance |
| ESC | Essential Services Commission |
| FMA | Financial Management Act 1994 |
| FRD | Financial Reporting Direction |
| GST | Goods and Services Tax |
| KPI | Key Performance Indicator |
| TCV | Treasury Corporation of Victoria |
| VAGO | Victorian Auditor-General's Office |
| VGPB | Victorian Government Purchasing Board |
| VGV | Valuer-General Victoria |
Glossary
Accountability
Responsibility of public sector entities to achieve their objectives, with regard to reliability of financial reporting, effectiveness and efficiency of operations, compliance with applicable laws, and reporting to interested parties.
Amortisation
The systematic allocation of the depreciable amount of an intangible asset over its expected useful life.
Asset
A resource controlled by an entity as a result of past events, and from which future economic benefits are expected to flow to the entity.
Asset useful life
The period over which an asset is expected to provide the entity with economic benefits. Depending on the nature of the asset, the useful life can be expressed in terms of time or output.
Asset valuation
An asset valuation determines the fair value of a non-current physical asset on a particular date.
Audit Act 1994
Establishes the operating powers and responsibilities of the Auditor-General. This includes the operations of his office—the Victorian Auditor General's Office (VAGO) as well as the nature and scope of audits conducted by VAGO. The Act also addresses the relationship of the Auditor-General with the Public Accounts and Estimates Committee as the representative body of Parliament and the Auditor-General's accountability to Parliament for the discharge of the position's responsibilities.
Auditor's opinion
Written expression within a specified framework indicating the auditor's overall conclusion on the financial and performance reports based on audit evidence obtained.
Capital expenditure
Amount capitalised to the balance sheet for contributions by a public sector entity to major assets owned by the entity, including expenditure on:
- capital renewal of existing assets that returns the service potential or the life of the asset to that which it had originally
- capital expansion which extends an existing asset at the same standard to a new group of users.
Clear audit opinion – financial report
A positive written expression indicating that the financial report has been prepared in accordance with the requirements of the relevant legislation and Australian accounting standards.
A clear or unqualified audit opinion is provided when the financial report presents fairly the transactions and balances for the reporting period in accordance with the relevant legislative framework.
Clear audit opinion – performance report
A positive written expression indicating that the performance report has been prepared in accordance with the requirements of the relevant legislation.
A clear or unqualified audit opinion is provided when the performance report presents fairly the performance indicators and results of performance in accordance with the relevant legislative framework.
Corporations Act 2001
An Act of the Commonwealth of Australia that sets out the laws dealing with business entities in Australia at federal and interstate levels. It focuses primarily on companies, although it also covers some laws relating to other entities such as partnerships and managed investment schemes.
Current replacement cost
The cost the entity would incur to acquire the asset on the reporting date. The cost is measured by reference to the lowest cost at which the gross future economic benefits could be obtained in the normal course of business or the minimum it would cost, to replace the existing asset with a technologically modern equivalent new asset (not a second hand one) with the same economic benefits (gross service potential) allowing for any differences in the quantity and quality of output and in operating costs.
Depreciated replacement cost
The current replacement cost of an asset less, where applicable, accumulated depreciation calculated on the basis of such cost to reflect the already consumed or expired future economic benefits of the asset.
Depreciation
The systematic allocation of the depreciable amount of a non-current physical asset over its expected useful life.
Emphasis of matter
A paragraph within an auditor's report that draws attention to a disclosure or item in the financial report. The addition of an emphasis of matter does not affect the auditor's opinion.
Employee benefits provision
The liability recognised for employees' accrued service entitlements, including all accrued costs related to employment comprising of wages and salaries, leave entitlements, redundancy payments and superannuation contributions.
Entity
A body either corporate or unincorporated that has a public function to exercise on behalf of the state or is wholly owned by the state. Includes departments, statutory authorities, statutory corporations and government business enterprises.
Equity or net assets
Residual interest in the assets of an entity after deduction of its liabilities.
Expense
Outflows or other depletions of economic benefits in the form of incurrence of liabilities or depletion of assets of the entity, other than those relating to contributions by owners, that result in a decrease in equity during the reporting period.
Fair value
The amount for which a financial or non-financial asset could be exchanged between knowledgeable and willing parties in an arm's-length transaction.
Financial delegation
A schedule that specifies the level or approval required for each transaction category to facilitate the execution of functions necessary for the efficient operation of the entity.
Financial instrument
A contract that represents a financial asset of one party and a financial liability or equity instrument of another party.
Financial Management Act 1994
The Act of the State of Victoria that establishes the financial administration and accountability of the public sector, as well as annual reporting to the Parliament by departments and public sector bodies.
Financial report
Structured representation of financial information, which usually includes accompanying notes, derived from accounting records and intended to communicate an entity's economic resources or obligations at a point in time or the changes therein for a period in accordance with a financial reporting framework.
Financial reporting direction
A direction issued by the Minister for Finance to achieve consistent application of accounting treatments across the Victorian public sector in compliance with a particular Australian Accounting Standards or Interpretations issued by the Australian Accounting Standards Board (AASB). Generally issued when a standard or interpretation provides accounting treatment options.
Financial sustainability
An entity's ability to manage financial resources so it can meet its spending commitments, both at present and into the future.
Financial year
A period of 12 months for which a financial and/or performance report is prepared.
Going concern
An entity which is expected to be able to pay its debts as and when they fall due, and continue in operation without any intention or necessity to liquidate or otherwise wind up its operations.
Hard close audit
An audit visit undertaken towards the end of the financial year to substantiate figures available prior to financial year-end that are intended to be provided in the financial statements.
Independent auditor's report
A clear expression of the independent auditor's opinion on an entity's financial and performance report, as applicable.
Internal controls
Processes affected by an entity's structure, work and authority flows, people and management information systems, designed to assist the entity accomplish specific goals and objectives. Internal controls are a means by which an entity's resources are directed, monitored and measured. They play an important role in preventing and detecting error and fraud and protecting the entity's resources.
Liability
A present obligation of the entity arising from past events, the settlement of which is expected to result in an outflow from the entity of resources embodying economic benefits.
Masterfile
A database of entries containing data that does not often change (for example, name, address and bank account details).
Materiality
Materiality depends on the size or nature of an item or error judged in the particular circumstances of its omission or misstatement. Thus, materiality provides a threshold or cut-off point rather than being a primary qualitative characteristic which information must have if it is to be useful.
Information or data is material if its omission or misstatement could influence the economic decisions taken by users on the basis of the financial report.
Modified opinion in the auditor's report
The types of modified opinions in an auditor's report and the basis for issuing these reports are as follows:
- A 'qualified opinion' is expressed when the auditor concludes that an unqualified opinion cannot be expressed due to a disagreement with management, a conflict between applicable financial reporting frameworks or a scope limitation; however, the effect is not so material and pervasive as to require an adverse opinion or a disclaimer of opinion. The qualified opinion is expressed as being 'except for' the effects of the matter to which the qualification relates.
- A 'disclaimer of opinion' is expressed when a limitation of scope of the auditor's work exists and the possible effect of the limitation on scope is so material and pervasive that the auditor has not been able to obtain sufficient appropriate audit evidence and accordingly is unable to express an opinion on the financial statements.
- An 'adverse opinion' is expressed when the effect of a disagreement with management or a conflict between applicable financial reporting frameworks is so material or pervasive to the financial statements that the auditor concludes that a qualification is not adequate to disclose the misleading or incomplete nature of the financial statements.
Net result
Calculated by subtracting an entity's total expenses from its total revenue, to show what the entity has earned or lost in a given period of time.
Non-reciprocal
An event where an entity receives assets or income without directly giving equal value in exchange to the party providing the assets or income.
Performance report
A statement containing predetermined performance indicators and targets and actual results achieved against them for that financial year, with an explanation for any significant variance between the results and targets.
Public sector entity
A department; a local government; a statutory body; an entity controlled by one, or more than one department, local government or statutory body or by a combination of departments, local governments and statutory bodies; or an entity controlled by an entity that is a public sector entity.
Revenue
Inflows or other enhancements or savings in outflows of service potential, or future economic benefits in the form of increases in assets or reductions in liabilities of the entity, other than those relating to contributions by owners, which result in an increase in equity during the reporting period.
Risk
The chance of a negative impact on the objectives, outputs or outcomes of the entity.
Unqualified audit opinion – financial report
The audit opinion provided when the financial report presents fairly the transactions and balances for the reporting period in accordance with the relevant legislative framework. Also referred to as a clear audit opinion.
Unqualified audit opinion – performance report
The audit opinion provided when the performance report presents fairly the performance indicators and results of performance in accordance with the relevant legislative framework. Also referred to as a clear audit opinion.
Water Act 1989
An Act of the State of Victoria that establishes the:
- governance and operational management of water entities
- management of surface and ground water
- water entitlement licence, trading, pricing consultation, arrangements, issuance and allocation.
Appendix B. Accountability arrangements
Governance
The responsible minister for the water industry is the Minister for Water. The relationship between the Minister for Water and the water entities is established by the Water Act 1989 and the Water Industry Act 1994.
The Water Group, a business unit within the Department of Sustainability and Environment, supports and advises the Minister for Water.
The 19 entities also report to the Treasurer of Victoria.
Figure B1 provides an overview of the accountability arrangements and lines of reporting by the 19 water entities that provide essential water and sewerage services to people living in Victoria. It excludes Watermove, a controlled subsidiary of Goulburn-Murray Water.
Figure B1
Water industry overview – accountability arrangements
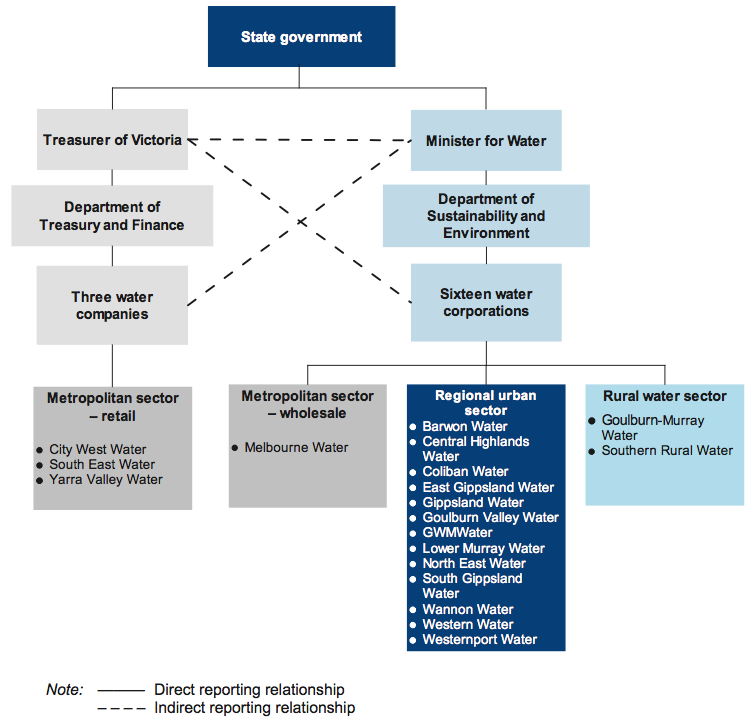
Source: Victorian Auditor-General's Office.
Appendix C. Audit status
Metropolitan
Audit types |
Financial report |
Timeliness of audited financial report completion |
||||
|---|---|---|---|---|---|---|
Entity |
FMA |
Non-FMA |
Clear opinion issued |
Auditor-General's report signed |
Within 12 weeks |
More than 12 weeks |
COMPLETED AUDITS WITH 30 JUNE 2011 BALANCE DATES |
||||||
Wholesaler |
||||||
Melbourne Water |
Yes |
Yes |
22 Aug 2011 |
Yes |
||
Retailers |
||||||
City West Water |
C |
Yes |
26 Aug 2011 |
Yes |
||
South East Water |
C |
Yes |
29 Aug 2011 |
Yes |
||
Yarra Valley Water |
C |
Yes |
24 Aug 2011 |
Yes |
||
2010–11 Total number of entities = 4 |
1 |
3 |
4 |
0 |
||
Per cent |
100 |
0 |
||||
2009–10 Total number of entities = 4 |
1 |
3 |
4 |
0 |
||
Per cent |
100 |
0 |
||||
Note: Non-FMA audit types: C – Corporations Act 2001. The performance report for Melbourne Water was completed on the same date as the financial report.
Source: Victorian Auditor-General's Office.
Regional urban
Audit types |
Financial report |
Timeliness of audited financial report completion |
||||
|---|---|---|---|---|---|---|
Entity |
FMA |
Non-FMA |
Clear opinion issued |
Auditor-General's report signed |
Within 12 weeks |
More than 12 weeks |
COMPLETED AUDITS WITH 30 JUNE 2011 BALANCE DATES |
||||||
Barwon Water |
Yes |
Yes |
26 Aug 2011 |
Yes |
||
Central Highlands Water |
Yes |
Yes |
01 Sep 2011 |
Yes |
||
Coliban Water |
Yes |
Yes |
26 Aug 2011 |
Yes |
||
East Gippsland Water |
Yes |
Yes |
07 Sep 2011 |
Yes |
||
Gippsland Water |
Yes |
Yes |
05 Sep 2011 |
Yes |
||
Goulburn Valley Water |
Yes |
Yes |
31 Aug 2011 |
Yes |
||
GWMWater |
Yes |
Yes |
05 Sep 2011 |
Yes |
||
Lower Murray Water |
Yes |
Yes |
07 Sep 2011 |
Yes |
||
North East Water |
Yes |
Yes |
01 Sep 2011 |
Yes |
||
South Gippsland Water |
Yes |
Yes |
02 Sep 2011 |
Yes |
||
Wannon Water |
Yes |
Yes |
29 Aug 2011 |
Yes |
||
Western Water |
Yes |
Yes |
02 Sep 2011 |
Yes |
||
Westernport Water |
Yes |
Yes |
07 Sep 2011 |
Yes |
||
2010–11 Total number of entities = 13 |
13 |
0 |
13 |
0 |
||
Per cent |
100 |
0 |
||||
2009–10 Total number of entities = 13 |
13 |
0 |
13 |
0 |
||
Per cent |
100 |
0 |
||||
Note: Performance reports were completed on the same date as the financial reports for all entities.
Source: Victorian Auditor-General's Office.
Rural
Audit types |
Financial report |
Timeliness of audited financial report completion |
||||
|---|---|---|---|---|---|---|
Entity |
FMA |
Non-FMA |
Clear opinion issued |
Auditor-General's report signed |
Within 12 weeks |
More than 12 weeks |
COMPLETED AUDITS WITH 30 JUNE 2011 BALANCE DATES |
||||||
Goulburn-Murray Water |
Yes |
Yes |
01 Sep 2011 |
Yes |
||
Watermove |
C |
Yes |
24 Oct 2011 |
Yes |
||
Southern Rural Water |
Yes |
Yes |
05 Sep 2011 |
Yes |
||
2010–11 Total number of entities = 3 |
2 |
1 |
|
|
2 |
1 |
Per cent |
67 |
33 |
||||
2009–10 Total number of entities = 3 |
2 |
1 |
3 |
0 |
||
Per cent |
100 |
0 |
||||
Note: Non-FMA audit types: C – Corporations Act 2001. Watermove is a controlled subsidiary of Goulburn-Murray Water. Performance reports were completed on the same date as the financial reports for all entities that were required to prepare a performance report.
Source: Victorian Auditor-General's Office.
Appendix D. Financial composition
This Appendix presents the composition of revenue, expenses, assets and liabilities at an industry, metropolitan, regional urban and rural level.
Industry level
Figure D1
Revenue composition
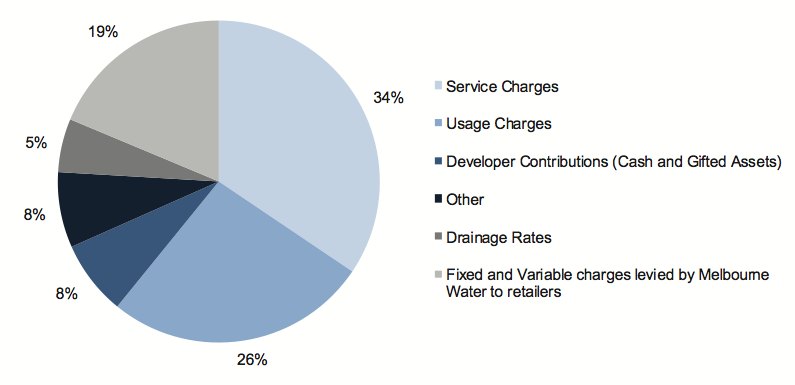
Source: Victorian Auditor-General's Office.
Figure D2
Expense composition
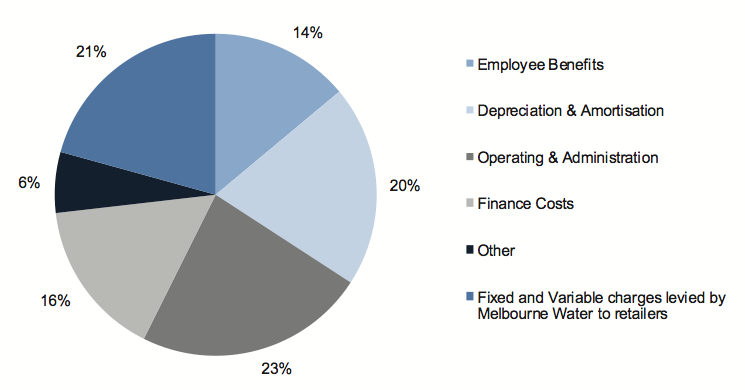
Source: Victorian Auditor-General's Office.
Figure D3
Asset composition
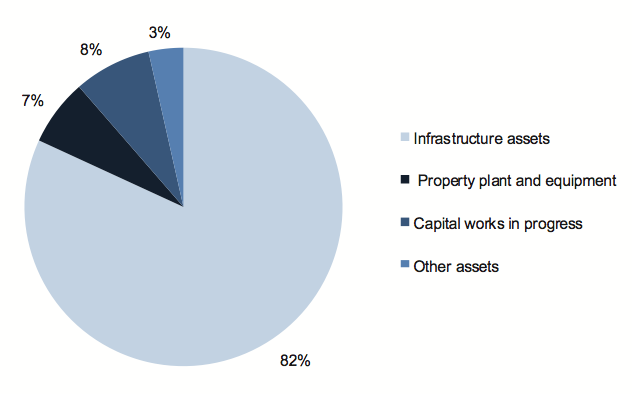
Source: Victorian Auditor-General's Office.
Figure D4
Liability composition
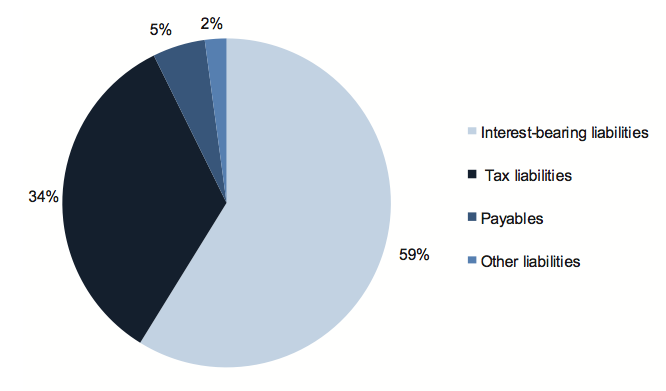
Source: Victorian Auditor-General's Office.
Metropolitan wholesaler
Figure D5
Revenue composition
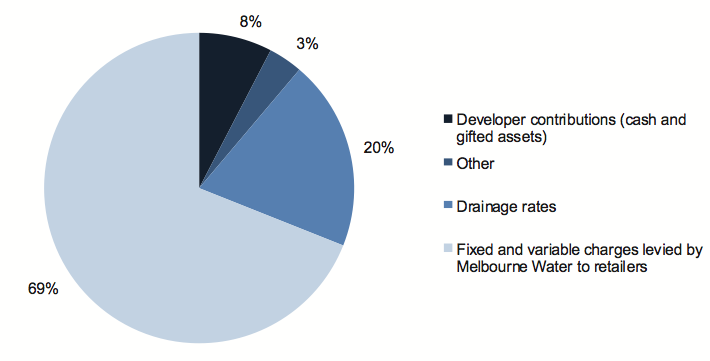
Source: Victorian Auditor-General's Office.
Figure D6
Expense composition
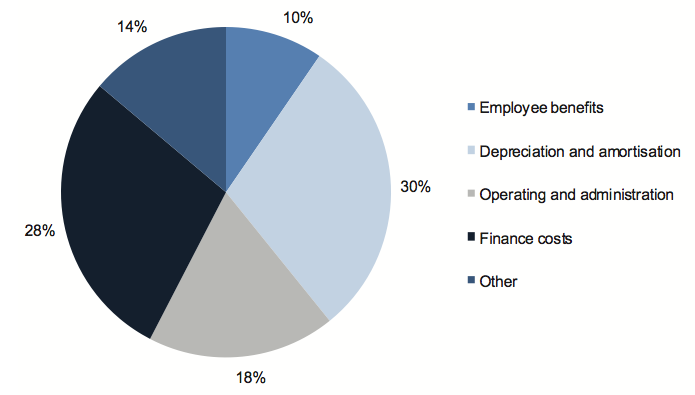
Source: Victorian Auditor-General's Office.
Figure D7
Asset composition
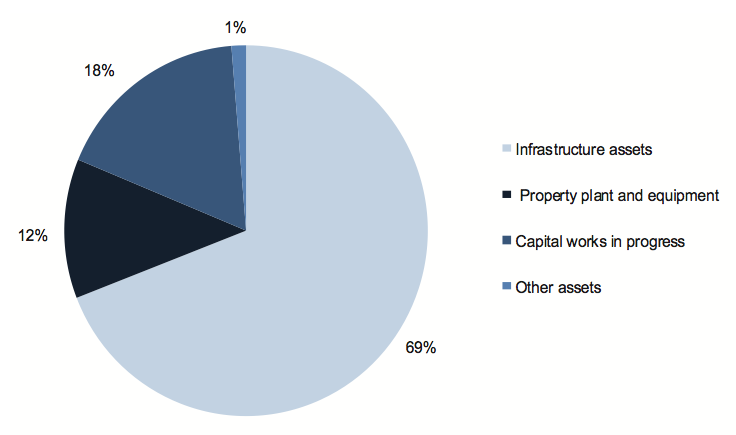
Source: Victorian Auditor-General's Office.
Figure D8
Liabilities composition
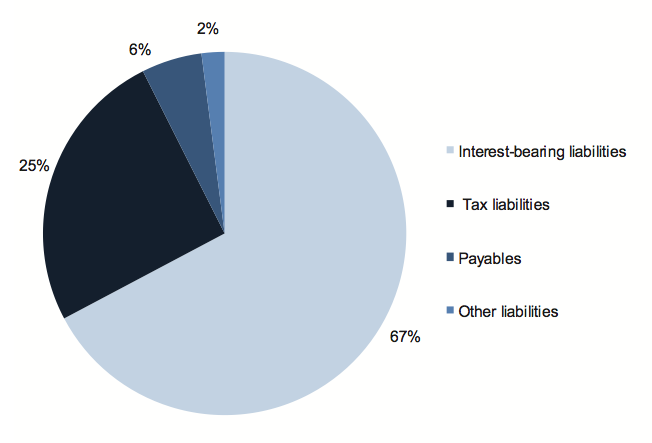
Source: Victorian Auditor-General's Office.
Metropolitan retailers
Figure D9
Revenue composition
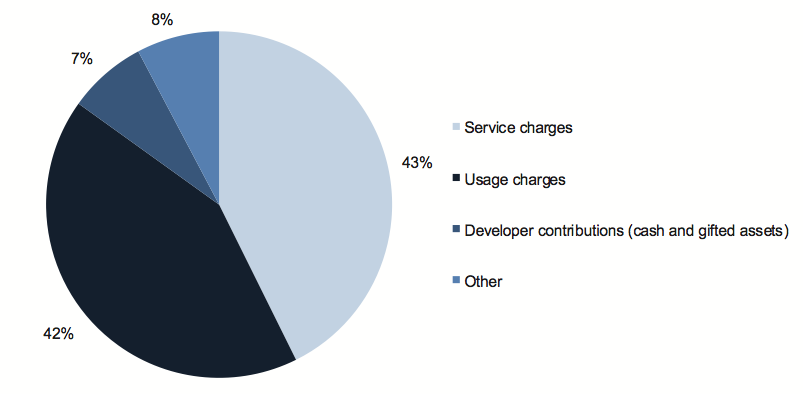
Source: Victorian Auditor-General's Office.
Figure D10
Expense composition
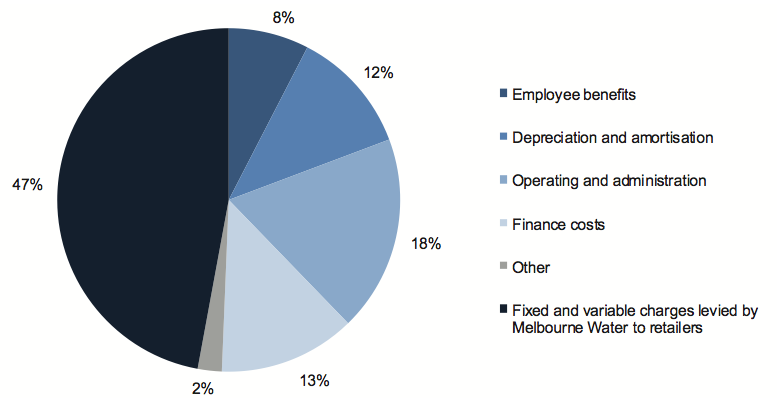
Source: Victorian Auditor-General's Office.
Figure D11
Assets composition
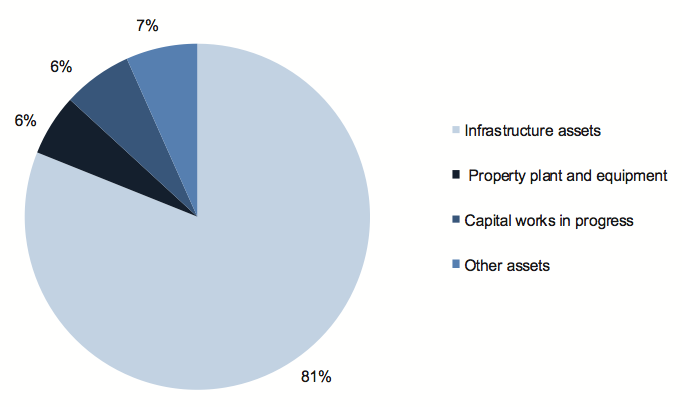
Source: Victorian Auditor-General's Office.
Figure D12
Liabilities composition
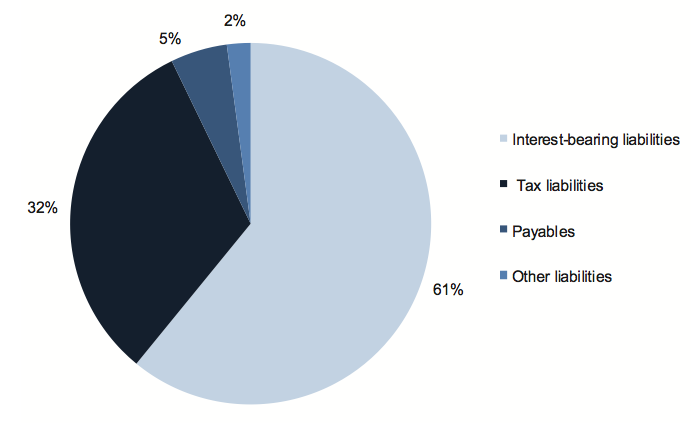
Source: Victorian Auditor-General's Office.
Regional urban
Figure D13
Revenue composition
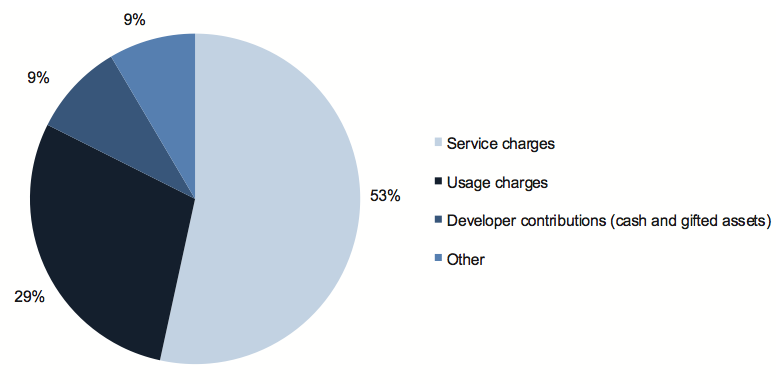
Source: Victorian Auditor-General's Office.
Figure D14
Expense composition
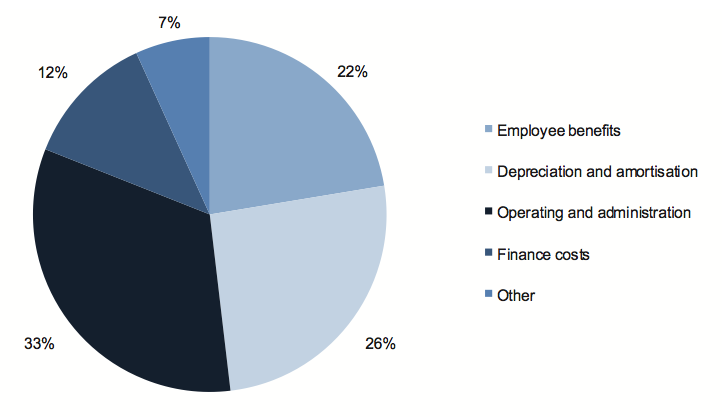
Source: Victorian Auditor-General's Office.
Figure D15
Asset composition
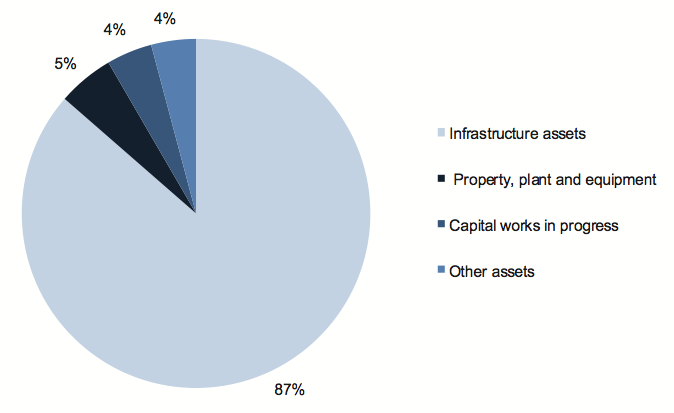
Source: Victorian Auditor-General's Office.
Figure D16
Liabilities composition
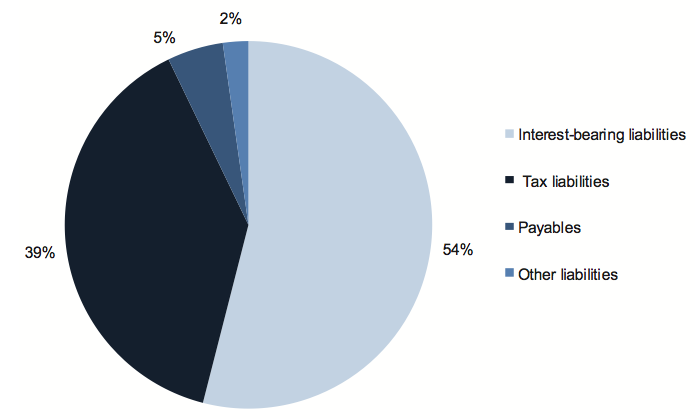
Source: Victorian Auditor-General's Office.
Rural
Figure D17
Revenue composition
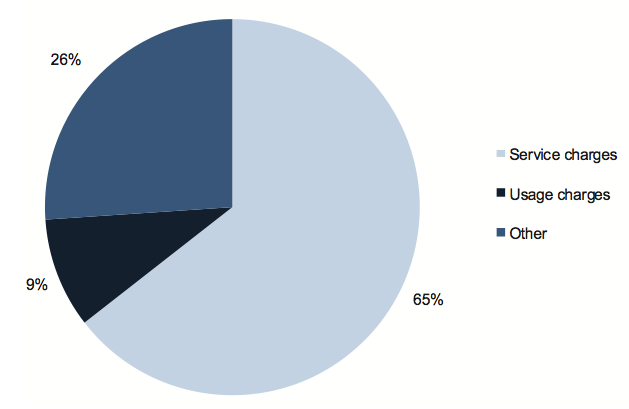
Source: Victorian Auditor-General's Office.
Figure D18
Expense composition
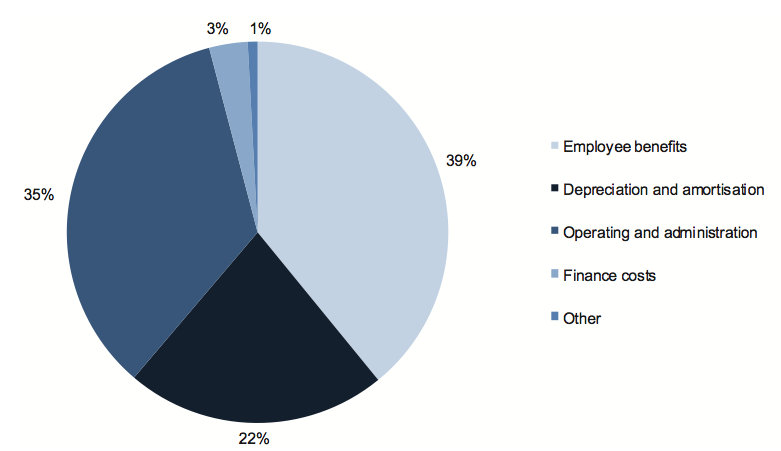
Source: Victorian Auditor-General's Office.
Figure D19
Asset composition
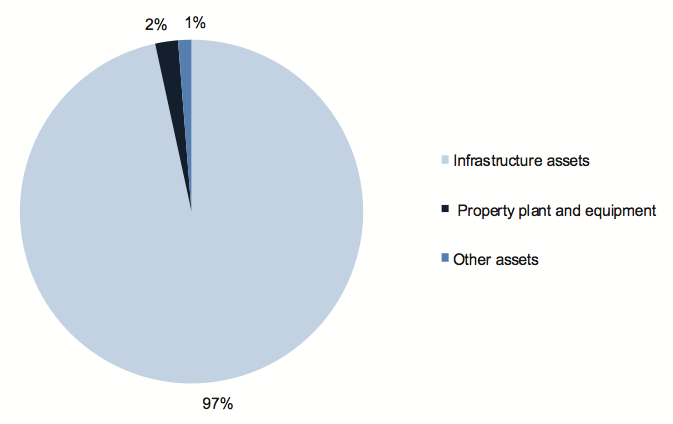
Source: Victorian Auditor-General's Office.
Figure D20
Liabilities composition
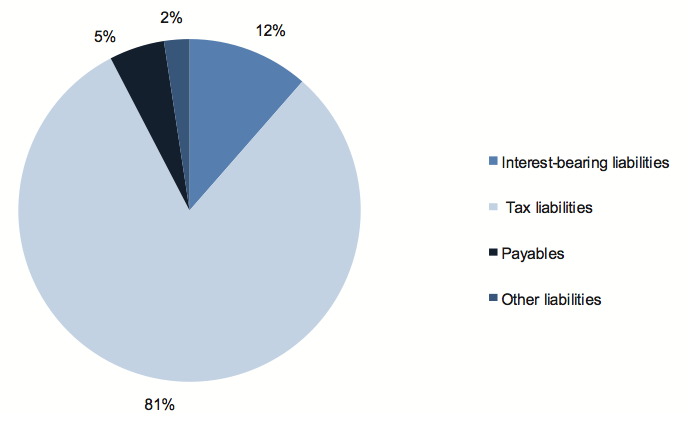
Source: Victorian Auditor-General's Office.
Appendix E. Financial sustainability indicators and criteria
Indicators of financial sustainability
This Appendix sets out the financial indicators used in this report. The indicators should be considered collectively, and are more useful when assessed over time as part of a trend analysis. The indicators have been applied to the published financial information of the 19 water entities for the five-year period 2006–07 to 2010–11.
The analysis of financial sustainability in this report reflects on the position of each entity individually, and of each water sector as a category. The financial sustainability indicators used in this report are indicative of the financial sustainability of the water entities.
The financial sustainability indicators are outlined in Figure E1.
Figure E1
Financial sustainability indicators
|
Indicator |
Formula |
Description |
|---|---|---|
|
Underlying result (%) |
Adjusted net surplus / Total underlying revenue |
A positive result indicates a surplus, and the larger the percentage, the stronger the result. A negative result indicates a deficit. Operating deficits cannot be sustained in the long term. Underlying revenue does not take into account one‑off or non-recurring transactions. Net result and total underlying revenue is obtained from the comprehensive operating statement and is adjusted to take into account large one-off (non‑recurring) transactions. |
|
Interest cover |
Net operating cash flows before net interest and tax payments / Net interest payments |
This measures an entity's ability to meet ongoing interest payments and ability to service debt. Net operating cash flows and net interest and tax payments are obtained from the cash flow statement. |
|
Liquidity |
Current assets / Current liabilities |
This measures an entity's ability to pay existing liabilities in the next 12 months. A ratio of one or more means there are more cash and liquid assets than short-term liabilities. Current liabilities exclude long-term employee provisions and revenue in advance. |
|
Debt-to-assets |
Debt / Total assets |
This is a longer-term measure that compares all current and non-current interest bearing liabilities to total assets. It complements the liquidity ratio which is a short‑term measure. A low ratio indicates less reliance on debt to finance the assets of an organisation. |
|
Self-financing (%) |
Net operating cash flows / Underlying revenue |
This measures an entity's ability to replace assets using cash generated by the entity's operations. The higher the percentage the more effectively this can be done. Net operating cash flows are obtained from the cash flow statement. |
|
Capital replacement |
Cash outflows for property, plant and equipment / Depreciation |
Comparison of the rate of spending on infrastructure with its depreciation. Ratios higher than 1:1 indicate that spending is faster than the depreciating rate. This is a long-term indicator, as capital expenditure can be deferred in the short term if there are insufficient funds available from operations, and borrowing is not an option. Cash outflows for infrastructure are taken from the cash flow statement. Depreciation is taken from the comprehensive operating statement. |
Source: Victorian Auditor-General's Office.
Financial sustainability risk assessment criteria
The financial sustainability of each water entity has been assessed using the risk criteria outlined in Figure E2.
Figure E2
Financial sustainability indicators – risk assessment criteria
|
Risk |
Underlying result |
Interest cover |
Liquidity |
Debt-to-assets |
Self-financing |
Capital replacement |
|---|---|---|---|---|---|---|
|
High |
Negative 10% or less |
Less than 1.0 |
Less than 0.7 |
More than 1.0 |
Less than 10% |
Less than 1.0 |
|
Insufficient revenue is being generated to fund operations and asset renewal. |
Insufficient interest cover to meet ongoing interest payments. |
Immediate sustainability issues with insufficient current assets to cover liabilities. |
Long-term concern over ability to repay debt. |
Insufficient cash from operations to fund new assets and asset renewal. |
Spending on capital works has not kept pace with consumption of assets. |
|
|
Medium |
Negative 10% to 0% |
1.0–2.0 |
0.7–1.0 |
0.5–1.0 |
10–20 % |
1.0–1.5 |
|
A risk of long-term run down to cash reserves and inability to fund asset renewals. |
May not be able to service debt as interest payments fall due. |
Need for caution with cash flow, as issues could arise with meeting obligations as they fall due. |
May indicate concerns over the ability to repay the debt. |
May not be generating sufficient cash from operations to fund new assets. |
May indicate spending on asset renewal is insufficient. |
|
|
Low |
More than 0% |
More than 2.0 |
More than 1.0 |
Less than 0.5 |
More than 20% |
More than 1.5 |
|
Generating surpluses consistently. |
Low risk of debt servicing issues. |
No immediate issues with repaying short-term liabilities as they fall due. |
Low risk over repaying debt from own source revenue. |
Generating enough cash from operations to fund new assets. |
Low risk of insufficient spending on asset renewal. |
Source: Victorian Auditor-General's Office.
A trend has been determined for each ratio by entity and the sector.
Figure E3
Overall financial sustainability risk assessment
|
Red text |
High risk of shorter-term and immediate sustainability concerns indicated either by:
|
|
Amber text |
Medium risk of longer-term sustainability concerns indicated either by:
|
|
Green text |
Low risk of financial sustainability concerns—there are no high-risk indictors. |
 |
An increasing ratio is a deteriorating trend |
 |
A decreasing ratio is a deteriorating trend |
 |
No substantial trend |
 |
An increasing ratio is an improving trend |
 |
A decreasing ratio is an improving trend |
Metropolitan
Figure E4
Underlying result
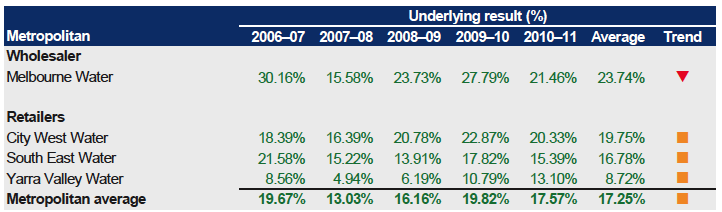
Source: Victorian Auditor-General's Office.
Figure E5
Interest cover
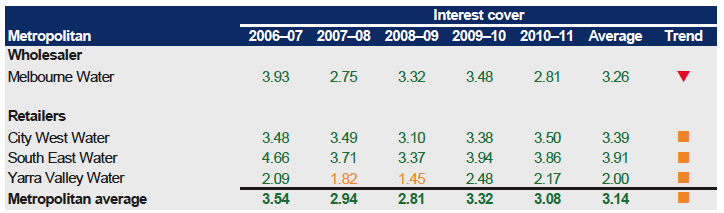
Source: Victorian Auditor-General's Office.
Figure E6
Liquidity
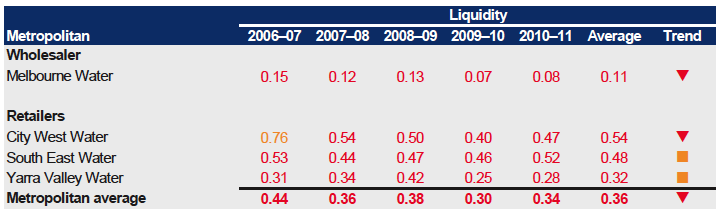
Source: Victorian Auditor-General's Office.
Figure E7
Debt-to-assets
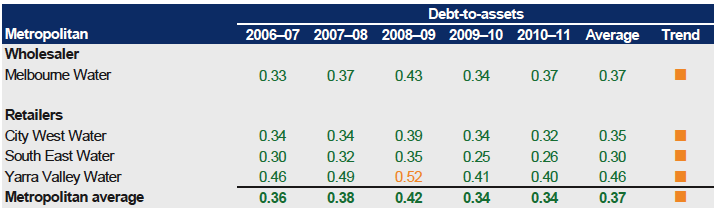
Source: Victorian Auditor-General's Office.
Figure E8
Self-financing
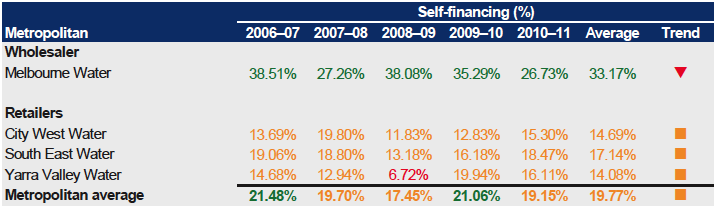
Source: Victorian Auditor-General's Office.
Figure E9
Capital replacement
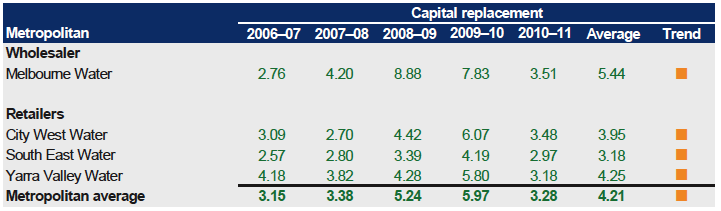
Source: Victorian Auditor-General's Office.
Regional urban
Figure E10
Underlying result
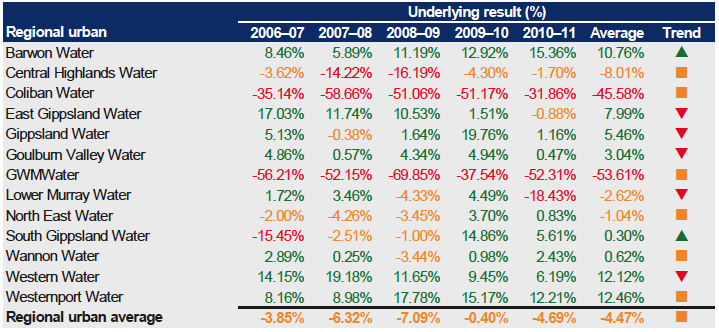
Source: Victorian Auditor-General's Office.
Figure E11
Interest cover
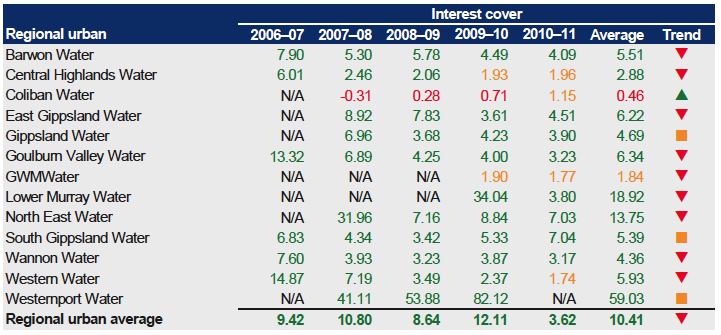
Note: N/A—Interest received exceeded interest paid.
Source: Victorian Auditor-General's Office.
Figure E12
Liquidity
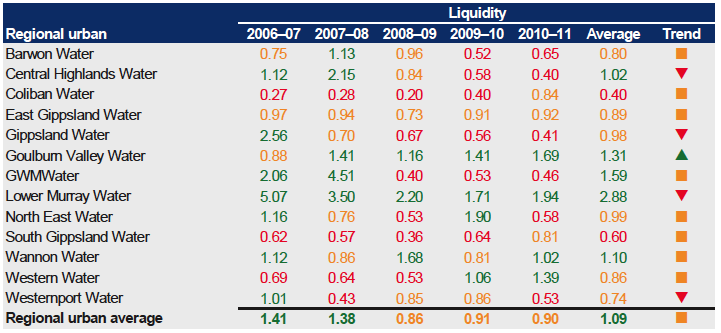
Source: Victorian Auditor-General's Office.
Figure E13
Debt-to-assets
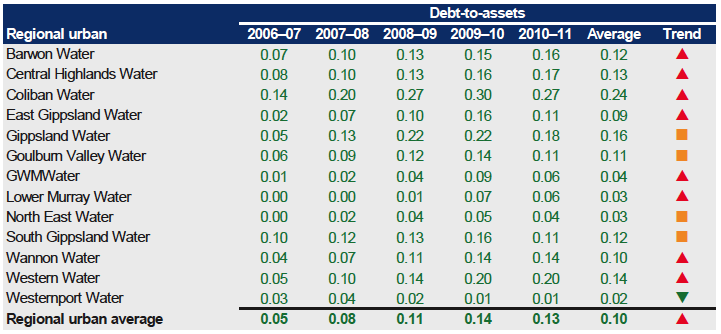
Source: Victorian Auditor-General's Office.
Figure E14
Self-financing
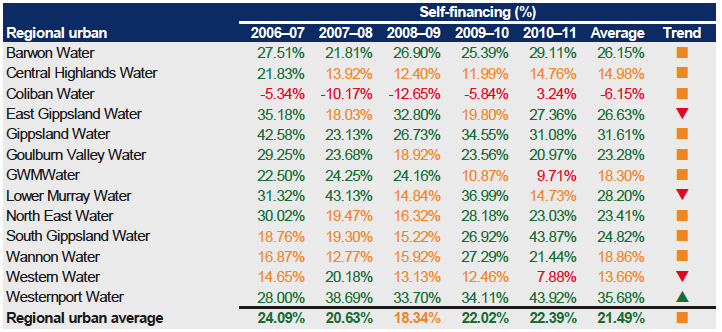
Source: Victorian Auditor-General's Office.
Figure E15
Capital replacement
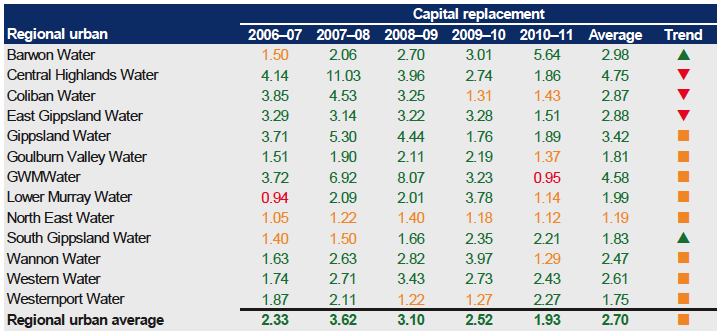
Source: Victorian Auditor-General's Office.
Rural
Figure E16
Underlying result
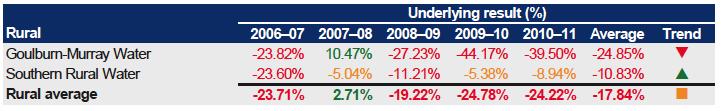
Source: Victorian Auditor-General's Office.
Figure E17
Interest cover
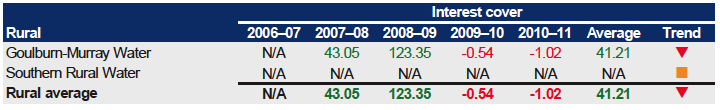
Note: N/A—Interest received exceeded interest paid.
Source: Victorian Auditor-General's Office.
Figure E18
Liquidity
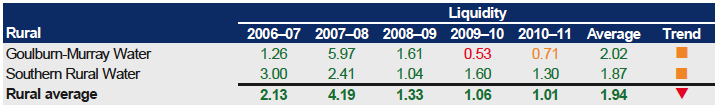
Source: Victorian Auditor-General's Office.
Figure E19
Debt-to-assets
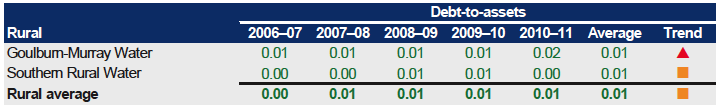
Source: Victorian Auditor-General's Office.
Figure E20
Self-financing
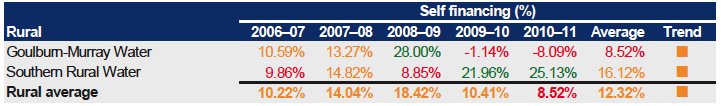
Source: Victorian Auditor-General's Office.
Figure E21
Capital replacement
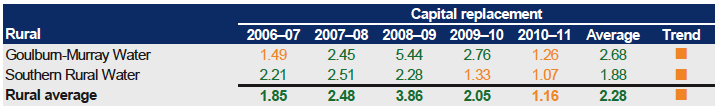
Source: Victorian Auditor-General's Office.
Appendix F. Entity level financial sustainability
This Appendix details the overall financial sustainability assessment of each entity over the past five years given six indicators.
The overall financial sustainability risk assessment has been calculated using the ratings determined for each indicator as outlined in Figure F1. Appendix E provides further information on each indicator.
Figure F1
Overall financial sustainability risk assessment
|
|
High risk of shorter-term and immediate sustainability concerns indicated either by:
|
|
|
Medium risk of longer-term sustainability concerns indicated either by:
|
|
|
Low risk of financial sustainability concerns—there are no high-risk indictors. |


Source: Victorian Auditor-General's Office.
Metropolitan
Wholesaler
Figure F2
Melbourne Water
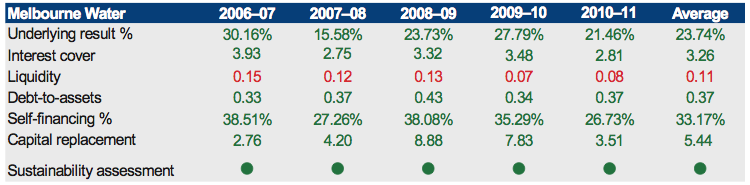
Source: Victorian Auditor-General's Office.
Retailers
Figure F3
City West Water
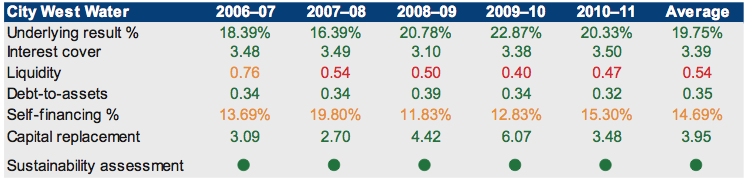
Source: Victorian Auditor-General's Office.
Figure F4
South East Water
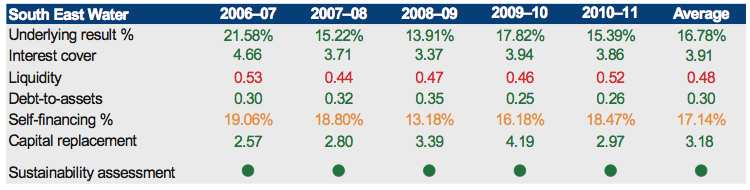
Source: Victorian Auditor-General's Office.
Figure F5
Yarra Valley Water
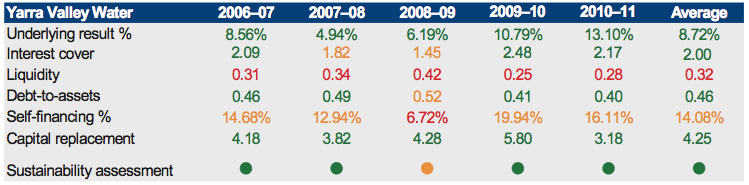
Source: Victorian Auditor-General's Office.
Regional urban
Figure F6
Barwon Water
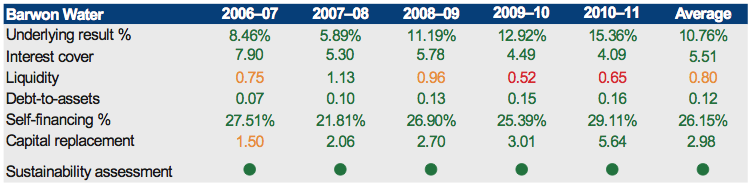
Source: Victorian Auditor-General's Office.
Figure F7
Central Highlands Water
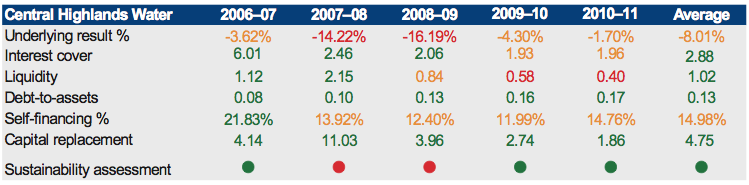
Source: Victorian Auditor-General's Office.
Figure F8
Coliban Water
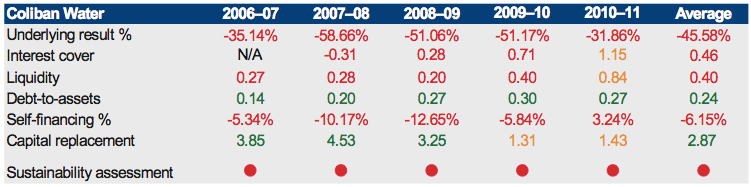
Note: N/A—Interest received exceeded interest paid.
Source: Victorian Auditor-General's Office.
Figure F9
East Gippsland Water
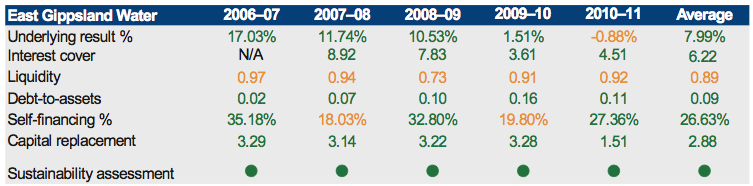
Note: N/A—Interest received exceeded interest paid.
Source: Victorian Auditor-General's Office.
Figure F10
Gippsland Water
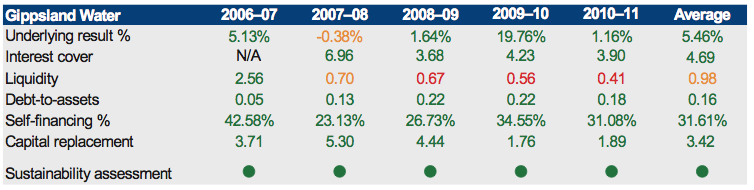
Note: N/A—Interest received exceeded interest paid.
Source: Victorian Auditor-General's Office.
Figure F11
Goulburn Valley Water
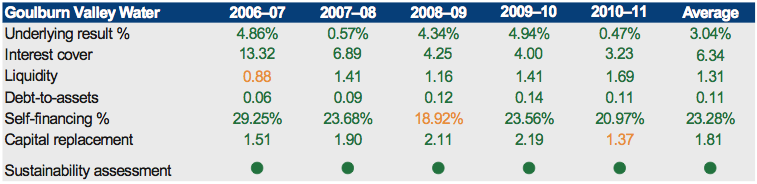
Source: Victorian Auditor-General's Office.
Figure F12
GWMWater
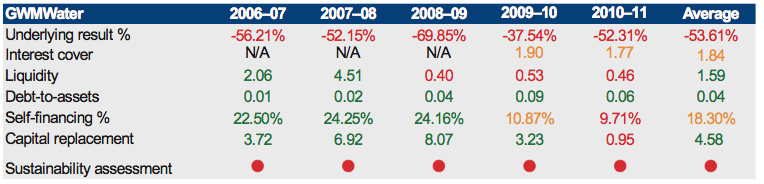
Note: N/A—Interest received exceeded interest paid.
Source: Victorian Auditor-General's Office.
Figure F13
Lower Murray Water
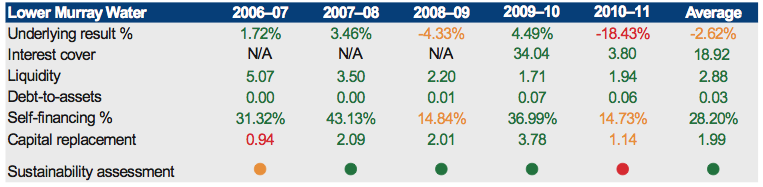
Note: N/A—Interest received exceeded interest paid.
Source: Victorian Auditor-General's Office.
Figure F14
North East Water
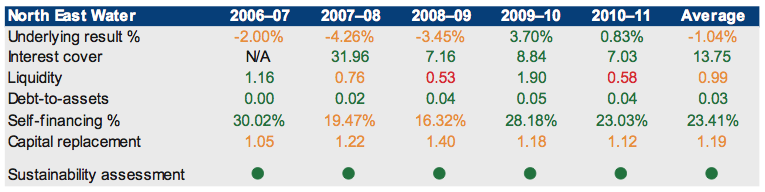
Note: N/A—Interest received exceeded interest paid.
Source: Victorian Auditor-General's Office.
Figure F15
South Gippsland Water
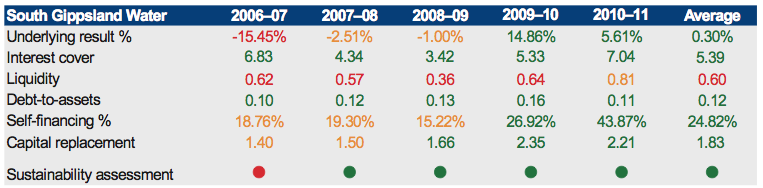
Source: Victorian Auditor-General's Office.
Figure F16
Wannon Water
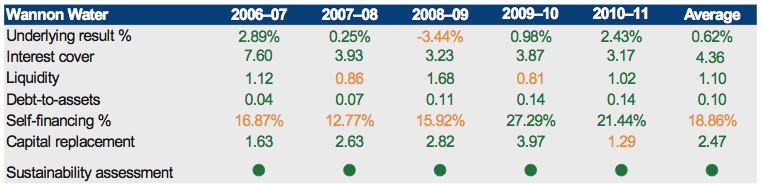
Source: Victorian Auditor-General's Office.
Figure F17
Western Water
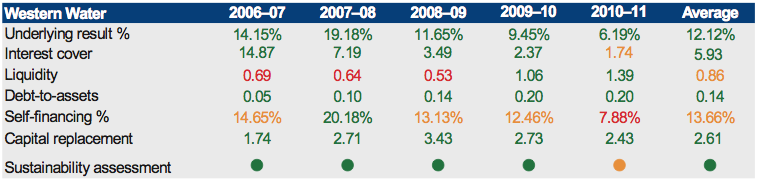
Source: Victorian Auditor-General's Office.
Figure F18
Westernport Water
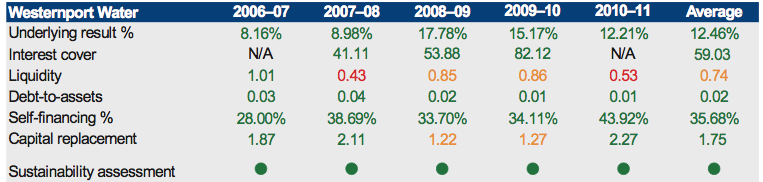
Note: N/A—Interest received exceeded interest paid.
Source: Victorian Auditor-General's Office.
Figure F19
Goulburn-Murray Water
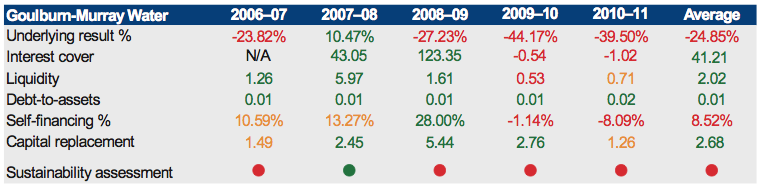
Note: N/A—Interest received exceeded interest paid.
Source: Victorian Auditor-General's Office.
Figure F20
Southern Rural Water
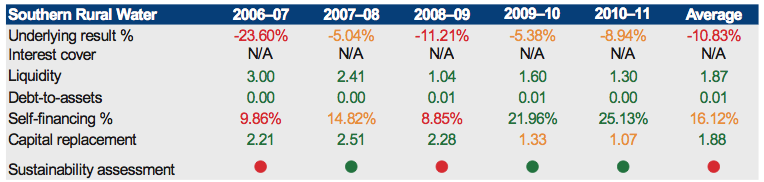
Note: N/A—Interest received exceeded interest paid.
Source: Victorian Auditor-General's Office.
Appendix G. Performance indicators
This Appendix sets out the performance indicators against which water entities are required to report. Financial Reporting Direction 27B Presentation and Reporting of Performance Information specifies the entities required to prepare and submit for audit a performance report. Ministerial directives issued under section 51 of the Financial Management Act 1994 specify the performance indicators that need to be reported in a performance report.
Financial indicators
Indicator |
Metropolitan wholesaler |
Metropolitan retailer |
Regional urban |
Rural |
|---|---|---|---|---|
Gearing ratio |
Yes |
Yes |
Yes |
Yes |
Interest cover (cash) |
Yes |
Yes |
Yes |
Yes |
Interest cover (earnings before income tax) |
Yes |
Yes |
Yes |
Yes |
Internal financing ratio |
Yes |
Yes |
Yes |
Yes |
Return on assets |
Yes |
Yes |
||
Return on equity |
Yes |
Yes |
||
Total |
6 |
6 |
4 |
4 |
Note: 'Yes' = Performance indicator included in the performance report
Source: Victorian Auditor-General's Office.
Non-financial indicators
Indicator |
Metropolitan wholesaler |
Metropolitan retailer |
Regional urban |
Rural |
|---|---|---|---|---|
Services |
||||
Containment of sewer spillages |
Yes |
Yes |
||
Customer complaints—Billing |
Yes |
Yes |
||
Customer complaints—Sewage odour |
Yes |
Yes |
||
Customer complaints—Sewerage service quality and reliability |
Yes |
Yes |
||
Customer complaints—Water quality |
Yes |
Yes |
||
Interruption time indicators |
Yes |
Yes |
||
Reliability of sewerage collection services |
Yes |
Yes |
Yes |
|
Restoration of water supply |
Yes |
Yes |
||
Water quality—Compliance with BWSA: Aesthetics—Turbidity |
Yes |
|||
Water quality—Compliance with BWSA: Microbiological standards—E.coli |
Yes |
|||
Water supply interruptions |
Yes |
Yes |
|
|
Total services |
3 |
9 |
9 |
0 |
Environmental |
||||
Recycled water |
Yes |
|||
Reuse indicators—Effluent reuse |
Yes |
Yes |
||
Reuse indicators—Biosolids reuse |
Yes |
Yes |
||
River health—Achievement of Water Plan river health targets |
Yes |
|||
River health—Reduction in currently known intolerable flood risks |
Yes |
|
||
Sewage treatment standards |
Yes |
Yes |
||
Sewerage treatment and disposal—ETP—Compliance with EPA discharge requirements—Offensive odours beyond boundary |
Yes |
|||
Sewerage treatment and disposal—WTP—Compliance with EPA discharge requirements—Offensive odours beyond boundary |
Yes |
|||
Sewerage treatment and disposal—WTP—Compliance with EPA discharge requirements—Raw sewage TDS |
Yes |
|||
Sewerage treatment and disposal—ETP—Compliance with EPA discharge requirements—Ammonia limit |
Yes |
|||
Total environmental |
7 |
3 |
3 |
0 |
Note: 'Yes' = Performance indicator included in the performance report
BWSA—Bulk Water Supply Agreement
ETP—Eastern Treatment Plant
EPA—Environment Protection Authority
WTP—Western Treatment Plant
TDS—Total dissolved solids
Source: Victorian Auditor-General's Office.
Appendix H. Audit Act 1994 section 16— submissions and comments
Introduction
In accordance with section 16A and 16(3) of the Audit Act 1994 a copy of this report, or relevant extracts from the report, was provided to the Department of Treasury and Finance, the Department of Sustainability and Environment, the Valuer-General Victoria, the Essential Services Commission, the State Owned Enterprise for Irrigation Modernisation in Northern Victoria and the 20 entities with a request for submissions or comments.
Responses were received as follows:
- The Department of Treasury and Finance
- The Department of Sustainability and Environment
- The Valuer-General Victoria
- The Essential Services Commission
- GWMWater
Further audit comment:
The submissions and comments provided are not subject to audit nor the evidentiary standards required to reach an audit conclusion. Responsibility for the accuracy, fairness and balance of those comments rests solely with the agency head.
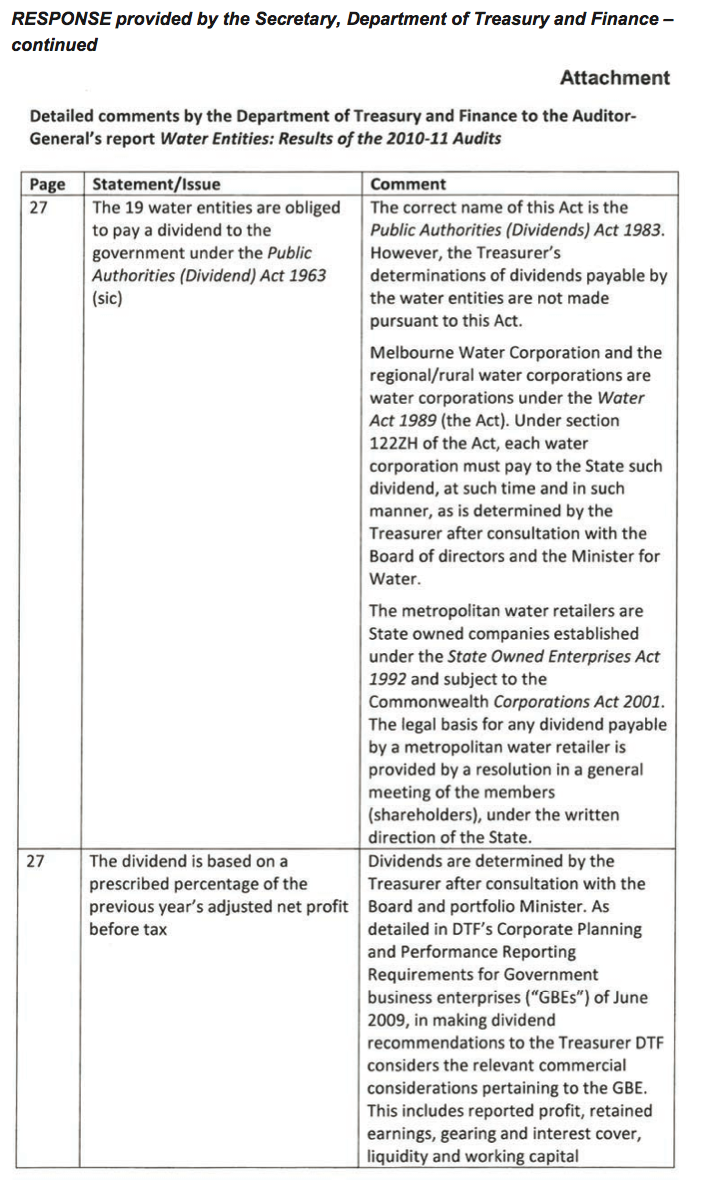
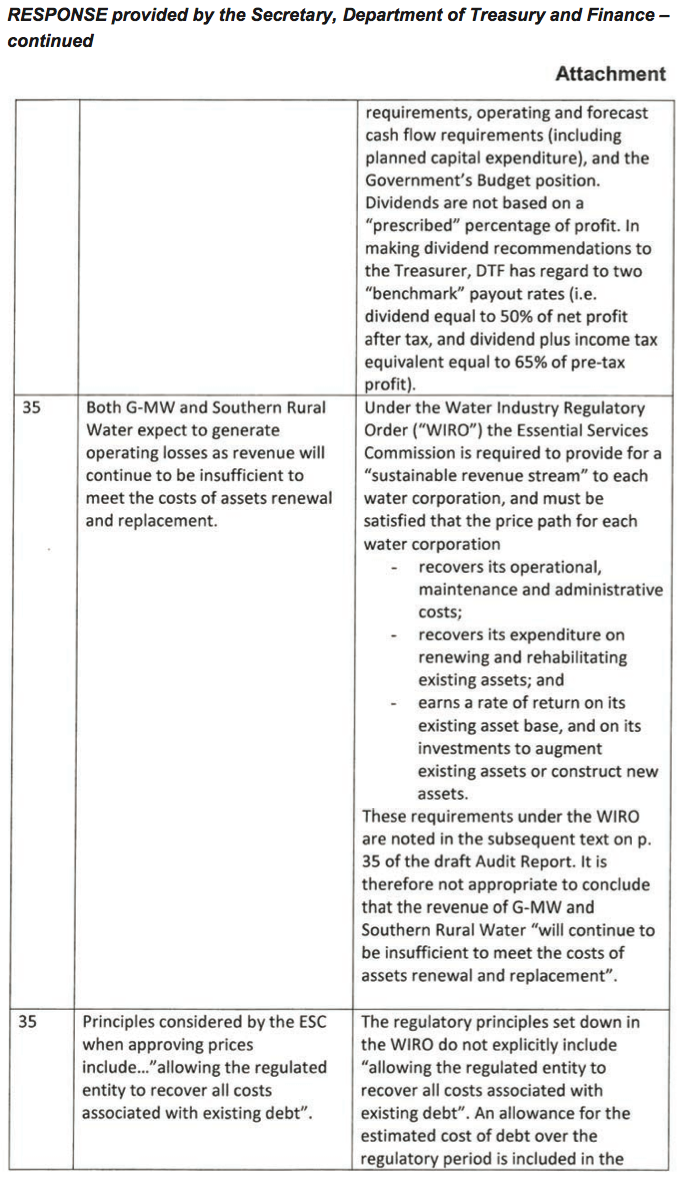
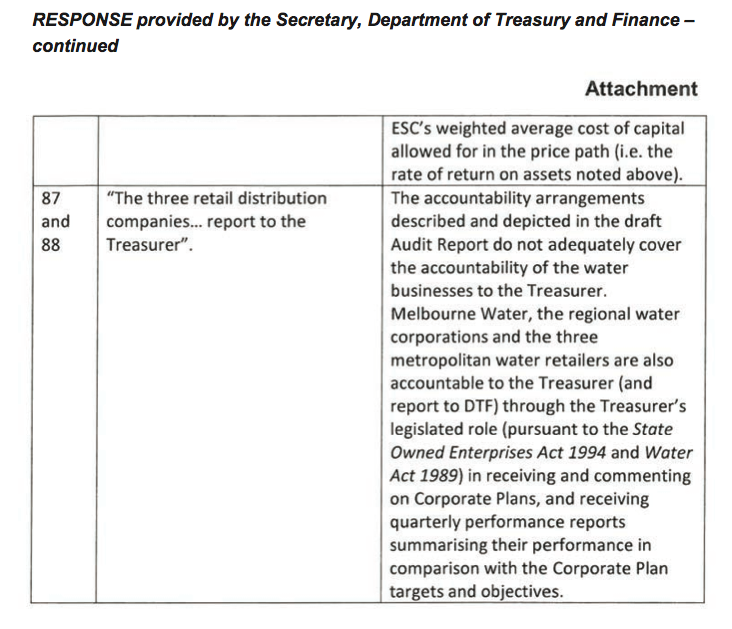
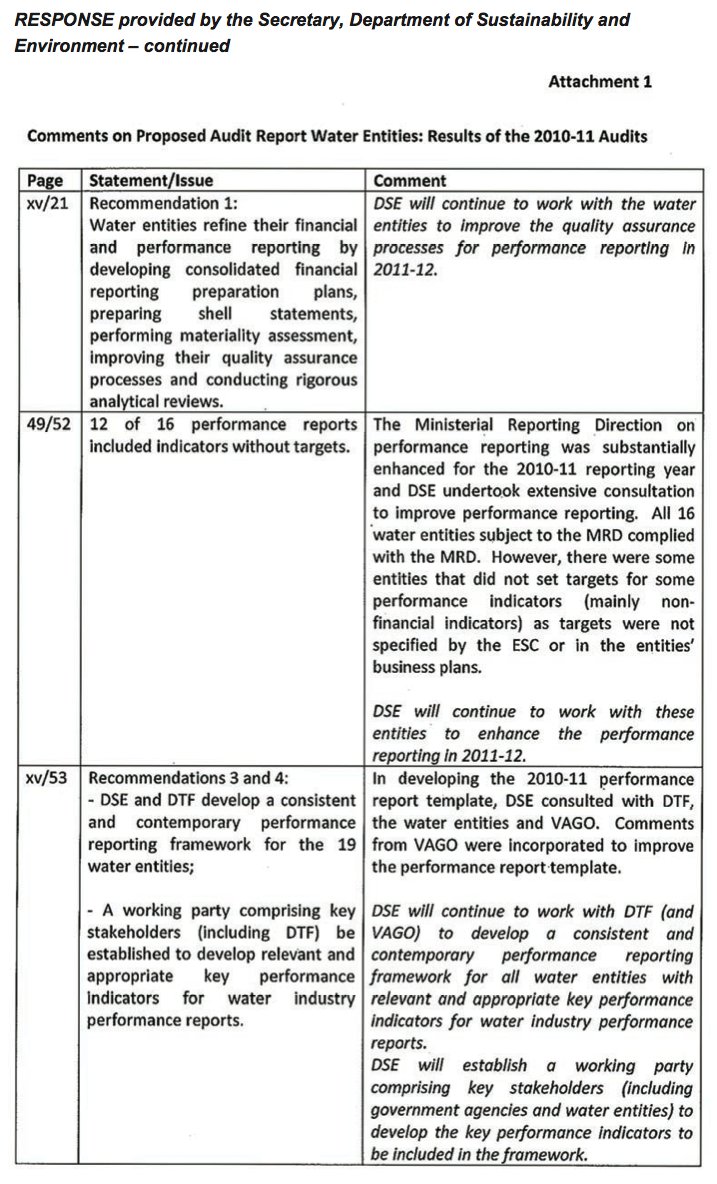
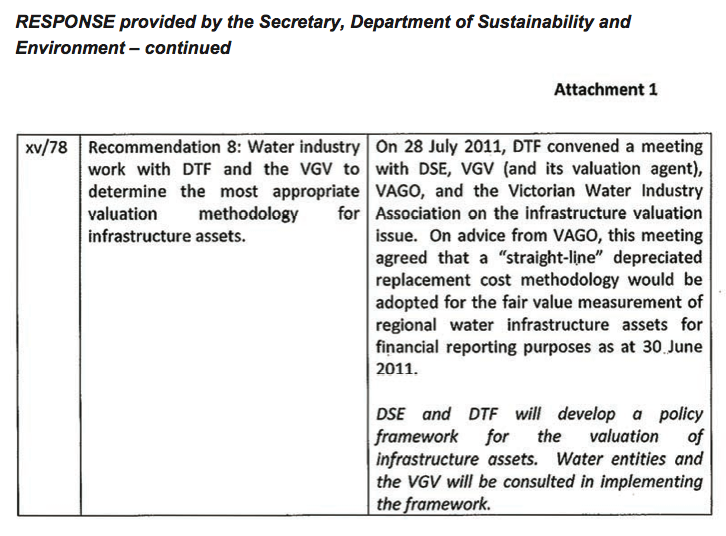
Auditor-General’s response to the Valuer-General Victoria
Water entity boards are responsible under the Australian Accounting Standards and the Financial Management Act 1994 for the valuation of their assets as presented in their annual financial reports. This responsibility requires entity boards, supported by management, to review the valuation methodology and assess the reasonableness of the resulting valuation. It is therefore important that the valuation methodology be discussed and agreed with entities before the valuations commence.
While an overview of the proposed valuation methodology was provided by the Valuer-General Victoria (VGV) at an early point in the process, details of critical assumptions underpinning the methodology, such as the condition based consumption curve, were not clear to the relevant stakeholders until the issue of the draft valuation reports in May and June 2011.
My report highlights that 11 of 15 regional urban and rural water entities held reservations with the valuation methodology. In particular the use of condition based consumption curves and non-linear assumptions to determine depreciated replacement cost was questioned by the entities. These reservations led six entities to reject the initial valuations. It was agreed by the Department of Treasury and Finance, the Department of Sustainability and Environment and my office, that certain valuation assumptions required revision in order to determine fair value in accordance with the Australian Accounting Standards and the Financial Management Act 1994.
Entity asset data was analysed by the VGV to assess its quality for asset valuation purposes early in the valuation process and the preferred valuer later found that data quality varied between the entities. Nevertheless my report highlights the nature and extent of errors identified by the water entities in the initial valuation reports, including instances of missing data, duplicate data, calculation errors and inappropriate unit cost rates. These errors indicate that the VGV quality assurance processes should be improved.