Auditor-General’s Report on the Annual Financial Report of the State of Victoria: 2022–23
Report snapshot
The 2022–23 Annual Financial Report of the State of Victoria (AFR) is free from material errors and we issued an unmodified (clear) audit opinion on it.
Audit outcomes
We issued clear opinions on 28 of the 29 material entities’ financial reports.
We continue to modify our audit opinion on the financial report of Victorian Rail Track, because of how it accounts for assets it leases to the Department of Transport and Planning.
Financial outcomes
The general government sector's (GGS) operating cash result turned around this year, with a surplus of $4.3 billion. This was only possible because of the $7.9 billion proceeds received from the VicRoads modernisation joint venture arrangement. A $3.6 billion operating cash deficit would have resulted without these proceeds.
The GGS made another operating loss from transactions of $8.8 billion. This is the fourth consecutive year of operating loss, resulting in accumulated losses of $43.7 billion. These losses erode reserves and reduce the state's financial resilience.
Returning to a surplus will require significant fiscal discipline to manage rising costs and deliver previously announced cost-saving initiatives.
Debt rose again this year at a pace faster than revenue and economic growth. If it continues to grow at this pace, the cost of servicing debt will compound this fiscal challenge. The government have not laid out a plan for when and how the state will pay down existing and future debt.
Several other emerging financial risks exist requiring close attention to manage financial sustainability.
Key audit matters
We identified weaknesses at some material entities, that impact the reliability and usefulness of their financial reports. We also continued to find significant weaknesses in information systems controls.
COVID-19 grant payments
During the COVID-19 pandemic, the former Department of Jobs, Precincts and Regions had to respond rapidly to implement a large-scale grants program to support businesses.
We identified a risk of significant fraud and uncovered serious deficiencies in grant program delivery and controls over fraud and error. It remains likely that undetected fraud occurred and errors were made in payments to some applicants.
Key numbers for the GGS for the year ended, and as at, 30 June 2023

Note: Numbers are rounded.
Source: VAGO.
Data dashboard
Click here to view the dashboard full screen
Our recommendations
We consulted with the audited agencies and considered their views when reaching our conclusions. The agencies’ full responses are in Appendix A.
Recommendations about audit outcomes, internal controls and financial reporting (parts 1, 2 and 3)
| We recommend that: | Response, where received | |
|---|---|---|
| Department of Treasury and Finance | 1. consider why quality issues with information provided by material entities arise and determine whether further training and guidance are required. | Agreed |
| 2. work with the government to set specific targets and precise timing of achieving its key financial measures and targets of net debt to gross state product and interest expense to revenue. | Noted | |
| 3. work with the government to outline its debt management strategy including when and how the state will be able to start to pay down the debt that it has and plans to accumulate. | Noted | |
| Relevant material entities | 4. develop and implement a robust quality assurance process over financial information provided to Department of Treasury and Finance for Annual Financial Report of the State of Victoria purposes. | – |
| 5. prioritise the resolution of information technology control deficiencies that pose a risk to achieving complete and accurate financial reporting, business objectives or compliance with legislation. | – | |
| Department of Premier and Cabinet | 6. work with the government, departments and state-controlled entities to reconsider the tabling schedule of annual reports, to reduce the information burden on Parliamentarians and the Victorian community, of tabling high volumes at the same time. | Not accepted |
Recommendations about the COVID-19 business support grants programs (Part 4)
| We recommend that: | Response | |
|---|---|---|
| Department of Jobs, Skills, Industry and Regions | 7. appoint an independent evaluator to assess and report on the effectiveness of the Business Costs Assistance Program and Licensed Hospitality Venue Fund grants programs and whether value for money was achieved. The evaluation should identify lessons learnt and make recommendations for future programs. | Accepted |
1. Audit outcomes
Conclusion
Our clear opinion provides reasonable assurance that the financial performance and position of the State of Victoria, and within that the general government sector, as reported in the 2022–23 Annual Financial Report of the State of Victoria (AFR), is reliable.
The separate financial reports of 28 of the 29 material entities, which are the entities that contribute most to the consolidated financial results in the AFR, are also reliable. We found material errors in the Victorian Rail Track's (VicTrack) financial report, but they were corrected on consolidation into the AFR.
In this part
1.1 The AFR opinion
We provided a clear (unmodified) audit opinion on the 2022–23 AFR.
Our clear opinion provides reasonable assurance that the financial performance and position of the State of Victoria, and within it the general government sector (GGS), as reported in the AFR, is free from material error.
Key audit matters
The auditor determines matters that are most significant and includes them in their report. This provides transparency and insight into the audit process.
Auditors may include a description of key audit matters in the auditor's report, as described in auditing standard ASA 701 Communicating Key Audit Matters in the Independent Auditor's Report.
Our audit report includes commentary on the following key audit matters:
- recognition and measurement of transport assets
- recognition and measurement of service concession assets, liabilities and commitments
- valuation of defined benefit superannuation liability
- valuation of provision for insurance claims.
A copy of our audit report is in Appendix C.
1.2 Audits of material entities
Each year we audit and provide separate audit opinions on the financial reports of the state-controlled entities that are consolidated into the AFR.
Appendix B contains more information about this. It also explains how the State of Victoria is made up of the GGS, public financial corporations (PFCs) and public non-financial corporations (PNFCs).
Clear opinions
In 2022–23, 29 entities accounted for most of the state's assets, liabilities, revenue and expenditure. We focused on the financial transactions and balances of these entities when forming our opinion on the AFR.
Material entities
The group of entities that account for most of the state’s assets, liabilities, revenue and expenses.
We issued clear opinions on 27 of the 29 material entities' financial reports at the time we issued our opinion on the AFR. We signed our audit opinion on Department of Government Services (DGS) after the AFR.
Appendix D lists these entities and the results of our audits of them.
Our adverse opinion for VicTrack
This is the fourth consecutive year we have issued an adverse audit opinion on VicTrack’s financial report.
Adverse opinion
We make an adverse opinion when an entity's financial reports are misrepresented, misstated or do not accurately reflect the entity's financial health.
VicTrack continues to account for the assets it leases to the Department of Transport and Planning (DTP) as operating leases. VicTrack asserts that it holds substantially all the risks and rewards incidental to ownership of the operational transport assets.
We disagree. VicTrack's incorrect accounting is material and pervasive to its financial report.
Our view is that DTP is responsible for the operation of the transport network as a whole and that, in this regard, DTP:
- directs the use of transport assets by setting the timetables and operating conditions for all modes of transport with no significant input from VicTrack
- substantially has the risks and rewards of ownership of the operational transport assets.
This is why we formed the view it is a finance lease.
Appendix E explains the accounting for lease arrangements of operational transport assets.
Our emphasis of matter for VGCCC
The Victorian Gambling and Casino Control Commission (VGCCC) regulates and collects casino and gambling tax on behalf of the state.
In 2021, the Victorian Government set up the Royal Commission into the Casino Operator and Licence (Royal Commission) to inquire and report on Crown Melbourne Limited’s (Crown Casino) suitability to hold its Victorian casino licence.
The Royal Commission delivered its final report in October 2021. During the Royal Commission hearing process, it alleged that Crown Casino may have underpaid casino tax. In response, Crown Casino reviewed its casino tax payments in July 2021. It then paid $62 million in tax it owed and penalty interest to the state.
Emphasis of matter
A paragraph included in the auditor’s report that refers to a matter that, while appropriately presented or disclosed in the financial report, is in the auditor’s judgement, of such importance that it is fundamental to users’ understanding of the financial report.
The state is still working with Crown Casino to assess if it owes more taxes to the state from the other matters revealed by the Royal Commission. This may lead to further tax and penalty interest payments. The emphasis of matter paragraph in our audit report draws the reader's attention to the state’s ongoing engagement with Crown Casino.
On 1 July 2023, VGCCC transferred its responsibilities to collect and verify casino tax to the State Revenue Office.
1.3 Timeliness of financial reports
The Department of Treasury and Finance (DTF) and state-controlled entities must complete financial reporting tasks by the dates set in the Financial Management Act 1994. Entities are required to provide financial reports to VAGO within eight weeks of balance date (30 June), which is 25 August.
The Audit Act 1994 requires us to provide the entity with an audit opinion within 4 weeks of receiving their financial reports. That means we should provide audit opinions by 22 September.
To meet their legislative timelines, DTF and VAGO rely on entities providing complete and accurate financial information on time. Delays impact the timeliness of our audit opinions and the preparation and tabling in Parliament of the material entities' financial reports and the AFR.
Timelines for 2022–23 reporting period
This year, 5 material entities provided certified financial reports and a further 21 provided draft financial reports by the due date of 25 August. We were then able to provide:
- 24 of the 29 material entities with an audit opinion by the due date on 22 September
- a further 4 material entities with an audit opinion before we gave the Treasurer our audit opinion on the AFR.
These results are consistent with 2021–22.
We did not complete our financial audit of DGS before finalising our audit of the AFR. This did not affect our ability to issue our audit opinion on the AFR because we had finished auditing the transactions and balances that were significant to the AFR.
The AFR was finalised and certified by management on 2 October. We provided our audit opinion on 5 October.
We experienced challenges with timely completion of DTF and DGS audits:
- DTF was delayed in providing a complete financial report for audit. Management provided working drafts of the financial report throughout the audit process. However, we received a complete financial report for the audit on 20 September 2023. This was a significant delay compared to the agreed date of 21 August 2023. The contributing factors for the delay were the resourcing constraints and insufficient preparation in a year where there was a significant impact on the financial reporting process due to machinery of government changes.
- DGS has not developed separate corporate systems since it commenced on 1 January 2023 and therefore relied on other departments to provide financial information for the preparation of the financial report. This delayed the year-end process.
Timeliness of state-controlled entities
There is a significant time lag between when a financial report and audit is finalised to when an annual report is made available to Parliament and the Victorian community.
As noted above, each year we provide opinions on the financial reports of approximately 280 state-controlled entities consolidated into the AFR. Under the Financial Management Act 1994, these entities have until 31 October to table their annual reports. They must also table their annual reports when Parliament is sitting.
We issued our audit reports for 243 or 85 per cent of these state-controlled entity financial reports on average, 36 days before 31 October 2023. This includes audit reports of both parent and subsidiary entity financial reports.
An annual report is a report that shows the operational and financial performance of an agency for the preceding financial year. The financial performance is represented by the financial report of the agency, which we audit.
On 1 November 2023, 179 state-controlled entity annual reports were tabled in Parliament; 6 annual reports were tabled the day before. The annual reports tabled include both parent and subsidiary entity financial data and known as consolidated financial reports, so the total number of state-controlled entity reports tabled is higher.
The time lag in tabling impedes accountability and transparency of entity performance because tabling a high volume of annual reports at the same time creates a significant information burden on Parliamentarians and the Victorian community, making it challenging to consume key outcomes.
1.4 Quality of information provided to DTF
DTF relies on state-controlled entities providing it with timely, complete and accurate financial information so that it can prepare the AFR.
|
DTF requested … |
To provide their trial balance by … |
And supplementary information for disclosures by … |
|---|---|---|
|
GGS entities |
26 July 2023 |
9 August 2023. |
|
PFC and PNFC entities |
1 August 2023 |
Each entity's chief financial officer must certify that the information provided to DTF is complete and accurate.
Financial information provided by 4 material entities this year was either:
- late and/or
- the quality of financial information could be improved, evident by significant errors we identified. These include service concession arrangements liabilities that were omitted and cashflow errors.
2. Financial outcomes for the GGS
Conclusion
The operating cash result turned around this year, with a surplus of $4.3 billion ($8.9 billion deficit in 2021–22). However, this includes the $7.9 billion proceeds from the VicRoads modernisation joint-venture arrangement. The GGS would have reported an operating cash deficit of $3.6 billion without this inflow. It also loses some of the future cash inflows from the registration and licensing activities that it controlled before the joint-venture arrangement.
The GGS incurred another operating loss from transactions this year of $8.8 billion, an improvement from last year's loss of $13.8 billion. This is the fourth consecutive year of losses, with an accumulated loss of $43.7 billion over that period. The response to the COVID-19 pandemic contributed to these losses.
The state forecasts that the GGS will return to a net operating surplus by 2025–26, but not before expecting to incur 2 more years of operating losses, which will bring the combined losses to $48.8 billion.
The path to a return to surplus will continue to require significant fiscal discipline to manage rising employee and other costs, and to deliver the cost-saving initiatives announced in past budgets.
Operating losses erode reserves and make the state less financially resilient and able to respond to short term emergencies. The imperative to return to operating surpluses sooner is also given sharper focus by the state's debt levels, which are growing faster than its revenues; and also because of the growing bite that interest is taking out of revenues.
Gross debt for the GGS increased by $24.7 billion in 2022–23 to fund planned and unplanned infrastructure investment. Since 2019–20, gross debt as a percentage of gross state product has grown rapidly, with this trend expected to continue. If debt continues to grow faster than the economy, this will compound the fiscal challenge. There is presently no indication, based on the current budgetary horizons of when and how the state will be able to start to pay down the debt that it has and plans to accumulate.
Several other emerging financial risks require close attention to manage longer-term financial sustainability. If these challenges are not adequately managed, further additional unplanned debt may occur or announced government priorities may need to be curtailed.
In this part:
Fiscal sustainability
According to the Organisation for Economic Co-operation and Development's Government at a Glance 2013 publication, ‘Fiscal sustainability is the ability of a government to maintain public finances at a credible and serviceable position over the long term. High and increasing debt levels are harmful to governments' fiscal position and can cause a vicious cycle of growing debt, reducing the potential for economic growth as funds are diverted away from productive investments’.
Fiscal sustainability is also a requirement of macro economic stability and sustainable long-term growth.
2.1 GGS financial measures and targets
The state Budget sets out the Victorian Government’s long-term financial management objectives for the GGS and the key financial measures and targets to achieve them.
The measures and targets remain largely unchanged. They were amended in 2020–21 to reflect the uncertain economic and fiscal environment and the government’s focus on economic recovery after the COVID-19 pandemic. The targets are mostly qualitative rather than quantitative to allow for greater flexibility in times of economic and fiscal uncertainty except for one: fully funding the unfunded superannuation liability by 2035.
Figure 2A shows the government has 2 objectives to support fiscal sustainability. These objectives have not changed significantly in the last 3 years.
Figure 2A: GGS short-term objectives
| Financial year | Operating cash surplus | Net operating balance |
|---|---|---|
| 2023–24 | Operating cash surplus will be achieved by 2022–23 and maintained over the Budget and forward estimates period. | Net operating balance will return to a surplus by 2025–26. |
| 2022–23 | Operating cash surplus will be achieved by 2022–23. | Net operating balance will return to a surplus by the end of the forward estimates period. |
| 2021–22 | Operating cash surplus will be achieved before the end of the forward estimates period. | – |
Source: VAGO, based on data from the state Budget.
The government's key financial measures and targets for the GGS and the actual outcomes it reported for the last 2 years are set out in Figure 2B.
Figure 2B: GGS key financial measures, targets and results
| Financial measure | Target | 2021–22 actual | 2022–23 Budget | 2022–23 actual |
|---|---|---|---|---|
| Operating cash surplus/deficit(a) | A net operating cash surplus consistent with maintaining GGS net debt at a sustainable level | $8.9 billion net operating cash deficit | $1.3 billion net operating cash surplus | $4.3 billion net operating cash surplus |
| Net debt to gross state product (GSP)(b) | GGS net debt as a percentage of GSP to stabilise in the medium term | 19.4% | 21.7% | 20.3% |
| Interest expense to revenue | GGS interest expense as a percentage of revenue to stabilise in the medium term | 3.5% | 4.8% | 4.7% |
| Superannuation liabilities (contribution to the State Superannuation Fund) | Fully fund the unfunded superannuation liability by 2035 | $1.0 billion | $1.1 billion | $0.6 billion |
Note: (a)These are the net cashflows from operating activities as disclosed in the consolidated cashflow statement. (b)Net debt is gross debt less liquid financial assets. It is the sum of deposits held, advances received, government securities, loans and other borrowings less the sum of cash and deposits, advances paid, investments, loans and placements.
Source: VAGO, based on data from the state Budget, the AFR and a publicly announced policy costing.
The government's approach to setting key financial measures and targets has changed over the last 10 years. Appendix F shows the various measures the government has used and how they vary from specifically quantifiable targets to targets that provide flexibility in response to economic conditions.
2.2 Operating outcomes
GGS net operating result
The net operating result, or net result from transactions, is a key measure of the GGS's financial performance and operating sustainability. The GGS reported a net loss from transactions of $8.8 billion this year, which is an improvement of $5.0 billion compared to last year. However, it is a greater loss than estimated in the state Budget.
Positive trends in revenue and expenditure led to an improvement in the GGS operating result this year:
- operating revenue increased by $1.7 billion from $83.0 billion in 2021–22 to $84.7 billion
- operating expenses decreased by $3.2 billion from $96.8 billion in 2021–22 to $93.6 billion.
The increase in revenue was driven by improved economic conditions, with:
- an increase of $1.8 billion in taxation revenue compared to 2021–22 because land tax receipts grew reflecting strong post-pandemic land value growth and higher payroll tax revenue from the stronger labour market
- introduction of the mental health and wellbeing levy, which came into effect on 1 January 2022
- higher interest income of $750 million earnt from financial asset investments due to the multiple interest rate rises occurring across the period.
The state also experienced an increase of $619 million from the sale of goods and services. This was primarily due to the upfront recognition of licence revenue from the VicRoads modernisation joint-venture arrangement for its right to deliver specific administrative and cash collection services.
The above increases were partially offset by a $1.7 billion reduction in Commonwealth grant revenue. This is because in 2021–22 greater funds were received to help support the COVID-19 health response and fiscal measures to support impacted businesses as a result of pandemic mitigation strategies.
A decrease in total expenses was also experienced compared to the previous year, largely due to significant reductions in grant payments to Victorian businesses impacted by the pandemic.
Figure 2C shows the GGS has reported a net operating deficit over the last 4 financial years, with an accumulated loss of $43.7 billion over that period.
Figure 2C: GGS net operating result
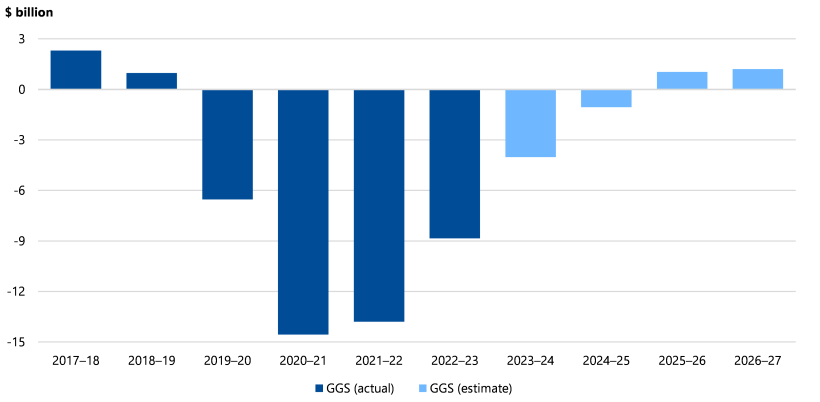
Source: VAGO, based on the AFR and state Budget.
The government has forecast operating deficits over the next 2 financial years, which would bring combined losses to $48.8 billion over 6 years.
Figure 2D shows that between 2017–18 and 2020–21 growth in operating expenditure outpaced growth in operating revenues. In 2021–22 this trend reversed and has continued in 2022–23.
Figure 2D: Annual growth in GGS operating revenue and expenditure
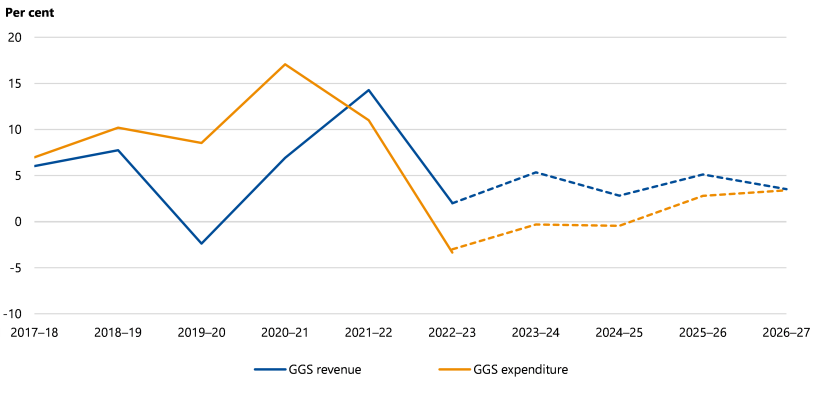
Source: VAGO, based on the AFR and state Budget.
From 2023–24 to 2026–27 revenue is forecast to grow by an average of 4.2 per cent per year and expenses by an average of 1.4 per cent per year. If achieved, this will enable a return to a net operating surplus by 2025–26.
The path to a return to surplus will continue to require significant fiscal discipline to manage rising employee and other costs and to deliver the cost saving initiatives announced in past budgets, such as the targeted public sector staff reductions.
Operating losses erode reserves and make the state less financially resilient and able to respond to short term emergencies. The imperative to return to operating surpluses sooner is also given sharper focus by the state's debt levels, which are growing faster than its revenues; and also because of the growing bite that interest is taking out of revenues, which we explain further below.
Operating cash result
The government has acknowledged that sound fiscal management in the medium term requires the realignment of revenues and expenditure coupled with a strategy to fund the government’s infrastructure program. To that end, the government developed a medium-term fiscal strategy aligned with its key financial measures and sustainability objectives in 2020–21. It involved 4 steps:
- step 1: creating jobs, reducing unemployment and restoring economic growth
- step 2: returning to an operating cash surplus
- step 3: returning to operating surpluses
- step 4: stabilising debt levels.
Returning to an operating cash surplus has been achieved in 2022–23. The GGS reported a $4.3 billion operating cash surplus. This was directly a result of $7.9 billion of proceeds received from the VicRoads modernisation joint-venture arrangement. The GGS would have reported an operating cash deficit of $3.6 billion without these proceeds.
The government established the Victorian Future Fund using these proceeds to support the state’s debt stabilisation strategy. In its 2023–24 state Budget the government also introduced a new temporary and targeted COVID-19 debt levy with 2 components: the payroll tax component and the landholding tax component. These levies aim to raise a significant portion of funds to offset the impact of COVID-19 debt including interest from 2023 to 2033.
2.3 State indebtedness
Driven by governments’ financing stimulus and support packages through the pandemic, public debt across the world has grown. In Australia, debt of both federal and state governments has risen sharply.
Victorian state debt is historically high and expected to grow as the government continues to borrow to fund its significant planned infrastructure program. This is shown in Figure 2E.
Figure 2E: Growth of Victoria’s gross debt
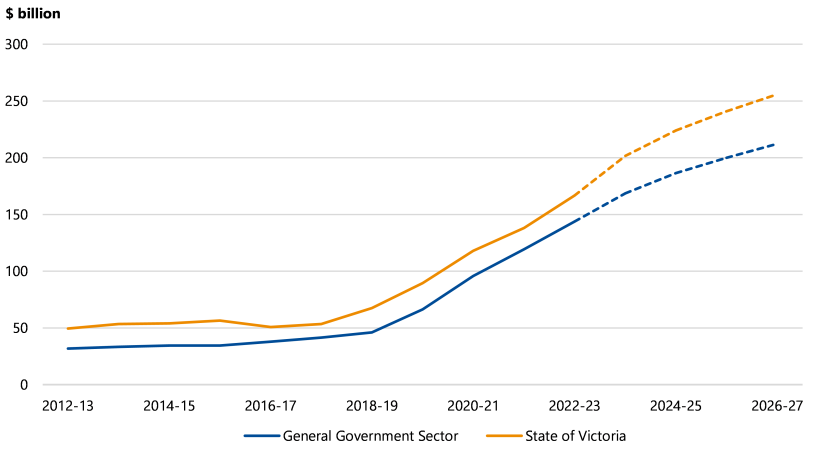
Source: VAGO, based on data from the AFR and state Budget.
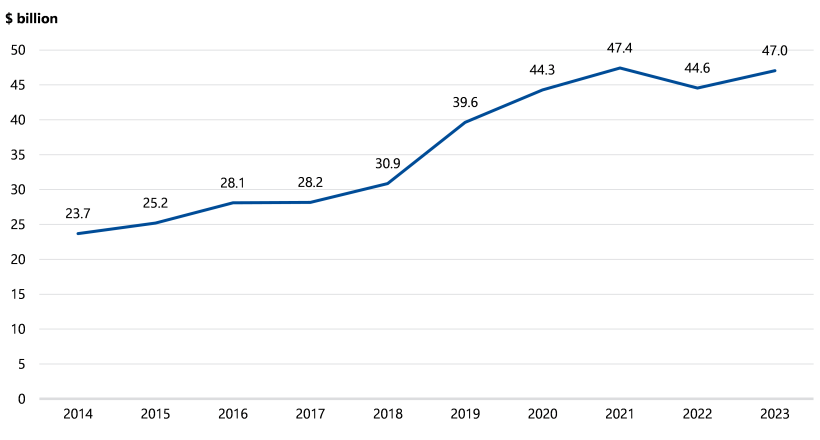
The GGS's gross debt increased from $66.5 billion in 2019–20 to $143.9 billion in 2022–23. The growth in debt was in part used to fund the state's operating deficit in response to the COVID-19 pandemic, and in part to fund the planned infrastructure programs and unplanned cost overruns on existing infrastructure projects.
GGS gross debt is expected to grow to $212 billion by 30 June 2027. The state's total debt follows a similar growth pattern and was $166.7 billion as at 30 June 2023. It is expected to grow to $256 billion by 30 June 2027.
Accessing debt as a funding source is not necessarily a burden on the government and taxpayers. It allows the government to allocate resources and invest in intergenerational initiatives that taxpayers cannot otherwise afford to fund today. However, an unsustainable and rising level of debt can pose a significant risk to future prosperity. It also threatens economic stability if not managed in a fiscally sustainable manner because debt imposes direct cost on taxpayers now and in the future.
Victoria’s debt growth has outpaced other states
Figure 2F shows GGS total net debt of all Australian states as a percentage of nominal GSP of each state. This is a common measure used across jurisdictions to understand their relative indebtedness. Victoria’s debt to GSP ratio was comparable to other states prior to the pandemic. Since then it has diverged significantly. This trend is forecast to continue until 2026–27.
Figure 2F: Net debt of Australian GGSs by state
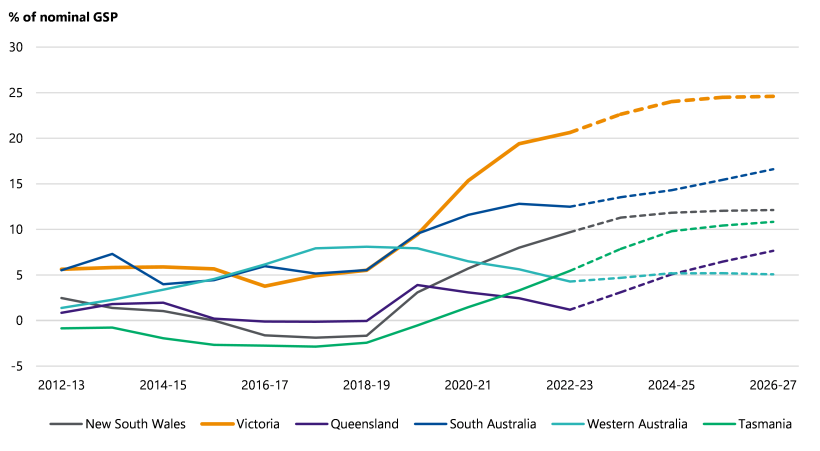
Source: VAGO, based on state budgets of respective jurisdictions.
If debt continues to grow at the same pace and maturing debt is not repaid, this presents long-term financial sustainability risks.
Should it wish to, there is presently no indication, based on the current budgetary horizons of how and when the state will be able to start to pay down the debt that it has and will continue to accumulate. The state must consistently achieve operating surpluses before it can stabilise its growing debt levels. If the state wishes to reduce debt it would need to divert spending away from other public services, increase its revenues, or sell assets.
Debt sustainability
The state Budget is focused on GGS debt as it relates to financial sustainability. The government assesses the sustainability of the debt by applying the following financial measures:
- net debt to GSP
- interest expense to revenue.
We also consider appropriate measures to be:
- gross debt to GSP
- gross debt to revenue (indebtedness) – gross debt as a proportion of operating revenue
- interest expense relative to the portfolio of debt – considering new and refinanced (rolled over) debt and the maturity profile.
The impact of rising debt on these debt sustainability measures are discussed further in this part and our emerging risk analysis in Section 2.4.
Gross debt as a proportion of GSP
Gross debt to GSP is a key financial measure of the GGS and an indicator of the size of the state’s debt in relation to the size of the economy. The higher this ratio, the more difficult it is for the state to pay back its debt. An increasing ratio means that state debt is growing faster than the economy. This scenario puts additional pressure on debt service costs and consequently the net operating results, which makes it harder to repay debt.
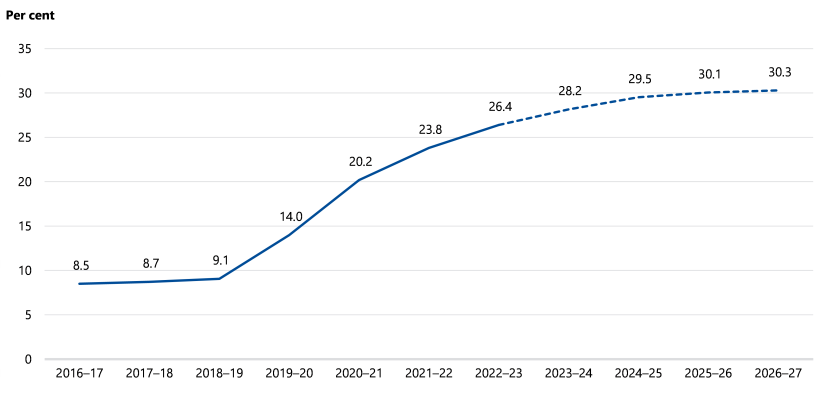
Figure 2G shows that gross debt as a percentage of GSP has rapidly grown and is expected to increase to 30.3 per cent in 2026–27.
Figure 2G: GGS gross debt as a percentage of GSP
Source: VAGO, based on the AFR and state Budget.
Step 4 of the government’s key financial measures and sustainability objectives is stabilising debt levels. However, the government has not set a specific target for net debt to GSP ratio or a year by which it expects to achieve stabilisation. Average growth of GGS gross debt from 2018–19 to 2022–23 was 30.1 per cent per year. GGS gross debt is forecast to increase from 26.4 per cent in 2022–23 to 30.3 per cent of GSP in 2026–27, growing at an average rate of 10.3 per cent per year during that period.
Gross debt as a proportion of operating revenue
While state governments commonly use net debt as a proportion of GSP as a measure, gross debt to public sector operating revenue is also a useful measure of fiscal sustainability. This can be particularly informative:
- if the growth in state revenue uncouples from economic growth
- in higher interest rate regimes, especially where the interest rate is higher than annual GSP growth.
In these scenarios debt servicing can be problematic because interest repayments take a greater bite from operating revenue.
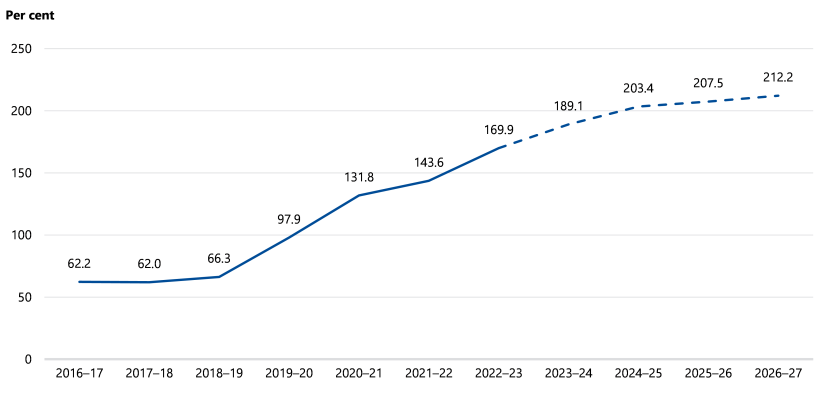
Figure 2H shows that gross debt as a proportion of operating revenue is continuing to increase.
Figure 2H: GGS gross debt as a proportion of operating revenue
Source: VAGO, based on the state Budget.
Interest expense as a proportion of operating revenue
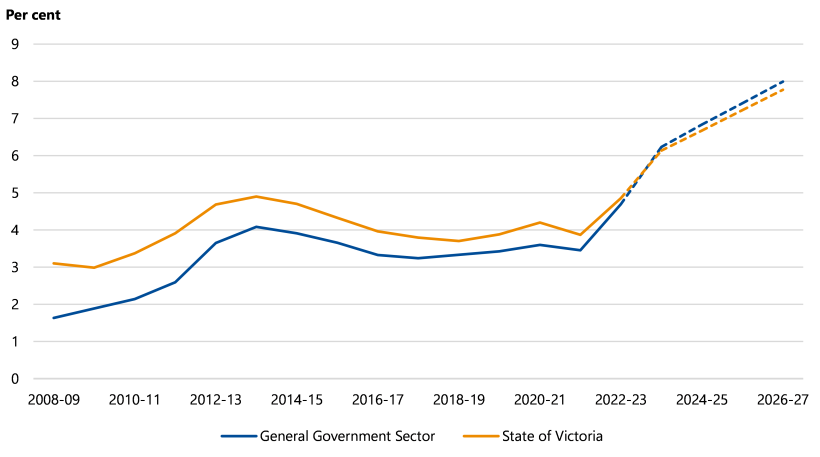
Stabilising GGS interest expense as a percentage of revenue in the medium term is one of the government’s financial measures and targets. As the state’s debt increases, and as interest rates rise, so does the interest expense incurred to service the debt.
Comparing interest expense to operating revenue provides information on the share of revenue devoted to servicing debt costs (the interest bite). Figure 2I shows that the interest bite will increase significantly over the next 4 financial years. In 2022–23, 4.7 per cent of the GGS operating revenue, or $4.0 billion, was needed to service debt costs compared to 3.4 per cent, or $2.3 billion, in 2019–20. This is estimated to increase to 8.0 per cent, or $8 billion, by 2026–27.
Figure 2I: Interest expense as a percentage of revenue
Source: VAGO, based on the AFR and state Budget.
While the government aims to stabilise interest expense to revenue in the medium term, it has not set a specific and measurable target, or the year it expects to achieve this measure.
2.4 Emerging risks
Employee cost growth
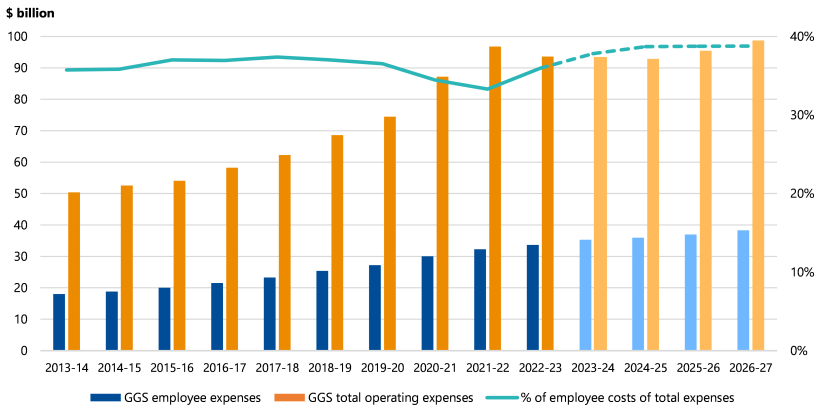
Employee costs are the state’s largest single operating expense. In 2022–23, the state paid its employees $35.2 billion, which was 31.6 per cent of its total operating expenses (compared to 30.2 per cent in 2021–22).
Most of these costs are incurred in the GGS, where they account for 35.9 per cent of sector expenditure. In the last year, GGS employee expenses grew by $1.4 billion (4.3 per cent) to $33.6 billion.
Employee costs in the GGS have risen by 44.5 per cent over the past 6 years, from $23.3 billion in 2017–18 to $33.6 billion in 2022–23. The government forecasts they will grow by another 13.8 per cent over the next 4 years, to $38.3 billion in 2026–27.
Figure 2J: GGS employee expenses as a proportion of total expenditure
Source: VAGO, based on the AFR and state Budget.
The proportion of employee costs compared to the total operating expenses has been around 36 per cent over the past 10 years. However, it is expected to grow from 35.9 per cent in 2022–23 to 38.8 per cent by 2026–27. Changes in both employee expenses and total expenditure drive this proportion. For example, during the pandemic period of 2020–21 to 2021–22, COVID-19 grant payments to Victorian business were at an unprecedented level of $11 billion and therefore the proportion of employee expenses decreased, as can be seen in Figure 2J.
Figure 2K shows that the number of Victorian Public Service (VPS) and other public entity employees increased over the 5-year period to 30 June 2022. At the time of writing this report, the Victorian Public Sector Commission had not released employee data for the year ended 30 June 2023.
The VPS has grown by 22.3 per cent and other public entities by 14.4 per cent. In the period from 2019–20 to 2021–22, VPS employees increased by 24,887 or 9.4 per cent as the government responded to COVID-19 pandemic.
Figure 2K: VPS and public sector employees
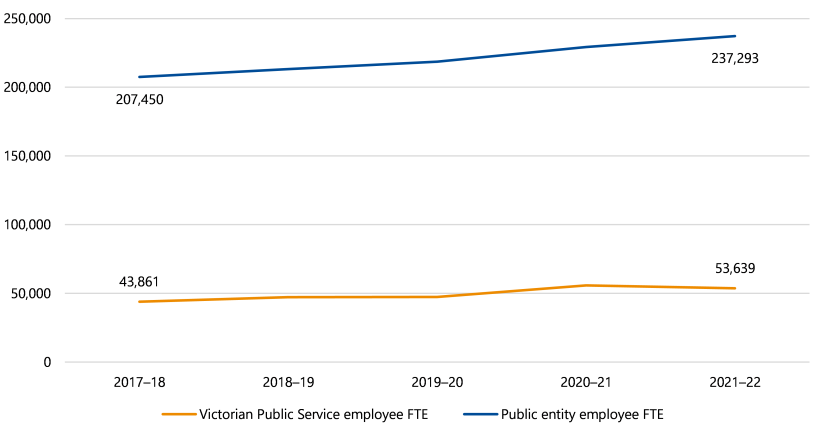
Note: FTE = full-time equivalent.
Source: Victorian Public Sector Commission.
Three quarters of the VPS employees have VPS grade classifications. Other VPS employees have occupation specific classifications (for example, custodial officers, child protection workers).
As a proportion of the VPS, senior technical specialists and executives are the smallest groups (2.0 and 3.5 per cent or 1,092 and 1,887 employees respectively). However, the number of senior technical specialists has grown by over 200 per cent and executives by 87 per cent over the 5 years to 30 June 2022.
The government determined that workforce transition, including staff reductions, is required to achieve its targeted cost reductions. The government’s workforce transition policy is focused on the VPS and it aims to ensure a consistent and compliant approach across the public service.
Departmental secretaries manage this workforce transition with oversight by the Victorian Secretaries’ Board. Each departmental secretary was required to develop a workforce transition plan and provide it to the secretary of the Department of Premier and Cabinet for approval before proceeding with any changes.
The government budget estimates of the past few years and in 2023–24 included targeted cost-saving initiatives through staff reductions. If these initiatives are not implemented and realised as planned, the employee cost may be greater than estimated.
The prevailing economic environment of high inflation, a tight labour market, high wage growth and various enterprise bargaining agreements (for example, the VPS Enterprise Agreement 2020, due for negotiation in 2024) may compound these challenges. The Government’s Wages Policy, established to set parameters around public sector enterprise bargaining, is expected to assist in managing some of these challenges.
Growing cost of servicing debt – interest cost
Interest rates have risen sharply in response to monetary policy tightening to counter rising inflation. The transition from a low-interest to a higher interest rate environment after the COVID-19 pandemic will increase the cost of debt to be refinanced and new debt issued from 2023. This presents a significant risk to the state.
Treasury Corporation of Victoria (TCV) facilitates the raising of state debt by issuing bonds (a loan for a specific period, with regular interest payments made over the period, and repayment in full at the end) to both the domestic and international capital markets. It then lends this (on-lends) to DTF or other government entities. DTF uses the amounts borrowed to fund the government initiatives. The analysis below relates to debt issued by TCV on behalf of the state.
Fixed-rate debt issued at a low interest rate, including debt issued during the COVID 19 pandemic, dominates the overall profile of TCV's current debt.
Figure 2L: Total financing required by the state by origin over the next 4 years
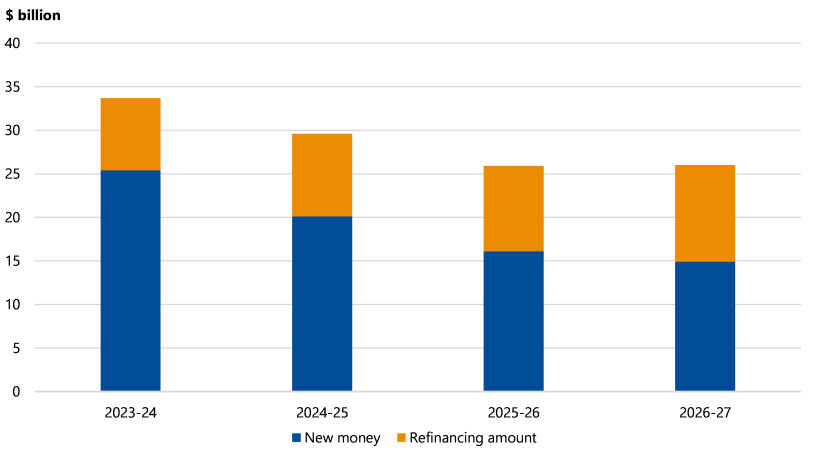
Note: New money refers to the funds required to finance new capital projects and operational needs.
Refinancing refers to the replacement of an existing debt obligation with another debt obligation under different terms. It is usually performed to extend the original debt over a longer period of time, to change fees or interest rates, or move from a fixed to variable interest rate.
Source: VAGO, based on TCV.
More than 88 per cent, or $124.1 billion, of the debt borrowed by TCV and lent to the state at 30 June 2023 is held under a fixed interest rate. Figure 2L shows the total financing required by the state, by type, over the next 4 years.
The state needs to refinance $38.7 billion by 30 June 2027. In all, approximately $90.8 billion of fixed rate debt must be refinanced by TCV between 2023–24 and 2032–33.
As currently issued debt matures between 2024 and 2027, interest paid on it will decrease approximately from $4.1 billion to $2.8 billion. However, as this debt is refinanced and new funding requirements are financed, total new financing interest expenses are projected to rise approximately from $1.6 billion to over $5.5 billion over the same period as seen in Figure 2M.
Figure 2M: Expected interest cost on TCV debt including new and refinanced debt
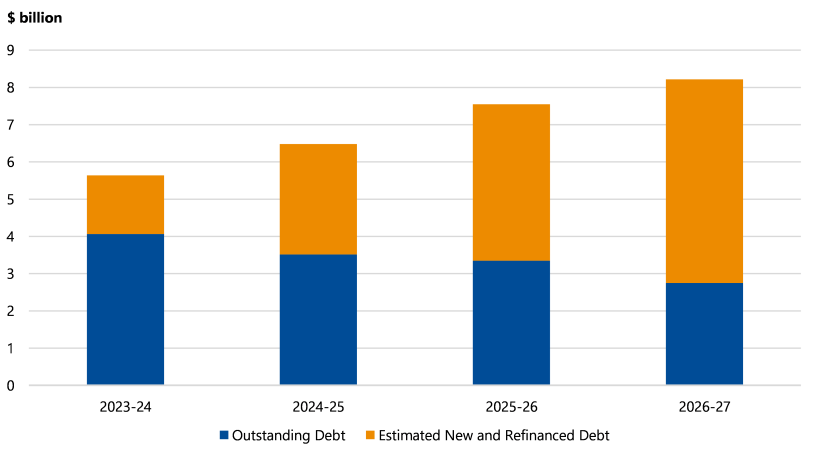
Source: VAGO, based on TCV.
It is likely that refinanced debt will be at a significantly higher interest rate, which will result in a higher interest payment and increase the state's cost to service the debt. This presents a significant financial sustainability challenge.
Refinancing of maturing debt between 2024 to 2033 approximately amounting to $90.8 billion at higher interest rate and estimated new financing based on budgeted and estimated debt level is likely to increase the state’s interest bill over $12 billion by 2033. For example, in 2025–26 approximately $9.6 billion of fixed-rate bonds issued over the last 3 to 4 years when interest rates were at historical lows will mature. If TCV refinances these bonds now in the current high interest rate environment, the interests on this debt will be above 4.5 per cent based on current yields.
Infrastructure spending
The GGS outlaid $16.3 billion on infrastructure assets this year, an increase of $1.1 billion compared to last year's cash outlays of $15.2 billion.
We have tracked the performance of major capital projects, which are projects expected to cost more than $100 million, for the last 3 years.
In the 2023–24 state Budget the government committed to investing $201 billion in capital projects. This is a net increase of $16 billion from the same time last year.
We have analysed completed and active major projects and found that the total estimated investment (TEI) of the 89 projects had increased by $11 billion, or 11 per cent, since they first appeared in Budget Paper 4: State Capital Program. This was because:
- the TEI of 41 (or 46 per cent of) projects increased by $13.5 billion
- the TEI of 12 (or 14 per cent of) projects decreased by $2.6 billion
- the TEI of 36 (or 40 per cent of) existing and complete projects did not change.
There has been another net increase in the TEI of the major projects since last year. In 2021–22 we reported a net increase in budgeted costs of $11.2 billion, or 12 per cent.
If these adverse cost outcomes persist, more unplanned debt will be required unless the announced capital program is curtailed.
Superannuation funding risks
Fully funding the unfunded superannuation liability by 2035
The state’s public sector defined benefit superannuation plans are responsible for the liability for employee superannuation entitlements. These plans are not consolidated in the AFR as they are not controlled by the state. The superannuation funds principally operated for the GGS employees are not fully funded. The funding of these superannuation liabilities is the responsibility of the state and therefore a liability is recognised in the AFR in respect of these obligations.
The state's liabilities include a superannuation liability of $18.9 billion at 30 June 2023. In accordance with the requirements of Australian Accounting Standard AASB 119 Employees Benefits, this liability is valued using a discount rate based on Australian Government bond yields. However, the state's funding requirement is determined using the expected return on the superannuation assets. On this basis, the state's actuary has estimated unfunded superannuation liability to be $11.7 billion at 30 June 2023. Given the expected return on assets is currently greater than the Australian Government's bond yield, unfunded superannuation liability for funding purpose is lower than the superannuation liability reported in the AFR.
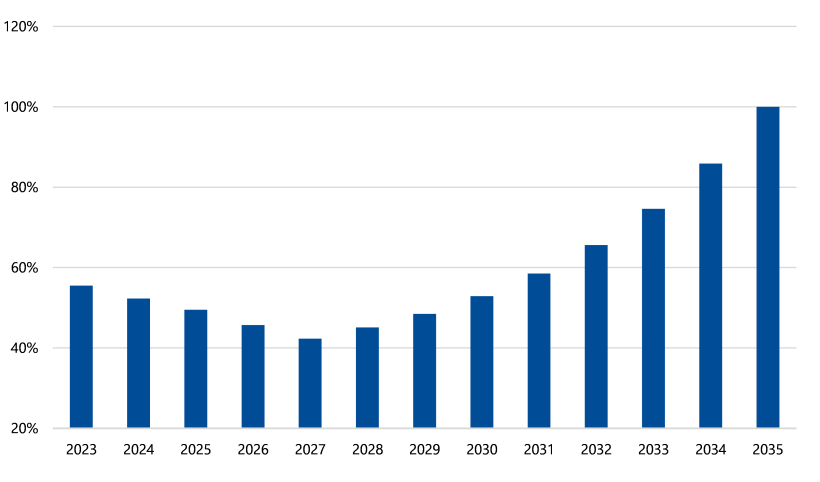
The government targets to fully fund the superannuation liability by 2035 by way of annual contributions, with this being a key financial measure.
Following the Victorian election in 2022, the government deferred its annual contribution payments from 2023 to 2027 by $3.0 billion. The government did not explain why the contribution payments were varied and deferred. However, it maintains its commitment to fully fund the liability by 2035.
In the last 5 years the government has contributed around $1.0 billion each year to achieve this target. This has been reduced to a $400 million average contribution per year from 2023 to 2027. The government will need to increase the contribution to an average of $2 billion per year from 2027 to 2035 to meet its commitment to fully fund the liability by 2035.
Nominal value
Nominal value is the value measured in terms of absolute money amount without taking inflation or other factors into account.
Achieving the contributions target set under the revised plan from 2027 will pose a significant challenge to the government. Rising employee costs, service delivery costs and interest bite continue to add considerable strain on the state Budget now and into the future. A significant increase in superannuation contribution from 2027 may compound these challenges.
The state engaged an actuarial expert to value the liability at 30 June 2023 for financial reporting purposes. As a result of the deferred contribution payments, the actuary estimates that to ensure the fully funded target is met by 2035, all things staying equal, the government will need to contribute an extra $2.9 billion (nominal value) over the 8 years from 1 July 2027. This estimate is based on current assumptions used to determine the funding requirements.
Figures 2N and 2O show the changes in 2023 compared with the 2022 contribution plan and funding position of the superannuation liability.
Figure 2N: Projected annual contributions
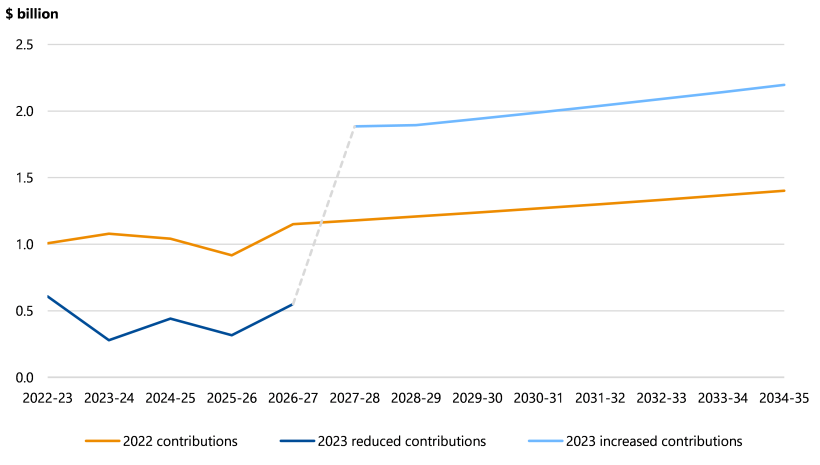
Source: VAGO, based on DTF.
Figure 2O: Projected funding position at 30 June
Source: VAGO, based on DTF.
This projection is further subject to significant estimation uncertainty due to the nature of the financial assumptions, such as expected return on investments and salary and pension increases used in valuing the liability.
For an example, a lower-than-expected investment return from the fund’s asset will require more contributions from the government to fully fund the liability by 2035. The government has assumed an overall long term investment return of 7.75 per cent. If the actual investment return is 1 per cent lower than assumed, the government will have to meet a shortfall of $3.8 billion (nominal value) as a one-off payment in 2035 to fully fund the liability.
Insurance claims liability
Three of the 7 PFCs are insurers – Victorian WorkCover Authority (WorkSafe), Transport Accident Commission (TAC) and Victorian Managed Insurance Authority. These entities, which are not in the GGS, have a considerable influence on the net result and balance sheet of the state.
At 30 June 2023, these insurers held $50.3 billion of total assets and had $50.4 billion of total liabilities. Of those liabilities, $46.8 billion (93 per cent) related to outstanding insurance claims.
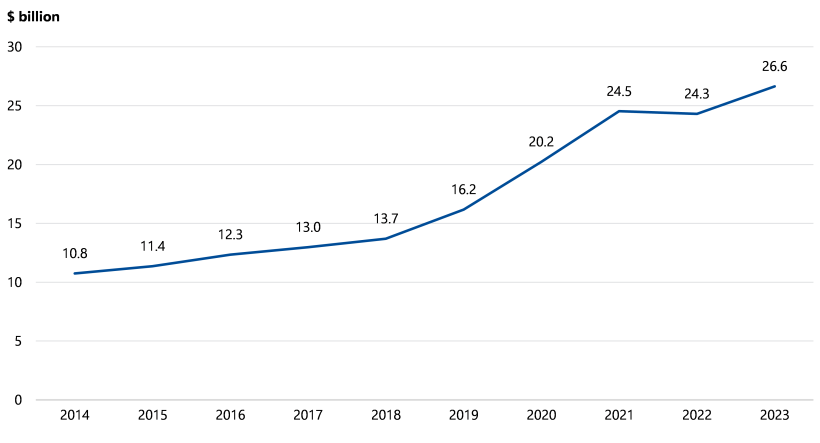
Figure 2P shows that the value of the total outstanding claims insurance liability of the state continues to grow.
Figure 2P: Total insurance liability at 30 June
Source: VAGO, based on the AFR.
WorkSafe contributed to 56.6 per cent of the total outstanding claims insurance liability at 30 June 2023. It remains the primary driver of insurance liability growth over time. The $2.3 billion increase in WorkSafe's claims liability is further described below.
WorkSafe
WorkSafe is Victoria's workplace health and safety regulator. It manages the WorkCover insurance scheme and aims to reduce harm in the workplace and improve outcomes for injured workers.
Figure 2Q shows that the value of WorkSafe’s outstanding insurance claims has increased by more than 146 per cent over the last 10 years. In 2022–23 the liability increased by $2.3 billion following a decrease of $215 million in 2021–22 due to changes in economic assumptions including discount rate used to measure the liability.
Figure 2Q: WorkSafe's outstanding insurance claims liability at 30 June
Source: VAGO, based on data from WorkSafe's financial reports.
Benefits paid to workers is the major contributor to the significant growth of the WorkSafe claims cost and the outstanding insurance claims. Weekly payments supplement wages when workers are unable to work and are split between mental injury and physical claims.
The average growth rate per year of mental injury claims liability since 2017–18 is 32 per cent. The growth spikes of 55 per cent in 2017–18 and 69 per cent in 2018–19 have contributed to a 264 per cent rise in mental injury claims liability since 2017–18.
The average growth rate per year of physical injury claims liability since 2017–18 is 25 per cent. The growth spikes of 44 per cent in 2017–18 and 50 per cent in 2018–19 have contributed to a 181 per cent rise in physical injury claims liability since 2017–18.
Outstanding insurance claims increased by $2.3 billion during 2022–23 as shown in Figure 2R.
Figure 2R: Components of movement in outstanding WorkSafe insurance claims liability ($ million)
| Component | 2021–22 | 2022–23 |
|---|---|---|
| Outstanding claims liability – opening balance 1 July | 24,527 | 24,312 |
| Current year claims cost | 4,959 | 5,882 |
| Prior year claims cost | 307 | 847 |
| Net operating balance impact | 5,266 | 6,729 |
| Changes in economic assumptions (discount rate and inflation rate movements) | −2,345 | −399 |
| Remeasurement of previously recognised claims | 192 | −203 |
| Other remeasurements | −601 | −674 |
| Net result impact | 2,512 | 5,453 |
| Claims payments and recoveries/GST | −2,727 | −3,120 |
| Outstanding claims liability – closing balance 30 June | 24,312 | 26,645 |
Source: VAGO, based on data from WorkSafe's financial reports.
A 17 per cent increase in mental injury claims and 14 per cent increase in physical injury claims were the primary contributors to this increase. High claim cost inflation has also contributed to the increase because past claims were remeasured using revised inflation assumptions at 30 June 2023.
Mental injury claims as a proportion of all injury claims are only 14 per cent of WorkCover claims. However, their cost represents $441 million of WorkSafe's annual payout for 2022–23. Physical injury claims as a proportion of all injury claims are 31 per cent of WorkCover claims and their cost represents $958 million of WorkSafe's annual payout of $3.1 billion for 2022–23.
Financial sustainability and scheme modernisation
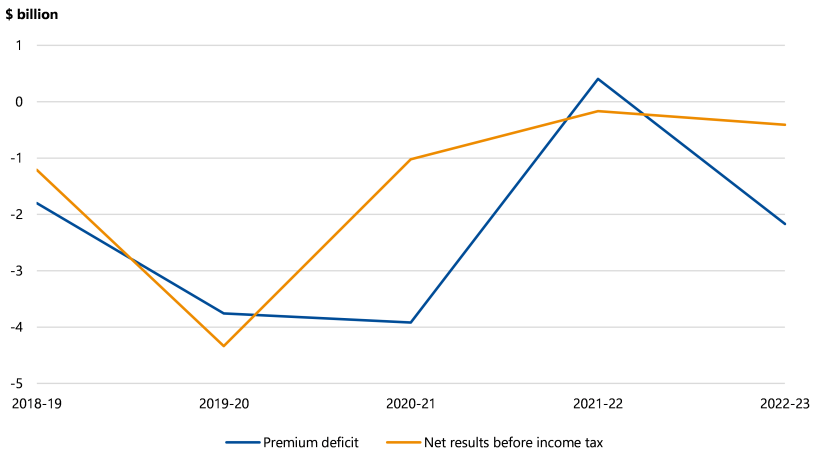
Financial sustainability is the key to achieving WorkSafe’s purpose of reducing workplace harm and improving outcomes for injured workers. Rising claims costs due to a significant increase in claims and workers relying on the benefits for longer have deteriorated the financial sustainability of the scheme in recent years. This has been compounded by the gap between the premium revenue and claims cost, which has grown to a significant deficit by 2022–23.
Insurance funding ratio
Insurance funding ratio is a measure of assets against claims liabilities used as a measure of long-term financial sustainability for a scheme.
The long-term financial sustainability of insurers is measured using the insurance funding ratio, with a preferred range of 100 to 140 per cent for WorkSafe.
WorkSafe’s insurance funding ratio was 105 per cent at 30 June 2023 (compared to 106 per cent at 30 June 2022). To prevent it from falling below the preferred range, the government provided WorkSafe with $300 million in 2022–23 to support its financial position over the short term ($450 million in 2021–22). The government has provided WorkSafe with $1.3 billion over the last 3 years to maintain its insurance funding ratio within the preferred range.
The premium increase and the implementation of proposed scheme modernisation reforms discussed below are expected to maintain WorkSafe’s insurance funding ratio within the preferred range in the foreseeable future. If these reforms are not legislated and implemented as announced by the government, WorkSafe may need to increase the premium rate or require further financial assistance from the government.
Figure 2S shows that the financial performance of WorkSafe has continued to decline over the last 5 years primarily due to adverse claims experience and increasing premium deficit. WorkSafe reported an $11.2 billion premium deficit over the last 5 years. This is with the exception of a $405 million premium surplus in 2021–22 due to the impact of the remeasurement of claims liabilities. One of the key inputs used in remeasuring claims liabilities is the discount rate. The increase in the discount rate due to rising interest rates resulted in a $2.7 billion negative adjustment to claims expense in 2021–22.
Figure 2S: WorkSafe's financial performance
Source: VAGO, using data from WorkSafe financial reports.
In our past reports on the AFR we have highlighted:
- the financial challenges faced by WorkSafe
- the government establishing a WorkCover scheme sustainability interdepartmental committee.
This committee was established to:
- support WorkSafe in implementing strategies to address long-term financial sustainability challenges
- provide consolidated advice to relevant ministers.
In April 2023, the Minister for WorkSafe and the TAC set WorkSafe's objectives to:
- strengthen the financial sustainability of the WorkCover scheme
- reduce workplace harm
- create mentally healthy workplaces
- better support injured workers and their families.
The government acknowledged that the scheme is not fit for purpose and is no longer meeting the needs of those it was designed to assist. To that end, in May 2023 the government announced several reforms to modernise the scheme. These reforms aim to ensure the financial sustainability of the scheme. They involve:
- increasing the average premium rate paid by employers to 1.8 per cent of remuneration (this was effective from 1 July 2023)
- establishing Return to Work Victoria to provide more workers with the support they need to return to employment
- adjusting eligibility for mental injury claims and introducing a whole person impairment threshold for claims that receive weekly benefits for more than 2.5 years, alongside the capacity test.
The government has also committed to not repatriate additional capital to the state Budget when WorkSafe returns to financial sustainability. Instead, it will invest surplus back into the scheme to ensure better outcomes for workers or achieve lower premiums. This is consistent with 2023–24 state Budget.
The government introduced the Workplace Injury Rehabilitation and Compensation Amendment (WorkCover Scheme Modernisation) Bill 2023 to Parliament on 31 October 2023. At the date of writing this report, this legislation is yet to be passed by Parliament. If legislation passes, the government has committed to a legislated review no earlier than 3 years after the changes come into effect.
Striking a balance between financial sustainability and improving outcomes for injured workers is fundamental to the success of the scheme. The government needs to implement the proposed changes, if legislated, in a manner that achieves that balance.
3. Accounts and records
Conclusion
DTF implemented effective internal controls to support the preparation of a complete and accurate AFR.
VicTrack has made significant progress in improving its internal control framework that relates to asset accounting.
The internal control frameworks of the other material entities were adequate to support preparation of complete and accurate financial reports. However, some entities need to strengthen some internal controls to ensure their financial reports remain reliable.
In this part
3.1 Entity-specific internal controls
We assessed the internal controls at each material entity that ensure its financial report is complete and accurate and complies with relevant legislation. We have reported any significant issues to the relevant entity's management and its audit committee, as required under the Australian Auditing Standards.
VicTrack – accounting for fixed assets and inadequate asset records
The state's investment in building, developing and replacing assets in the transport and planning sector continued. In 2022–23 $11.3 billion was invested ($10.0 billion in 2021–22). With respect to operational transport projects, DTP enters into the contracts, oversees the capital spending and then transfers the completed assets to VicTrack as the state’s legal custodian of them.
Accounts and asset records
In past reports, we have explained the significant shortcomings in asset accounting by DTP and VicTrack since 2019–20. The issues have included:
- an inability to identify individual assets in VicTrack's asset register
- delays in the recognition of assets, which means depreciation was not charged from when assets were first available for use
- no assessment of the nature of capital spending against asset recognition criteria under AASB 116 Property, Plant and Equipment
- inadequate review of work-in-progress accounting records, resulting in stale work-in-progress amounts and asset write-offs
- asset disposals and replacements not identified and removed from the VicTrack asset register.
DTP and VicTrack have contributed significant time and effort to resolve these issues. They have now implemented an asset collection and attribution framework that was in place for the full 2022–23 financial year. As part of our 2022–23 audit work, we confirmed the effective operation of this framework for most assets added since 2019. Some improvements remain to clarify and capture asset attributes for tracks and signals.
While the work undertaken by VicTrack and DTP over the last 3 financial years and the new framework mean new assets are completely and accurately recorded, our testing found issues remain with information on the register predating 2019.
We would normally qualify a financial report for this matter. However, an additional qualification on this issue was not required because we already modified VicTrack’s financial report for not complying with the leasing matter explained in Section 1.2.
This did not impact our opinion on the AFR because we concluded that the risk of a material misstatement in the AFR was low.
Asset write-offs and write-downs
As part of the valuation process, over $2.7 billion of asset value was written off during the 2019–21 periods. The valuation process identified 2 issues:
- some maintenance-type works were incorrectly capitalised
- the valuer took a different approach to calculating the current replacement cost for an asset in a live operating environment that was different to the approach allowable under the Australian Accounting Standards.
A significant part of the write-offs related to level-crossing removal projects, where construction occurs in an operating transport network.
While we did not identify any material asset write-offs or write-downs during 2022–23, the different approaches to measuring current replacement cost for operational transport assets is still unresolved. The Australian Accounting Standards Board has issued authoritative guidance for fair valuation of assets for not-for-profit entities, which will apply to the 2024–25 reporting period. DTP has commenced consideration and discussion on the issue with the Valuer-General Victoria but further effort to resolve the different approaches will be required so that any changes can be implemented by the 2024–25 timeframe.
DFFH – accounting for social housing arrangements involving non government parties
The state continues to invest in increasing the supply of social and affordable housing. Department of Families, Fairness and Housing (DFFH) and Homes Victoria are responsible for this investment and have entered into arrangements with varying non-government parties, including registered housing authorities and a private consortium.
In 2021–22, we found that DFFH and Homes Victoria had not sufficiently documented their assessment of the accounting implications of these arrangements. We therefore recommended they develop a framework for reviewing significant arrangements against the requirements of the Australian Accounting Standards, specifically AASB 1059 Service Concession Arrangements: Grantors.
In 2022–23, DFFH and Homes Victoria made considerable progress. They developed a framework to assess historical and new arrangements against the requirements of AASB 1059.
Even though progress occurred, we observed that:
- undefined terms in the agreements and contract made it difficult to assess the implications of the agreements against the requirements of accounting standards
- they did not provide evidence of their review of individual contracts against the framework.
This matter did not lead to a material error in the financial report, and we issued an unqualified audit opinion.
However, as further arrangements are entered into and the financial impact of the arrangements increases, more work will be required. DFFH and Homes Victoria will need to ensure that the nature, complexity and diversity of various arrangements do not result in material departures from the requirements of applicable accounting standards.
DJCS – reporting of administered fines and fees receivables – provision for expected credit losses
Department of Justice and Community Safety (DJCS), through Fines Victoria, manages and accounts for administered fines and fees.
The Australian Accounting Standards require agencies to assess the collectability of receivables annually and recognise a loss allowance for amounts not expected to be received.
In the last 3 years we found an error in the calculation of, and accounting treatment for, the loss allowance for unpaid fines and fees. The errors resulted from:
- incorrect cash collection rates being applied when estimating the loss allowance
- incorrect adjustments being made to the loss allowance for bad debts written off in the past
- future economic assumptions, such as unemployment rates and the effect of the COVID-19 pandemic on the collectability of fees and fines at 30 June, not accurately incorporated in the loss estimate modelling.
This resulted in management being required to make a material adjustment to the administered fines and fees receivables balance. Figure 3A shows the impact of the adjustment on the reported receivables balance at 30 June each year.
Figure 3A: Administered fines and fees receivables as at 30 June
| 2020 ($ million) | 2021 ($ million) | 2022 ($ million) | |
|---|---|---|---|
| Gross fines and fees receivables | 2,591.8 | 2,607.8 | 2,612.2 |
| Provision for expected credit losses made by management | (1,107.1) | (2,505.6) | (2,275.6) |
| Audit adjustments – provision for expected credit losses | (1,396.9) | 166.1 | (60.5) |
| Net fines and fees receivables | 87.8 | 268.3 | 276.1 |
Note: The adjustment made to the provision for expected credit losses at 30 June 2020 included a $1,085 million correction resulting from incremental understatements since 2006. We reported this in Auditor-General's Report on the Annual Financial Report of the State of Victoria: 2019–20 to Parliament.
Source: VAGO.
In 2022–23 management refined the method and model used to calculate the loss allowance for unpaid fines and fees to address the identified issues. Management did not have to make any adjustments to the reported administered fines and fees receivables balance this year. Management has identified further opportunities to improve the model, which it has committed to implement in 2023–24.
DJSIR – deficient controls for COVID-19 grant programs
In our last 2 reports on the AFR, we commented on deficient controls for COVID-19 grant programs. This meant we could not rely on them for our Department of Jobs, Skills, Industry and Regions (DJSIR) audit and had to perform alternate audit procedures to gain comfort over the validity and accuracy of grant money disbursed. These deficiencies, along with other issues we identified relating to COVID-19 grant administration, are detailed in part 4 of this report.
COVID-19 grant programs finished in 2021–22, and in 2022–23 no significant new emergency response and recovery grant programs were established.
WorkSafe – management assessment of recoverability of deferred tax asset
WorkSafe is required to pay income tax under the National Tax Equivalent Regime. Under this regime, WorkSafe is able to use past tax losses to offset any future tax payable to the state.
The Australian Accounting Standards allow the recognition of tax losses as deferred tax assets to the extent of the availability of estimated future taxable profit.
WorkSafe recorded a deferred tax asset of $2.7 billion as at 30 June 2023 in its balance sheet, including $2.0 billion arising from unutilised tax losses. We note that the recoverability of the $2.0 billion arising from tax losses is contingent on legislation of proposed scheme reforms. In considering recognition, management made a judgement that the proposed reforms will be passed by Parliament as announced by the government in May 2023 and that they will be sufficient to enable WorkSafe to generate taxable profits in the future despite the history of tax losses.
WorkSafe is required to make at least $6.7 billion taxable profit in future years to fully recover the $2.0 billion deferred tax asset at the current income tax rate. Management developed a financial forecast to support the recovery of deferred tax asset by incorporating the estimated financial outcomes of the proposed reforms. Forecast future taxable profit is heavily dependent on:
- the increase in average premium rates to 1.8 per cent that came into effect from 1 July 2023
- legislation of eligibility changes, which requires parliamentary approval.
The government introduced the WorkCover Scheme Modernisation Bill to Parliament for implementing the proposed changes on 31 October 2023.
There is a risk that this legislation may not be passed by Parliament as announced, which could impact management's forecast and recoverability of deferred tax asset.
We recommended that management consider their assessment annually by taking into account the proposed reforms if and when they are legislated.
3.2 Information systems
IT controls
Effective information technology (IT) controls reduce the risk of unauthorised access and changes to systems and help protect the underlying integrity of data. They are a prerequisite for the smooth day-to-day operation of entities and the reliability of the systems used by the entities for financial reporting.
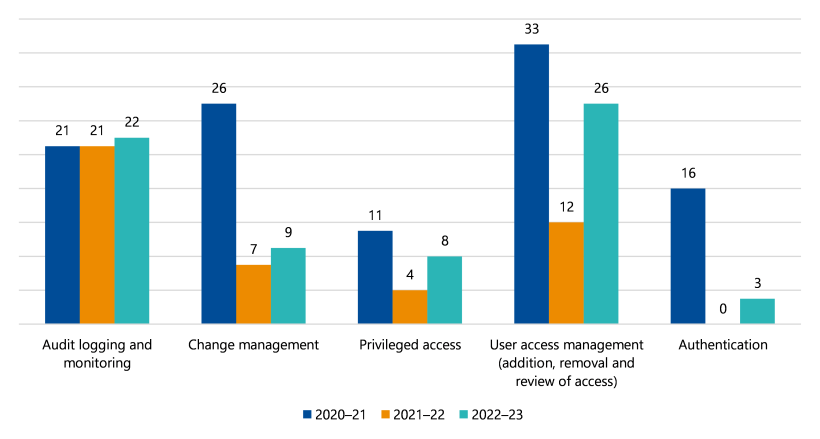
We continue to find IT control deficiencies at some material entities. Figure 3B summarises the number of deficiencies we identified at material entities over the last 3 financial years. Several prior-year IT control deficiencies also remain unresolved. Material entities must prioritise and address these issues promptly, particularly with the shift to a hybrid operating model.
Figure 3B: Number of IT control deficiencies from 2020–21 to 2022–23
Source: VAGO.
We continue to find the following IT control deficiencies at material entities:
- Audit logging and monitoring – system-generated audit logs were not always enabled to track privileged user account activities, including changes employees made to system user access, configurations and reports.
- Privileged access – employees have been assigned privileged access greater than their position required.
- Change management – staff responsibilities for the development and implementation of changes to information systems were not separated and/or a process has not been established to manage changes and ensure implementation of comprehensively tested and approved changes to production.
- User access management – new system user access has been granted without approval, system user access of employees who had left the entity was not revoked promptly and/or periodic user access reviews were not performed to ensure access levels align with employees' roles and responsibilities.
We have seen a decline in the number of material entities with high or moderate rated password and authentication control issues. This is primarily due to implementation of network single sign-on or multi-factor authentication as part of moving information systems to the cloud environment.
4. COVID-19 business grant support programs
Conclusion
In 2020 the former Department of Jobs, Precincts and Regions (the department) had to respond rapidly to implement a large scale grants program to support businesses during the COVID 19 pandemic. This grants program was unprecedented in its experience.
It was reasonable for the department, given the unprecedented scale and urgency of the various business grant programs to establish a 'high trust' front end to their approach to verifying eligibility for each grant round. This included relying on attestations by the businesses that applied for grants that they satisfied all the criteria.
However, in such situations it is also necessary to establish post payment checks to minimise the likelihood of large-scale fraud and error. Risk is an important consideration in designing such control measures and when they operate.
In this respect the department failed to properly administer these programs. Checks on eligibility were not aligned to program intent and decision-making was poorly reasoned. Consequently, it is likely that fraud occurred and, to date, remains undetected. It is also the case that payments were made in error; and that businesses with the same underlying circumstances were treated differently and inequitably.
The department also failed to provide full and frank advice to government throughout the program.
In this part
4.1 Background
Financial audit opinion on department's 2021–22 statements
This part details findings arising from our financial audit of the former Department of Jobs, Precincts and Regions (now DJSIR, or the department) for the 2021–22 financial year.
While our audit opinion on the Department of Jobs, Precincts and Regions’ financial statements was unmodified, we did not issue it until 21 February 2023. This was because we found prima facie evidence that there was a risk of significant fraud, primarily in relation to grants paid by the department to businesses under the Business Costs Assistance Program (BCAP).
We were obliged by our auditing standards to undertake further work to satisfy ourselves that any fraud, had it occurred, was not material to the department's financial report. We ultimately formed this view, which allowed us to issue a clear audit opinion.
However, our investigation of the grant programs identified serious deficiencies in their administration and in the controls over fraud and error. It remains likely that undetected fraud occurred and errors were made in payments to some applicants.
Responsibility for preventing fraud and error
Fraud
The Standing Directions use the definition of fraud from the Australian Standard 8001:2021 Fraud and corruption control: ‘dishonest activity causing actual or potential gain or loss to any person or organization including theft of moneys or other property by persons internal and/or external to the organization and/or where deception is used at the time, immediately before or immediately following the activity’
The departmental Secretary, as the accountable officer, and the departmental staff involved in the administration of the grants programs, are legally responsible under Standing Directions 2018 under the Financial Management Act 1994 for designing, implementing and monitoring controls that either prevent, or detect and remediate material fraud and error.
Victorian Government grants to support businesses during COVID-19 lockdowns
The COVID-19 lockdowns in Melbourne and Victoria in 2020 and 2021 affected the ability of many Victorians to work. Lockdown restrictions also meant that many businesses had to temporarily close or reduce their activities, leading to lost turnover, stock losses and booking cancellations.
In March 2020, the government announced the first COVID-19 business support grant program.
Throughout 2020–21 and 2021–22, the department paid $11.0 billion in COVID 19 grants to businesses affected by the COVID-19 lockdowns. Figure 4A shows how much it paid out in total under each COVID-19 grant program.
Cost and years of various programs
Figure 4A: Cost of each COVID-19 grant program between July 2020 and June 2022
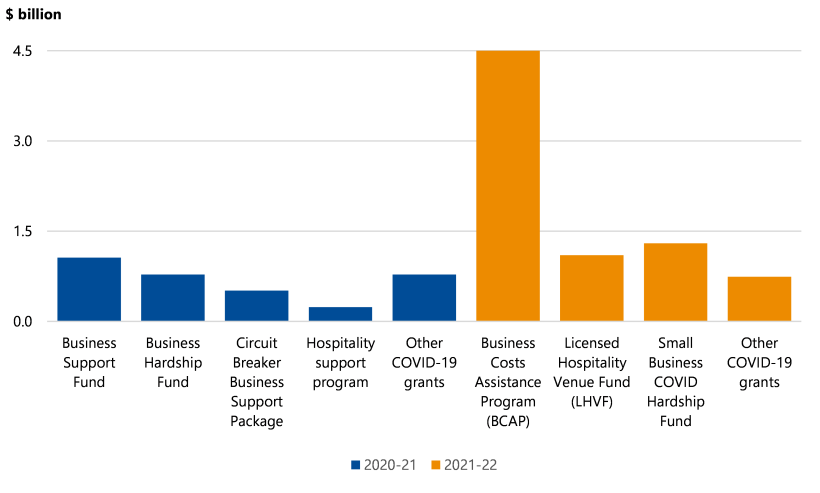
Note: Circuit Breaker Business Support Package includes grants paid under the first Business Program in 2020.
Source: VAGO.
The Business Cost Assistance Program and the Licensed Hospitality Venue Fund
Two COVID-19 business support grant programs that were financially significant and where we judged the risk of material fraud or error was most likely were the:
- $4.5 billion paid under Business Costs Assistance Program (BCAP)
- $1.1 billion paid under the Licensed Hospitality Venue Fund (LHVF).
The BCAP and LHVF grants were set up and implemented quickly. For example:
- the second round of the Business Program (BCAP2) opened for applications on 3 June 2021, within 3 business days of the lockdown announcement
- the Business Program extension (BCAP2e) opened for applications within 5 business days of the round approval – on 15 July 2021.
The department set up procedures and controls for these programs quickly, under pressure to provide immediate financial assistance. The department anticipated that the rapid rollout would entail weaker controls initially, which could be reviewed and amended as the programs rolled out. The department advised these programs were delivered while it was providing business support across multiple grant programs, and it received more than 700,000 applications to process.
Eligibility criteria
To qualify for the grants, applicants had to meet specific eligibility criteria, which the department outlined in grant guidelines published for each round. The list of criteria varied across the rounds and top-ups. Some examples of eligibility criteria include:
- whether the lockdown affected the business
- whether the business employed people
- the location of the business (CBD, metropolitan or regions specified)
- the sector the business operated in
- the tax registration status of the business.
In every round, the department made changes to scheme eligibility. The range of criteria and the changes to them made it difficult for applicants to know which schemes they were eligible for. For example, all accommodation and food services were eligible for the first BCAP but only takeaway food services (with Australian and New Zealand Standard Industrial Classification code 4512) were eligible for the second Business Program.
The changes made to eligibility criteria added complexity, making it more difficult for the department's grant team to assess applicant eligibility in subsequent rounds.
However, a common requirement across most of the grant programs, and the key eligibility criteria of most audit interest in relation to the risk of fraud and error, were that each Victorian business had to attest that it:
- had incurred costs as a direct result of lockdown 'circuit breakers' – such as booking cancellations, utilities, salaries, paid leave for staff unable to attend work, rent, or the loss of perishable goods
- been registered for GST on a specified date and held an ABN at that date.
Further, the grant conditions required that funds must be used to assist the business. For example:
- meeting business costs, including utilities, wages or rent
- seeking financial, legal or other advice to support business continuity planning
- developing the business through marketing and communications activities.
GST registration criterion
The criterion to be registered for GST on a specified date was used by the department for the second round of the BCAP and for the LHVF21, as a reasonable proxy for substantial business turnover – the Australian Taxation Office (ATO) requires businesses with turnover above $75,000 a year to be registered.
This was to ensure support was targeted at businesses that were genuine and substantial. The department anticipated that registration status would be readily and reliably verifiable to third-party information on the online Australian Business Register, maintained by the ATO.
The department viewed this as a critical integrity measure because it was intended to demonstrate that a business was actively trading prior to program launch, thereby supposedly limiting the risk of a business applying for GST solely to be eligible for a grant.
This criterion replaced the requirement from the earlier Business Support Fund program where businesses had to supply a copy of a Business Activity Statement (BAS), because that approach had proved burdensome for both businesses and the department and led to delays in processing grant applications.
BCAP2 required that businesses attest, at the date of their application, that they were registered for GST on 27 May 2021. The July extensions (BCAP2e and the LHVF21e) required businesses to be registered for GST on 15 July 2021. For both rounds they needed to continue to satisfy these conditions at the date their application was assessed by the department.
Of the 114,000 applications to BCAP2, approximately 6,338 were considered ineligible by the department because they were found not to registered for GST at the date their application was assessed by the department.
The July program extensions allowed businesses with changed registration status since 27 May 2021 but before 15 July, to be considered for a grant (those businesses already approved under BCAP2 automatically became entitled to the extension grant).
More than 46,900 applications for the extension program had been lodged by 27 August 2021, compared to the 3,000 initially projected by the department. This unexpected increase in demand was attributed by the department to many businesses having registered for GST after 27 May.
Backdating of GST registration
The ATO allows businesses to voluntarily backdate their GST registration. These businesses must meet all GST obligations for the backdated period.
On 11 June 2021, the ATO contacted the department's grants team to alert it to an increase in backdating GST compared to the previous year. Shortly after it quantified this increase as around 15 per cent.
On 17 June the ATO confirmed it was able to share more granular data with the department.
The department started receiving datasets from the ATO from 22 June 2021 that showed backdated ABN registrations and included backdated GST registrations when the 2 registrations were processed together. From 2 July 2021, the department received weekly data of all Victorian businesses in the Australian Business Register including the ABN and GST status of businesses.
BCAP2 applications closed on 24 June 2021.
Scale and timing of increased GST registration
We obtained and analysed the ATO data to understand the extent and timing of the increase in GST registration.
Figure 4B shows the number of Victorian GST registrations from 2018 to 2022. The registration pattern is consistent until May 2021, with significant increases in June, July and August 2021.
Figure 4B: Number of GST registrations in Victoria, 2018–2022
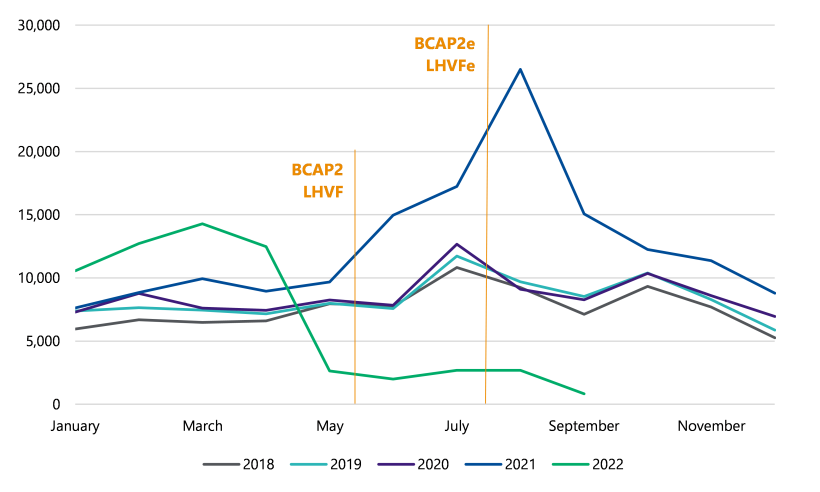
Note: BCAP2 stands for the second round of the Business Costs Assistance Program and BCAP2e and LHVFe are the extension schemes of the BCAP2 and the Licensed Hospitality Venue Fund schemes.
Source: VAGO.
The abnormal increase in the GST registration data in 2021 coincided with the application deadlines for the BCAP2 and LHVF programs.
Our key findings
Against the above background our findings fall into 4 key areas:
|
1 |
Inconsistent and inequitable outcomes The department's approach to verifying eligibility for the BCAP and LHVF21 programs was inconsistent with the grant conditions authorised by government and with the program intent. This created inequitable outcomes and also led to substantial payments to businesses that did not satisfy the GST targeting criteria. |
|
2 |
Design flaws in controls to detect and investigate potential fraud and error The design flaw in the way that the department checked GST eligibility became apparent early in the rollout of the program. Notwithstanding, conscious decisions were made to allow payments to businesses that were not registered for GST on the dates specified, but which had registered before their applications were assessed. This was subsequently rationalised within the department as neither an error or fraud. Consequently, no action was taken to investigate or otherwise verify the bona fides of these businesses. Nor has the department undertaken any activity to verify that businesses that received grants had incurred direct costs as a result of lockdowns, or the purposes to which the funds provided were actually put. |
|
3 |
Full and frank advice The department's advice to its minister and to the Treasurer and Premier in relation to the GST backdating issue, was not full and frank. When it recommended to its minister on 27 August 2021 that backdating of GST registration after the date of its assessment not be allowed, it did not make it clear the department's assessment process would not identify backdating and would allow registration for BCAP2e before the date it assessed a grant application. It also did not make this clear to its minister, or to the Treasurer and Premier, in its advice on 9 November 2021. That advice sought approval to vary the grant eligibility criteria set by the Expenditure Review Committee to allow inclusion of the 4,500 applicants that had not registered for GST until after 15 July 2021. This approval was not given. |
|
4 |
Post-payment investigation and follow-up The grant conditions provided for the department to audit the use of grants for up to 4 years after they were paid. An audit only commenced in October 2023. There also has been no program evaluation of BCAP2 or the LHVF, nor are we aware of any planned. |
4.2 Inequitable outcomes from interpretation of GST criteria
Overview
The department's approach to verifying eligibility in relation to GST registration led to the following outcomes:
- businesses that were not actually registered on the dates specified in the guidelines, either:
- chose not to apply for any grants, deeming themselves ineligible
- registered for GST between the dates specified in the guidelines (either before or after they submitted their applications) and the date their application was assessed
- registered for GST after the date they were assessed.
Those that registered after the specified dates but before their application was assessed were deemed eligible by the department and received grant payments and top-ups, provided they remained registered, and continued to satisfy the other grant conditions.
Those who applied but were not registered before their grant application was assessed were told they were not eligible. A subset of these businesses then registered for GST, in some instances retrospectively, but were again rejected for the funding round they had originally applied for.
Those unregistered businesses who chose not to apply for BCAP2 or LHVR21, based on their own understanding of the grant conditions were clearly disadvantaged compared to those businesses in the same circumstances, that registered for GST after the specified dates and were awarded grants.
Further, because businesses can voluntarily register for GST even where they did not have a turnover of more than $75,000 this admitted the possibility that such businesses obtained significant grants. This defeated the program intent of ensuring businesses receive payments proportional to their size. Also, for example, sole traders earning less than the GST threshold of $75,000 per year may otherwise have been eligible to receive the Australian Government’s COVID-19 Disaster Payment, which provided $750 per week (equivalent to an after-tax income of $39,000).
Applications rejected by department for BCAP2
Of the 114,000 applications for BCAP2, the department rejected approximately 6,400 because they were not registered for GST when their applications were assessed.
By late August 2021 the department had been able to determine from ATO data that approximately 800 of these applicants had subsequently backdated their registration. Approximately 700 had requested a review and reassessment of their unsuccessful application.
Because the GST registration was a critical integrity measure, the department treated all these applicants as, what they termed, a 'hard fail'.
The application of this hard fail test to these applicants was appropriate, given the stated criterion and also given that these applicants had attested when they applied that they were registered, when patently they were not.
The same hard fail was not applied to those businesses who also were not registered at the specified date, but who then registered before they were assessed.
In terms of expediency this was initially reasonable given the prima facie evidence the department had to hand at the time of assessment and the scale of payments it needed to process quickly.
However, the department became aware early in the program of the significant and abnormal increase in GST registrations and also that backdating was allowed by the ATO and was occurring. It therefore knew that its approach to checking eligibility advantaged some businesses not registered before the dates specified in the guidelines and disadvantaged other unregistered businesses.
It is apparent that administrative ease drove this approach. It was administratively simple, where an applicant was not registered at the time of assessment, to prove this. It would have been more time-consuming to check after the event for backdating and then to seek to recover grant funds.
Proposed changes to eligibility criteria after program extension scheme introduced
The BCAP2e and LHVF21e July 2021 extensions allowed businesses that had not previously applied for the program, or had failed the first-round test, to apply for the equivalent of 'top-up' payments, provided they were registered for GST by 15 July 2021.
This was to ensure equitable treatment for those who had become eligible for support.
In November 2021 the department briefed its minister on a proposal to extend this approach to making future top-up payments from the date of their registration, to the approximately 4,500 businesses that registered for GST after 15 July 2021.
Because this was a proposed change to the eligibility criteria set by the Expenditure Review Committee the department sought approval for this from the Premier and Treasurer, which was not forthcoming.
This decision confirmed the approach that the department had previously adopted to this cohort for round 1 and 2 of the programs.
4.3 Weaknesses in design and operation of controls
Overview
The department's process for checking GST registration at the date it assessed a grant application could not:
- determine whether GST registration happened after the specified dates but before the date the application was assessed
- detect backdating of the registration to a date before the specified date
- identify businesses with turnover less than $75,000 that had voluntarily registered for GST.
This major design flaw became clear to the department early in the program, after advice from the ATO. It was unintended and arose from a lack of understanding of the ATO rules for GST registration when the criterion was set.
Population at risk of fraud and error
Our analysis of ATO data found that the department paid $426.0 million to applicants that were not registered for GST before or on the eligibility date.
|
The department paid grants totalling … |
To businesses that… |
|---|---|
|
$355.7 million |
|
|
$55.8 million |
|
In relation to the $355.7 million, the department, after it became aware of the issue, subsequently took the position that these were neither errors nor fraud. Part of its rationale was that the guidelines were imprecise, because it had not specifically contemplated backdating at the time they were drawn up. The department contended that this meant that some businesses may have misinterpreted the requirements and/or satisfied themselves that subsequent registration and backdating was permissible.
The $55.8 million of payments made to businesses are errors, based on the stated grant conditions. These businesses were demonstrably not registered before the specified dates nor with retrospective effect from the specified dates and should not have been paid.
Indicators of fraud and error
The department's views notwithstanding, all these grant payments had a higher risk of fraud. Specifically, the risk is that businesses had registered solely to obtain grants and were not actively trading or a substantial business enterprise during the lockdown events, so suffered no loss and incurred no direct costs.
The department noted in a brief to its minister on 9 November 2021 that the significant increase in non-employing businesses applying for BCAP2e with recent registrations, may indicate 'some businesses may be manipulating their registrations to become eligible'.
An applicant who registered for GST solely to obtain the grant would be:
- unlikely to remain registered for GST because registration requires completion of BAS returns
- likely to report no business activity in their BAS return to the ATO for 2021–22.
We conducted further analysis to quantify the potential risk of fraud in grants paid to those applicants.
|
Grants totalling … |
Were paid to applicants that … |
|---|---|
|
$30.4 million |
cancelled their GST registration before 30 June 2022. |
|
$162.4 million |
reported no business activity for the 2021–22 financial year. |
Department's posture regarding fraud
The department took a different approach to businesses backdating their ABN registrations when compared to GST registrations.
Businesses also had to have an ABN and held this registration before the date the program was announced. The department treated payments to businesses that backdated their ABNs as more likely to be as fraudulent. Where they found businesses that had backdated both their ABN and GST registrations they cancelled their applications.
A November 2021 analysis of taxation data undertaken by the department's Integrity Services Unit (ISU) identified that $18.3 million had been paid to businesses that had backdated their ABN.
The November 2021 ISU analysis also determined that approximately $316 million had been paid to around 7,000 BCAP2e applicants that had backdated their GST registration, which the ISU regarded as a fraud risk.
The ISU analysis was dismissed by the program area because ‘it did not reflect the best interpretation of the program Guidelines’ according to an undated and unsigned file note about backdating in the extension program, provided to audit as part of our investigation.
According to this file note the methodology used by the ISU ‘should have assessed whether or not applicants held GST registration on and as at the date of their application, rather than on and as at 15 July. The date of application would be a date between 30 July and 20 August’.
The department rationalised this as an intentional decision out of administrative necessity, mainly for efficiency.
This was understandable in the context of the need to make rapid payments but it does not alter the fact that:
- the department's approach was inconsistent with the published guidelines
- its authority to deviate from the stated criterion is unclear
- it did not clarify its position publicly or seek to amend the eligibility criteria to better align with its approach.
The department undertook no subsequent post-payment investigation of these businesses after forming the view that:
- businesses that backdated their GST registration only were less likely to be fraudulent; and
- retrospective registration was acceptable, provided it was done before an application was assessed.
4.4 Frank and full advice
Requirements
Secretaries and department officers are required by the Code of Conduct for Victorian Public Sector Employees to:
- provide frank, impartial and timely advice, with an understanding of its implications on the government’s broader policy direction
- not withhold relevant information from the government of the day
- conduct themselves in an apolitical manner
- implement and administer the government’s policies and programs openly and transparently
- maintain accurate and reliable records.
Advice about backdating GST
The department first raised the issue of backdating GST in a brief to its minister on 27 August 2021 about the BCAP2 program.
This brief dealt only with backdating by businesses that had failed the assessment process because they were not registered on 27 May 2021 nor when their application was assessed.
The brief noted that at least 800 unsuccessful applicants for BCAP2 had subsequently backdated their GST registration and approximately 700 had requested a review. In this context it was asserted in the brief that 'This is the first time that GST backdating has been a significant trend in a COVID-19 business support program'.
In all subsequent briefings to the minister and in later correspondence with the Treasurer and Premier all references to backdating GST related solely to unsuccessful applicants.
Completeness and clarity
The statements about backdating made the department were, at best, incomplete because they omitted to clarify that backdating was also a feature for a cohort of successful applicants.
When challenged by VAGO the department asserted to us that it was incorrect to use the term 'backdating' for successful applicants that had retrospectively registered for GST after the dates specified in the program guidelines but before they were assessed.
This semantic distinction is highly questionable and is lost on a plain reading of the term. Regardless of this, the more serious omission was that the department knew when it briefed the minister:
- about GST backdating, and
- that it had taken an administrative decision to permit it in some circumstances and not in others.
Had this been made patent during the program it would have placed a different complexion on the issue, and on subsequent considerations to vary the criterion in the guidelines.
Subsequent advice
In response to our ongoing audit investigation and the issues we raised, the department prepared a brief for its new minister in September 2022, where it gave a full accounting of the GST backdating issue.
In that brief it explained the administrative necessity that drove its implementation approach. It also asserted that the then minister had the authority to issue guidelines and make decisions about program administration, including the implementation approach.
However, the documentary evidence available to us (as set out above) does not show that the then minister was fully briefed on the issue or supported or otherwise authorised the approach taken by the department toward businesses registering after the grant dates but before assessment.
4.5 Post-payment investigation and follow-up
High trust front ends require prompt post-payment checking and follow-through
In emergencies, or in any circumstances that demand a rapid response, it is right to build 'high trust' front ends into administrative processes. Recognising that this approach creates heightened risks of fraud and error, it is incumbent on agencies to also establish post-payment controls, informed by risk assessments.
To this extent we support the department's methods to check eligibility in the first instance and undertake integrity reviews during the delivery of the programs. Its integrity reviews were designed to identify fraud risks, isolate fraudulent activity and cancel suspected fraudulent applications before payment.
The department made the last grant payments in October 2021.
Recovery of funds paid due to fraud or error
In March 2022, the department reported to the Minister for Industry Support and Recovery that in October 2021 it used ATO data to identify and cancel 2,399 applications with backdated ABN registrations. The department further advised the minister it had already paid $18.3 million to 854 of these applicants in error, this amount being a loss of public funds.
The department advised the minister that it would email the applicants to request repayment, with at least one follow-up. This did not occur.
The department reported the applicants with backdated ABN registrations as debtors (owing money to the department) at 30 June 2022 but immediately provided for the full amount as doubtful debts.
The department had not taken any action to recover the $18.3 million of public money paid in error at the time the amount was written off as doubtful.
Providing for doubtful debts means that the department considers money owing is unlikely to be paid. Doubtful debts become bad debts when it is clear the money will not be paid.
The amounts remained as doubtful debts at 30 June 2023 with no action taken in 2022–23. In July 2023 the minister approved an audit of these payments to establish whether the amounts should be recovered or written off.
Audit program
The department implemented some post payment validity checks by data matching against externally available data, and quality assurance reviews of its processes. But its questionable rationalisation as to what constituted fraud meant it did not use the data it had available to identify and target high-risk businesses.
It also has not, to date, undertaken any post-payment checking against other grant eligibility criteria, or of the actual use of funds paid out in these programs.
We understand the department has commenced an audit to examine whether COVID 19 grant recipients that backdated their ABN and or GST registration were eligible. The audit will also gather evidence on how grant funds were used. The passage of time may make it harder to obtain evidence and/or recover funds. The better time to do this was during the program, or shortly after it concluded.
This would have required resources be made available and incurred costs but the integrity of the program and the large scale of funds spent warranted such investment.
Evaluation of program outcomes
At the Commonwealth level, an Independent Evaluation has been performed on the $88 billion JobKeeper program, which was a key policy response to COVID-19. The independent evaluation considered the effectiveness of the JobKeeper program in achieving its objectives, concluded on whether value for money was achieved and recorded lessons learnt to inform future policy responses. The report is publicly available and serves as a key accountability tool.
There has been no evaluation (independent or otherwise) performed on the financially significant BCAP and LHVF programs in Victoria, and we are not aware that any are planned. The absence of an evaluation means no assessment has been made on whether the financial support provided to businesses was effective and whether the $11 billion spent represented value for money, nor has there been an opportunity to learn lessons for future programs.
Appendix A: Submissions and comments
Download a PDF copy of Appendix A: Submissions and comments.

Appendix B: About this report, the AFR and our financial audits
Download a PDF copy of Appendix B: About this report, the AFR and our financial audits.
Download Appendix B: About this report, the AFR and our financial audits
Appendix C: Audit opinion on the AFR
Download a PDF copy of Appendix C: Audit opinion on the AFR.
Appendix D: Results of material entity audits
Download a PDF copy of Appendix D: Results of material entity audits.
Appendix E: VicTrack lease arrangements
Download a PDF copy of Appendix E: VicTrack lease arrangements.
Appendix F: Financial measures and targets
Download a PDF copy of Appendix F: Financial measures and targets.
Appendix G: Acronyms, abbreviations and glossary
Download a PDF copy of Appendix G: Acronyms, abbreviations and glossary.