Literacy and Numeracy Achievement Outcomes for Victorian Students
Audit snapshot
What we examined
We examined whether the Department of Education (the department) is improving literacy and numeracy achievement outcomes for all Victorian government school students.
Agencies examined: Department of Education.
Why this is important
People need literacy and numeracy skills to participate in the community, thrive in the workplace and learn throughout their lives.
Some Victorian students begin school with fewer foundational skills and resources than their peers. It is important that schools ensure these students reach expected literacy and numeracy levels over the course of their education journeys.
This will equip these students to flourish as adults and help to tackle intergenerational disadvantage at its roots.
What we concluded
Since 2012, literacy and numeracy outcomes for Victorian government school students overall are stable.
The department is not improving outcomes for Aboriginal students and students experiencing disadvantage. Since 2012, the proportion of these students below the expected level has been stable or increased.
These students are not learning at a rate that will close the gap with other students.
The department's budget performance measures of student outcomes are not a fair or transparent presentation of students' skills.
What we recommended
We made 3 recommendations to the department to:
- widen its literacy reporting to include writing as well as reading
- improve the way it reports student outcomes in its performance measures
- make government school literacy and numeracy results more accessible to the public.
Video presentation
Key facts
Source: VAGO, using department data and expenditure data from the Australian Curriculum Assessment and Reporting Authority.
Our recommendations
We made 3 recommendations to address 3 issues. The Department of Education has wholly accepted 2 and accepted one in principle.
| Key issues and corresponding recommendations | Agency response(s) | |||
|---|---|---|---|---|
| Issue: The department's reporting of literacy is too narrow | ||||
| Department of Education | 1 | Redefine literacy for reporting purposes so that student achievement in reading and writing is presented (see Section 2). | Accepted | |
| Issue: The department's budget performance measures are not a fair presentation of student outcomes | ||||
| Department of Education | 2 | Review its performance measures for Budget Paper No. 3: Service Delivery so that they align fully with its strategic objectives and the Department of Treasury and Finance's Resource Management Framework (see Section 2). | Accepted | |
| Issue: Public reporting of all student outcomes is not transparent and easily accessible | ||||
| Department of Education | 3 | Make the NAPLAN outcomes for Victorian government school students and student subgroups available to the public in easy to understand and accessible formats. Such reporting should:
| Accepted in principle | |
What we found
This section summarises our key findings. Sections 1 and 2 detail our complete findings, including supporting evidence.
When reaching our conclusions, we consulted with the audited agency and considered its views. The agency's full response is in Appendix A.
Why we did this audit
People need literacy and numeracy skills to thrive in the wider community and workplace, and to learn throughout their lives. Students develop these skills throughout school, from their foundation year to their final year.
The importance of improvement in literacy and numeracy
All students need to meet minimum standards in literacy and numeracy to realise their learning potential.
Different factors affect a student's likelihood of achieving their learning potential. Families’ experiences of education, work and income influence students’ learning skills and resources.
Many Victorian students begin school with the foundational skills expected for their age and have learning support available outside school.
Some Victorian students begin school with fewer foundational skills and resources than their peers. Aboriginal students, students experiencing the most disadvantage and students with English as an additional language (EAL students) are more likely to start school with skills below the expected level.
It is important that schools ensure these students reach expected literacy and numeracy levels over the course of their education journeys.
Reporting improvement for students most in need of support
Each year, the Department of Education (the department) reports on all Victorian students' literacy and numeracy skills. It does this in the Victorian Budget Paper No. 3: Service Delivery and its annual report.
It only reports the proportion of students who score in the top 3 or top 2 National Assessment Program – Literacy and Numeracy (NAPLAN) bands in reading and numeracy. It does not publicly report specific outcomes for disadvantaged students or students with low English proficiency.
Between 2016 and 2019, the department reported on its progress towards Education State targets each year. These targets aim for equity and excellence for all Victorian students. They seek to break the link between disadvantage and lower education achievement.
The department has not reported its progress on these targets since 2019.
Both types of reporting describe the overall outcomes for all Victorian students in both government and non-government schools.
The department does not publicly report outcomes for government school students specifically, even though it manages these schools.
NAPLAN
The National Assessment Program – Literacy and Numeracy (NAPLAN) is a series of tests that assesses Australian students’ literacy and numeracy skills in years 3, 5, 7 and 9.
Until 2022, NAPLAN scores were split into 10 bands, 6 of which were used for each year level.
From 2023, NAPLAN reporting changed from these 10 bands to 4 proficiency levels.
These changes disrupt time series analysis from 2023 onwards. Despite these changes, the proficiency level of 'needs additional support' is similar to the band 'below national minimum standard'.
Reporting literacy and numeracy
The department reports NAPLAN reading achievement alone as representative of students' literacy skills. It does not report writing achievement. This means it does not report the full range of students' literacy skills.
The department reports NAPLAN numeracy achievement in full.
Our key findings
Our findings fall into 4 key areas:
| 1 | Student literacy and numeracy outcomes have been stable since 2012. |
| 2 | The department has not improved outcomes for Aboriginal students and students experiencing disadvantage since 2012. |
| 3 | Aboriginal students and students experiencing disadvantage are not learning at a rate that will close the gap with other students. |
| 4 | The department's reported measures are not a fair or transparent presentation of student outcomes. |
Key finding 1: Student literacy and numeracy outcomes have been stable since 2012
Outcomes for students overall have not significantly improved
For Victorian students overall, literacy and numeracy outcomes have been stable since 2012.
When the department looks at average NAPLAN scores for all students, these have improved for literacy since 2012. But there are also areas where student achievement has either not changed or declined slightly since 2012.
We looked at whether the department is meeting its Education State targets for student achievement and improvement for the period 2012–22. These targets focus on increasing the proportion of all students achieving at a high level and breaking the link between disadvantage and students' learning outcomes.
We found that these outcomes need to improve in a sustained and widespread way if the department is to meet these targets and more students are to realise their learning potential.
To achieve this, the department needs to ensure:
- more students each year meet or exceed their expected learning level
- more students improve at secondary school
- improvement for all types of students.
Based on the department's reporting, it is not on track to make the significant improvement in student outcomes the Education State targets seek.
Key finding 2: The department has not improved outcomes for Aboriginal students and students experiencing disadvantage since 2012
Outcomes are not improving for some students
While there has been some improvement in NAPLAN scores for Aboriginal students and students experiencing disadvantage, the proportion of these students below expected level is not improving over time.
At year 3, a higher proportion of Aboriginal and disadvantaged students are below expected reading and numeracy level than their non-Aboriginal and non-disadvantaged peers. There has been very little change since 2012.
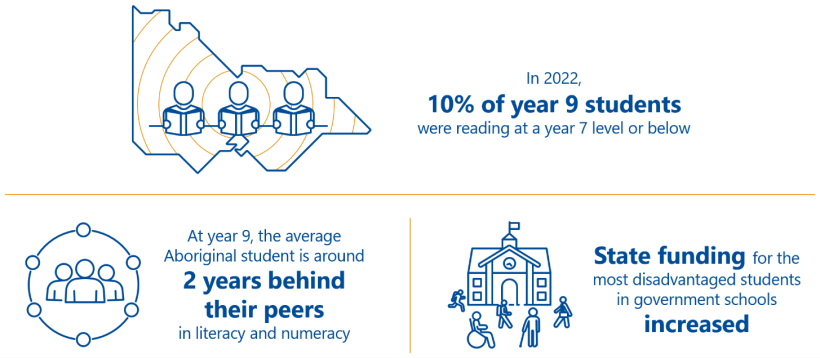
By the time Aboriginal and disadvantaged students reach year 9, the proportion of them reading below expected level has significantly increased. In 2022, this proportion was over 20 per cent for Aboriginal students and the most disadvantaged students.
Aboriginal and disadvantaged students are also more likely to be below expected level in numeracy than other student groups. In 2022, this proportion was about 10 per cent, compared to less than 5 per cent for students overall.
When a year 9 student is categorised as below the expected reading and numeracy level, this means their numeracy skills are at a year 7 level or lower.
Key finding 3: Aboriginal students and students experiencing disadvantage are not learning at a rate that will close the gap with other students
Some students are not catching up
Aboriginal students and students experiencing disadvantage are more likely to begin their learning journey behind the expected level for their age.
They need to learn at a faster rate than their peers to 'catch up' and meet the expected level of achievement. This may take some years.
These students are not learning at a rate that will close the achievement gap between them and their non-Aboriginal or non-disadvantaged peers.
Key finding 4: The department's reported measures are not a fair or transparent presentation of student outcomes
The department does not report outcomes for all student subgroups
The department's reporting of reading outcomes is not a good presentation of students' literacy skills. It presents students' reading outcomes, but not writing outcomes. Presenting both would give a more complete understanding of their literacy skills.
Many students read better than they write, so the department is not presenting a clear picture of literacy as a whole.
The department’s reporting of numeracy outcomes is a full presentation of students’ numeracy skills.
The department reports outcomes against budget measures that focus on students in all Victorian schools and those that achieve at high levels.
This is not a fair presentation of the department's performance, as it does not report outcomes for government students specifically. It also does not report outcomes for groups of students whose achievement is less likely to meet expected levels.
Other public reporting of student outcomes is not easily accessible. This means parents do not have a fair understanding of student achievement in government schools.
There are opportunities for the department to revise how it reports government school NAPLAN results as new education agreements are made at the national level. It may also consider how other jurisdictions publicly report outcomes for their government school students.
1. Student literacy and numeracy outcomes
In 2015, the Victorian Government set ambitious goals for improving literacy and numeracy outcomes. This included targets to improve outcomes for students overall and to close the gap between disadvantaged students and their peers.
Across this period, literacy and numeracy outcomes for all Victorian students have been stable.
For Aboriginal students and students experiencing the most disadvantage, the proportion below expected levels of literacy and numeracy has been stable or increased. These students are not learning at a rate that will close the gap with other students.
Literacy and numeracy outcomes in Victoria
Education State targets for literacy and numeracy
The Victorian Government sets its strategic objectives for Victorian students' literacy and numeracy within its Education State reform agenda.
In 2015 the government introduced the Education State reforms to build ‘an education system that produces excellence and reduces the impact of disadvantage’. The government has invested $10.8 billion in this initiative.
Education State has 4 target areas that encompass outcomes for Victorian students across government and non-government schools.
| Target area | Ambition |
|---|---|
| Learning for life | More students achieving excellence in reading, maths, science, critical and creative thinking, and the arts. |
| Happy, healthy and resilient kids | Building the resilience of our children and encouraging them to be more physically active. |
| Breaking the link | Supporting more students to stay in school and breaking the link between disadvantage and outcomes for students. |
| Pride and confidence in our schools | Parents and communities will report their level of pride and confidence in their local government schools. |
Source: Education State targets | Victorian Government (www.vic.gov.au).
Two of the targets for Learning for life focus on increasing the proportion of year 5 and year 9 students excelling in literacy and numeracy.
For year 5 students, the target for 2020 is that 25 per cent more year 5 students have reached the highest levels of achievement in reading and maths.
For year 9 students, the target for 2025 is that 25 per cent more year 9 students will reach the highest levels of achievement in reading and maths.
One of the government's targets for Breaking the link is to reduce the gap in NAPLAN reading achievement between disadvantaged and non-disadvantaged students in years 5 and 9 by 15 per cent by 2025.
School performance needed to achieve targets
The government's Education State targets for student achievement include students in both government and non-government schools.
In 2023, 63 per cent of Victoria's students were enrolled in government schools.
This means the department needs to significantly improve outcomes for government school students if it is to meet the Education State targets.
Government funding to improve student outcomes
The department distributes Commonwealth and Victorian government funding for schools.
The amount of funding each school receives is based on the Schooling Resource Standard. This is an estimate of how much total public funding a school needs to meet its students' educational needs.
The Schooling Resource Standard consists of a base level of funding per student, and additional loadings based on student and school attributes to help meet education needs.
Some of the loadings are for:
- Aboriginal and Torres Strait Islander students
- students with low English proficiency
- students experiencing socio-educational disadvantage.
The department also distributes funding to schools for targeted initiatives designed to improve outcomes for students with low literacy and numeracy. This includes the Middle Years Literacy and Numeracy Support initiative and the Tutor Learning Initiative.
The department expects other funding for student health and wellbeing initiatives to also support students' learning and achievement.
Investment in education has increased
For the period from 2015 to 2021, the Victorian Government increased its base level of funding per government school student by 33.7 per cent, adjusted for inflation.
This reflects the government's commitments in the current National School Funding Reform Agreement.
It has also increased the additional funding it allocates to students at each level of social advantage level using the Index of Community Socio-educational Advantage.
| The government's … | Increased from … | To ... |
|---|---|---|
| base funding per government school student per year | $11,522* in 2015 | $15,405 in 2021. |
| average total funding per student in the lowest quarter of socio-educational advantage per year | $15,426* in 2015 | $21,478 in 2021. |
Note: *2015 figures are adjusted for inflation, 2021.
Source: Australian Curriculum, Assessment and Reporting Authority.
Measuring literacy and numeracy
NAPLAN is an annual series of tests for students in years 3, 5, 7 and 9. It assesses the learning domains of:
- numeracy
- reading
- writing
- spelling
- grammar and punctuation.
NAPLAN tests give point-in-time insight into student progress and achievement in literacy and numeracy. The government intends the program's results to complement teacher judgement and other formal and informal testing in schools.
Expected literacy and numeracy levels
Between 2008 and 2022, the Australian Curriculum, Assessment and Reporting Authority (ACARA) used a range of 10 bands to report student literacy and numeracy for years 3, 5, 7 and 9. Each band covered a particular range of NAPLAN scores.
For each year level, ACARA defined the second lowest band for each year as the national minimum standard. Figure 1 shows there are 4 bands above each minimum standard, and one band below. This is because students were tested for proficiency in skills appropriate to their year level.
Figure 1: NAPLAN achievement bands for each year level
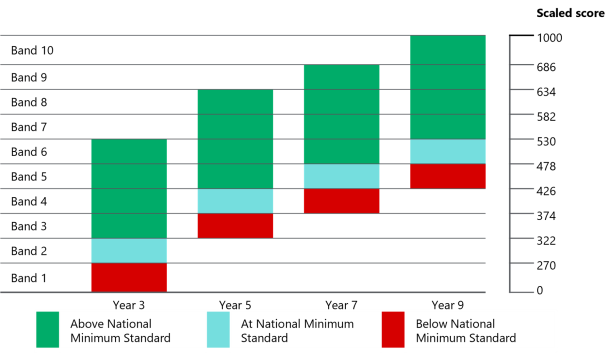
Source: ACARA.
What we examined
We examined the average NAPLAN literacy and numeracy outcomes for all government school students for the period 2012–22. We looked at all the literacy domains:
- reading
- writing
- spelling
- grammar and punctuation.
We did this by analysing NAPLAN data the department supplied.
We also looked at results for some student subgroups:
- Aboriginal students
- students experiencing disadvantage
- EAL students.
To better understand the department's performance in improving outcomes for these students, we have focused on the proportion of students below the national minimum standard. We describe this as 'students below expected level'.
How we defined disadvantaged students
The department measures a student's social disadvantage by calculating their Student Family Occupation and Education level. This index looks at the student's family's work and education.
The department defines 2 levels of social disadvantage. It uses these levels to:
- decide how much equity funding to give to schools
- monitor these students' outcomes.
| Level ... | It describes students with parents who ... | Or ... |
|---|---|---|
| 1 is a higher level of disadvantage. | are unemployed with below diploma-level education | have lower-skilled jobs with very low or low education. |
| 2 is a lower level of disadvantage. | have various combinations of medium and low-skilled jobs and education levels | are unemployed with a diploma level education. |
Greater disadvantage at secondary schools
Using these 2 levels of disadvantage, we found that government secondary schools have a higher proportion of disadvantaged students than government primary schools do.
Of the students whose 2022 NAPLAN results we analysed, about 20 per cent of those at primary school were eligible for either level 1 or 2 equity funding. This rose to about 25 per cent of secondary school students.
This increase is not large enough to affect the outcomes of our analysis.
Further information
For more in-depth background information, please see Appendix C (Audit scope and method) and Appendix D (Audit context).
Student literacy and numeracy outcomes have been stable since 2012
Outcomes have not worsened for students overall
For all Victorian school students, literacy and numeracy outcomes have been stable since 2012. There are areas where student outcomes have clearly improved, such as reading for year 3 and year 5 students. But there are also areas where student achievement has either not changed or declined slightly since 2012.
Outcomes for government school students
For the 10 years since 2012, the department has improved some outcomes for some government school students in literacy, though performance varies across literacy skills. This improvement is more likely during primary school than secondary school.
From 2012 to 2022, numeracy outcomes were relatively stable for EAL students and students overall.
Learning for life
The department's Learning for life targets focus on excellence for all Victorian school students.
While there have been improvements for some students, outcomes for most students have stayed the same since 2012.
Based on the department's reporting, it is not on track to make the significant improvement in student outcomes sought by the Education State targets.
This analysis is in the department's annual reports and in its performance statements in the budget papers. For this reason, we have not replicated the department's analysis for students achieving above expected level in this report.
The proportion of students not meeting expected levels has not improved since 2012
Understanding outcomes for students who most need support
The department’s public reporting focuses on students in the top 2 or 3 NAPLAN bands for all Victorian students.
This is a narrow view of the performance of government schools. It does not show whether the department is succeeding in meeting its objectives of breaking the link between student disadvantage and achievement.
The department's current reporting does not give a clear view of its performance in equipping students with basic skills they need to participate in the community.
Breaking the link
The Breaking the link target aims to reduce the gap in outcomes between disadvantaged students and non-disadvantaged students.
The target is to reduce the gap in reading achievement between disadvantaged and non disadvantaged students in years 5 and 9 by 15 per cent, by 2025.
The target is for all students in Victorian government and non-government schools.
However, the department is unlikely to meet this target without a sustained reduction in the percentage of government school students below expected reading levels.
The department has not reduced the proportion of students below expected reading level
The department has not improved the percentage of students reading below expected levels for the period 2012–22. This is the case for students overall as well as all subgroups and year levels (see Figure 2).
This means there was a similar percentage of students reading below expected levels in 2022 as there was in 2012. Year 5 is an exception – outcomes in 2022 were similar to those in 2014.
Figure 2: Proportion of Victorian students below the national minimum standard in reading, 2012 to 2022
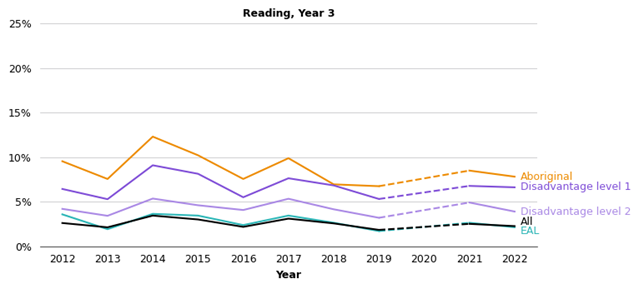


Note: Victorian year 5 reading results between 2012 and 2014 show a similar trend to other states and territories. See Appendix D, Figure D1.
Source: VAGO, using department data.
The department has not reduced the proportion of students below expected numeracy level
The department has not improved the percentage of students below expected numeracy level since 2012. This is true for all students, subgroups and year levels.
Figure 3: Proportion of Victorian students below the national minimum standard in numeracy, 2012 to 2022
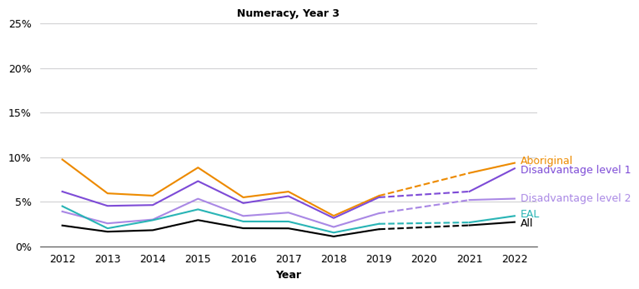


Source: VAGO, using department data.
The proportion of students below expected literacy level increases with year level
Students below expected level by year level
Overall, the department has improved some literacy outcomes for some students, though performance varies across each of the 4 literacy skills. More of this improvement happened at the primary level.
When we examined average NAPLAN scores, we found a pronounced increase in the proportion of students below expected level from year 7 up for all literacy skills (see Figure 4). This is most prominent for writing: from 1 per cent of year 3 students to 18 per cent of year 9 students.
Students below expected numeracy levels also increases, though less than for literacy levels.
Figure 4: Proportion of Victorian students below national minimum standards, by year level and subgroup
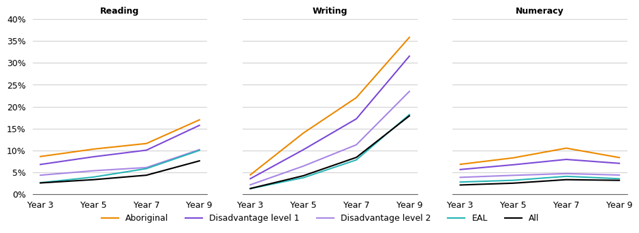

Source: VAGO, using department data.
The department is not closing the achievement gap for some groups of students
Some students need a faster rate of learning to catch up
Some students start school with fewer foundational skills in literacy and numeracy.
Students experiencing high levels of disadvantage, Aboriginal students and EAL students are more likely to begin their learning journey behind the expected level for their age.
These students need to learn at a faster rate than their peers to 'catch up' and meet the expected level of achievement. This may take some years.
If they are not supported to learn more quickly, these students may never catch up and are likely to leave school still behind the wider population.
The student learning journey
How quickly students develop literacy skills and knowledge changes over their time at school. It increases rapidly up until year 3 and slows down from year 5 to year 10. Using NAPLAN data, we see this learning curve from year 3 to year 9.
Figure 5: Expected learning for students from year 3 to year 9
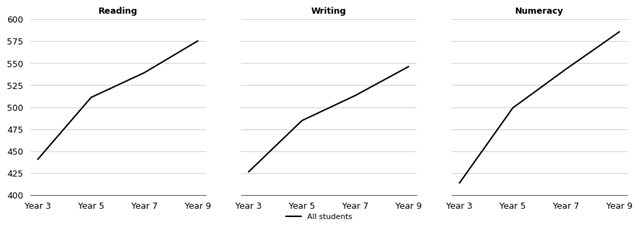

Source: VAGO, using department data.
Achievement gaps are not closing for some student groups
Our analysis shows that all students are learning and building up their skills in literacy and numeracy at broadly similar rates.
This means that, except for EAL students, other subgroups are not being taught skills quickly enough to overcome literacy and numeracy gaps. On average, EAL students have faster rates of learning. This means they achieve slightly better results than other students.
For all disadvantaged student groups, the achievement gap closes slightly over time, except in writing.
On average, Aboriginal students are not learning quickly enough to close the skill gaps. For writing skills, the gap widens.
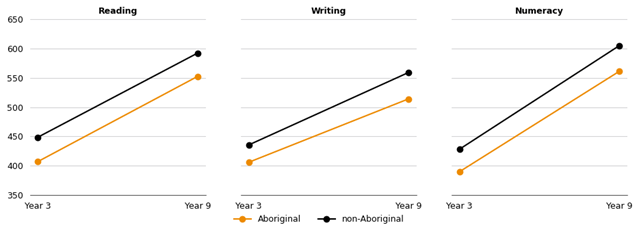
Achievement gaps are not closing for Aboriginal students
Current data shows Aboriginal students need to make up an achievement gap of one to 3 years over their learning journey.
On average, Aboriginal students start school with lower literacy and numeracy skills. While they learn at a similar rate to non-Aboriginal students in most domains, this means the achievement gap persists throughout their education.
At year 5, the average Aboriginal student is one year below expected level in most literacy skills. Their writing skills are 2 years below expected level. This gap increases to 3 years by year 9.
This means an average year 9 Aboriginal student has writing skills similar to an average year 6 or year 7 student from the wider population.
The rate of learning slows for numeracy as well. By year 9 the average Aboriginal student is achieving at year 8 level.
Figure 6: Expected rate of learning for Aboriginal and non-Aboriginal students from year 3 to year 9

Source: VAGO, using department data.
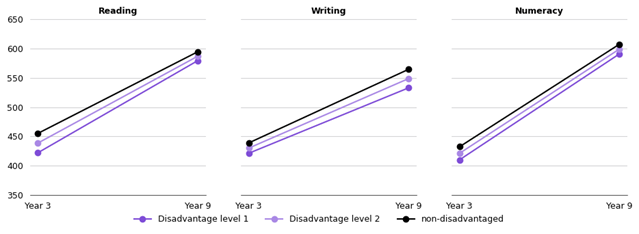
Achievement gaps are not closing for disadvantaged students
Current data shows disadvantaged students need to make up an achievement gap of one to 2 years over their learning journey (see Figure 7).
Both level 1 and 2 disadvantaged students have lower achievement outcomes than non disadvantaged students. They are acquiring numeracy and some literacy skills at a slightly faster rate, but not enough to close the gap.
On average, disadvantaged students acquire writing skills at a slower rate than their peers. This means the gap widens.
These effects are greater for level 1 disadvantaged students (2 years behind) than level 2 students (one year behind).
Figure 7: Expected rate of learning for disadvantaged and non-disadvantaged students from year 3 to year 9

Source: VAGO, using department data.
Achievement gaps are closing for EAL students
Current data shows EAL students have similar scores to the wider student population at year 3.
We found these students are learning more quickly on average, and are more likely to finish school at or above the expected level of achievement and ahead of their non-EAL peers.
Figure 8: Expected rate of learning for EAL and non-EAL students from year 3 to year 9
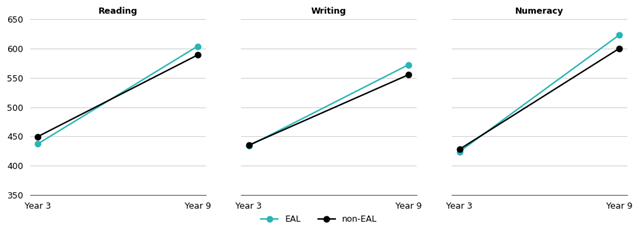

Source: VAGO, using department data.
2. Reporting literacy and numeracy outcomes
The department’s reporting of literacy outcomes is limited to reading and not a full presentation of students' literacy skills. Student achievement varies significantly between the domains of reading and writing. Reporting of literacy as both reading and writing is a more accurate presentation of students' skills.
The department's reported measures are not a fair or transparent presentation of student outcomes. This means that Victorians are not able to form a view on whether it is achieving its objectives of closing the achievement gap for some students.
The department assesses and understands student literacy and numeracy
The department understands student outcomes
The department collects and uses a broad range of student performance information, but its public reporting of this data is limited.
It collects student assessment and NAPLAN data then analyses it to understand literacy and numeracy outcomes for all Victorian government school students over time and by subgroup.
These subgroups include:
- Aboriginal students
- students experiencing disadvantage
- EAL students.
The department assesses student literacy and numeracy in line with all elements of the Victorian Curriculum for English and Mathematics. Its data systems record this data for each student, as well as their NAPLAN scores.
The department gives schools and regional offices regular and detailed analysis of student outcomes so that they understand trends in achievement.
It also monitors student outcomes at a statewide level and uses this data to plan its support for schools and their students.
The measures the department reports for literacy are too narrow
The department fully reports numeracy
The department reports students' numeracy achievement using the NAPLAN numeracy domain. NAPLAN assesses students' knowledge and skills against 3 strands of number and algebra, measurement and geometry, and statistics and probability. These align with the skills taught in the curriculum.
NAPLAN assesses these skills in a single test and records a score for each student as the numeracy domain.
The department reports only reading
The department only reports the NAPLAN reading domain as its measure of Victorian students' literacy skills. This is in line with its reporting requirements.
However, students' reading and writing outcomes can vary substantially. Together, reading and writing are the 2 key elements of literacy – to understand others and to express oneself.
This means that reporting reading only is not an accurate presentation of literacy achievement for all students and student subgroups.
Reporting both reading and writing changes literacy outcomes
Our understanding of students' literacy changes when both reading and writing are reported.
For 2022, we compared students' achievement in both reading and writing. We did this for:
- all government school students
- Aboriginal students
- students experiencing disadvantage
- EAL students.
Except for EAL students, the proportion of students below expected level is higher for writing than for reading.
Student reading and writing skills differ
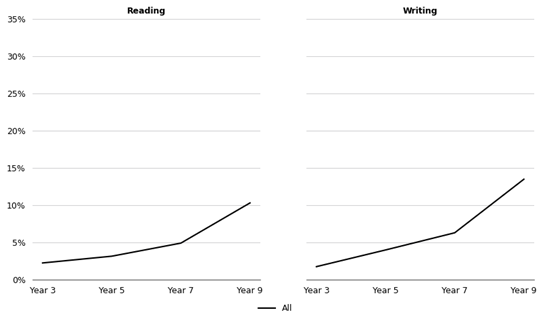
The proportion of all students who read below expected levels increases from 3 per cent in year 3 to 10 per cent in year 9.
The increase is more substantial for writing. It rises from 1 per cent in year 3 to 14 per cent in year 9.
Figure 9: Proportion of all students below expected level in reading and writing in 2022 by year level
Source: VAGO, using department data.
Literacy outcomes for Aboriginal students
The proportion of Aboriginal students below expected reading level is stable throughout primary school.
This changes at secondary school. By year 9, nearly 25 per cent of Aboriginal students are reading below expected level. The writing gap widens more dramatically.
| In ... | About … | |
|---|---|---|
| year 3 | 8 per cent | of Aboriginal students are reading below expected level. |
| year 5 | 9 per cent | |
| year 7 | 14 per cent | |
| year 9 | 24 per cent |
| In ... | About … | |
|---|---|---|
| year 3 | 6 per cent | of Aboriginal students are writing below expected level. |
| year 5 | 15 per cent | |
| year 7 | 19 per cent | |
| year 9 | 30 per cent |
Figure 10: Proportion of Aboriginal students below expected reading and writing levels in 2022 by year level

Source: VAGO, using department data.
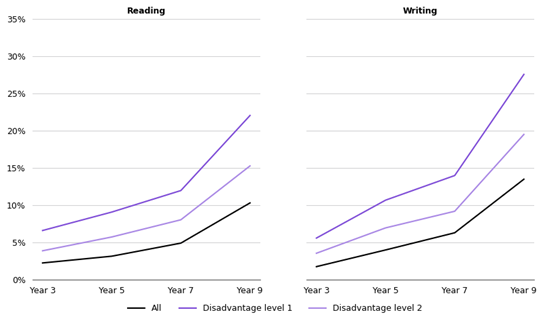
Literacy outcomes for disadvantaged students
The level of disadvantage students experience matters for both reading and writing achievement.
More highly disadvantaged students (level 1) are more likely to both read and write below expected level than less disadvantaged students (level 2).
Their achievement gap also grows more quickly. By year 9, 28 per cent of the most disadvantaged students are reading and writing below expected level.
Figure 11: Proportion of disadvantaged students reading and writing below expected levels in 2022 by year level
Source: VAGO, using department data.
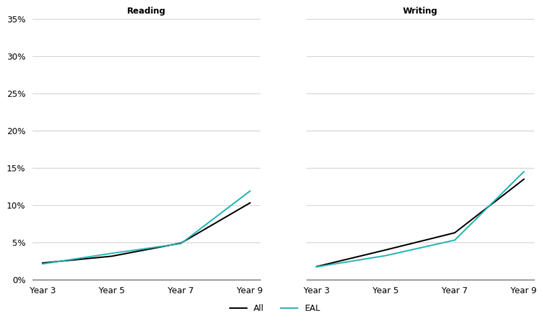
Literacy outcomes for EAL students
Until year 7, a very low proportion of EAL students read and write below expected levels.
Like with other subgroups, this proportion increases significantly at year 9.
Figure 12: Proportion of EAL students reading and writing below expected levels, 2022 by year level
Source: VAGO, using department data.
The department's reported budget measures are not a fair presentation of student outcomes
The department publicly reports on a subset of targets
The Victorian Government sets Education State targets each year for:
- the proportion of students above the bottom 3 NAPLAN bands (for all students and Aboriginal students)
- the proportion of students in the top 2 NAPLAN bands (for all students).
The department reports against the Victorian Government's strategic objectives in its performance statement in Budget Paper No. 3.
This statement is intended to show whether the department achieved the targets for literacy and numeracy that year.
The department's annual reports show progress against these measures over a 5-year period.
Reporting does not include student cohorts below expected levels
The department's current reporting of students' outcomes does not include the proportion of students below expected level, each year or over time.
These students are more likely to be Aboriginal, experiencing high levels of disadvantage or have English as an additional language. Students in these subgroups experience factors known to impair their education achievement.
When the department does not report students below expected level, it does not fully present how it is performing in improving outcomes for students who most need learning support.
This gap in reporting is very important because it does not allow the community to understand whether the department is meeting the government's stated objective to reduce the impact of disadvantage on student outcomes.
From 2023, ACARA has changed the way it reports students' NAPLAN achievement. However, it will still be possible to report those students' whose achievement is not at expected level. These students will be identified as 'needs additional support' rather than 'below national minimum standard'.
Fair presentation of government service delivery
In 2023, VAGO tabled the report Fair Presentation of Service Delivery Performance 2022. That report concluded that service delivery performance is not clearly visible to Parliament and the community.
We found that current Budget Paper No. 3 reporting makes it hard to understand how well departments are delivering services.
Fair presentation of service delivery means that performance measures should be relevant to outputs. They should be comparable, useful, clear and attributable to the department.
Model performance statement for education
That report included a model performance statement for the department that described these measures. This model performance statement identified that the output for the department is an educated student. Output measures for a student include:
- academic results, such as NAPLAN
- engagement, measured as days absent from school
- attainment of the Victorian Certificate of Education.
It recommended that the department report NAPLAN and attainment results as an indicator of its effectiveness.
Importantly, it also recommended that the department report these results for disadvantaged students, as well as students in metropolitan, regional and rural areas.
The department should make more information available to the public
The department no longer reports against Education State targets
The department began reporting progress towards Education State targets in 2016 in its annual reports. These reports compared that year's achievement to the 2025 targets.
For example, reporting against the Breaking the link target compared that year's gap in NAPLAN scores between disadvantaged and non-disadvantaged students with the 2025 target.
The department made its last report in 2019. It has not updated information about progress since.
Performance data is not easily accessible
Detailed information about student performance is publicly available but not easy to access. This makes it difficult for parents and the community to understand whether the department is meeting the government's objectives to improve student achievement.
The department does not comprehensively report NAPLAN results for government school students. Other jurisdictions, such as Western Australia and the Northern Territory, do report these results for their government schools.
School-level data is available and accessible through the Australian Government’s My School website. This website does not provide system-level data about government or non-government schools.
ACARA presents detailed NAPLAN results for each state and territory. It makes data publicly available for analysis, and this reporting does include student subgroups and parent background.
As a result of agreement between state, territory and Australian governments, ACARA does not report the difference between government and non-government schools.
More importantly, understanding ACARA's reporting requires significant data literacy skills.
This makes it less accessible to parents and the community who most need information about school performance.
Performance data is the foundation for system improvement
When the Victorian Government reports education outcomes at the system level, it combines the outcomes of government and non-government students. This does provide a view of education outcomes in Victoria. But it is not a complete view.
The department plays a number of distinct roles in delivering education. It:
- manages the education system
- funds that system
- sets policies for it
- provides education services.
It is reasonable and desirable that all Victorians can easily understand its performance in these roles.
Measurement is a foundation for understanding and improving performance. As such, the department should clearly report its performance as a service provider.
Appendix A: Submissions and comments
Download a PDF copy of Appendix A: Submissions and comments.

Appendix B: Abbreviations, acronyms and glossary
Download a PDF copy of Appendix B: Abbreviations, acronyms and glossary.
Appendix C: Audit scope and method
Download a PDF copy of Appendix C: Audit scope and method.
Appendix D: Audit context
Appendix E: Modelling of student outcomes
Download a PDF copy of Appendix E: Modelling of student outcomes.