Managing the Level Crossing Removal Program
Overview
The level crossing removal program (LXRP) aims to contribute to long-term improvements to the road and rail network by easing transport congestion and delivering a safer and more efficient road network. The LXRP is two years into an eight-year program. This audit identifies risks, lessons and opportunities for improvement for future works. We examined whether the LXRP is cost-effective in terms of whether it has improved, or is expected to improve, the safety and efficiency of the state's road and rail network. Our audit focused on the role of the Level Crossing Removal Authority, Public Transport Victoria, and Transport for Victoria in providing oversight and strategic focus for the LXRP.
Transmittal letter
Ordered to be published
VICTORIAN GOVERNMENT PRINTER December 2017
PP No 358, Session 2014–17
President
Legislative Council
Parliament House
Melbourne
Speaker
Legislative Assembly
Parliament House
Melbourne
Dear Presiding Officers
Under the provisions of section 16AB of the Audit Act 1994, I transmit my report Managing the Level Crossing Removal Program.
Yours faithfully

Andrew Greaves
Auditor-General
14 December 2017
Acronyms
| ALCAM | Australian Level Crossing Assessment Model |
| ARO | Accredited rail operators |
| BCR | Benefit–cost ratio |
| CBA | Cost–benefit analysis |
| CPLU | Cranbourne Pakenham Line Upgrade |
| CTD | Caulfield to Dandenong |
| DEDJTR | Department of Economic Development, Jobs, Transport and Resources |
| DPC | Department of Premier and Cabinet |
| DTF | Department of Treasury and Finance |
| HCMT | High Capacity Metropolitan Train |
| HVHR | High Value High Risk |
| IDO | Integrated development opportunity |
| KPI | Key performance indicator |
| LXRA | Level Crossing Removal Authority |
| LXRP | Level Crossing Removal Program |
| MTIP | Major Transport Infrastructure Program |
| MTM | Metro Trains Melbourne |
| MTP | Metro Tunnel Project |
| NACG | National Alliance Contracting Guidelines |
| NOP | Non-owner participants |
| PTV | Public Transport Victoria |
| TfV | Transport for Victoria |
| VAGO | Victorian Auditor-General's Office |
Audit overview
Melbourne is facing unprecedented population growth in the coming decades, which will result in an increase in travel demands. Plan Melbourne 2014 stated that, by 2050, Melbourne's road and rail network will need to accommodate an additional 10.7 million daily trips, on top of the 14.2 million daily trips recorded in 2014.
The Level Crossing Removal Program (LXRP) is one of the Victorian Government's key transport infrastructure projects. Part of an overarching policy to improve Melbourne's transport network, its stated aim is to remove 50 of the most dangerous and congested level crossings.
Following its election in 2014, the government upheld its pre-election commitment to remove 50 crossings by 2022. The May 2015 Budget included an additional commitment to remove 20 crossings by 2018. Since the LXRP's announcement, the government has identified an additional two level crossings for removal, bringing the total to 52.
Established in 2015, the Level Crossing Removal Authority (LXRA) took over responsibility for managing the program from VicRoads. At September 2017:
- 10 level crossings had been removed
- 16 were in design and construction stages
- 11 had a contract awarded
- nine were in the tender stage
- six were in early planning stages.
As the LXRP is only two years into an eight-year program, our assessment at this time serves to identify risks, lessons and opportunities for improvement for future works.
We have examined whether the LXRP is cost-effective in terms of whether it has improved, or is expected to improve, the safety and efficiency of the state's road and rail network.
Our audit focused on the role of the Department of Economic Development, Jobs, Transport and Resources (DEDJTR), LXRA, Public Transport Victoria (PTV), and Transport for Victoria (TfV) in providing oversight and strategic focus for the LXRP.
Conclusion
Contrary to publicly stated objectives, not all of the 50 level crossings selected for removal are the most dangerous and congested. In this sense, the LXRP is not fully effective when compared to the stated objective.
The delivery of the program is ahead of schedule, and LXRA expects to surpass its target of removing 20 crossings by 2018. However, this pace presents risks to achieving value for money. These risks are compounded by an inadequate and delayed business case, and poor indicators to measure program benefits.
While LXRA is managing some aspects of the program well, including rail occupations and monitoring integrated development opportunities (IDO), opportunities remain to improve the LXRP—in particular, the rigour applied to and transparency of site selection and prioritisation, site packaging and procurement, benefits management, and integration of various rail projects.
Addressing these concerns will provide greater assurance that the program will both improve the safety and efficiency of the state's road and rail network, and maximise value for money.
|
Network integrity refers to a functionally effective, reliable, maintainable, secure, safe and environmentally compatible public transport network. |
Gaps in rail network integrity have had significant consequences for the integration of the LXRP and other concurrent rail projects, including the Metro Tunnel Project (MTP) and the Cranbourne Pakenham Line Upgrade (CPLU).
Now that TfV is responsible for setting the state's strategic transport direction, it needs to address the gaps in rail network planning and requirements, so that future network requirements appropriately inform planning for major rail transport projects. TfV's development of transport planning frameworks has the potential to improve rail network planning.
Findings
Program business case
The LXRP business case was finalised in April 2017, almost two years after the program had commenced.
Weaknesses in the business case undermine its purpose and its value as a basis for the government's decision to commit to the investment. This situation needs to be remedied in future advice to government about investment decisions for crossing removals, if these decisions are to be based on a sound understanding of the costs, benefits and options of the investment.
Site selection and prioritisation
The LXRP business case is not consistent with the stated objective of the LXRP—to remove 50 of the most dangerous and congested level crossings—in that it omits the word 'most'.
This important difference arises in part because DEDJTR did not assess the merits of the 50 level crossing sites identified for removal, which were part of an election commitment in 2014.
As a result, the April 2017 approved business case does not include any analysis or rationale for why the 50 level crossings were selected as higher priority—or demonstrate that they were more dangerous and congested—than other level crossings across Melbourne. The 50 selected level crossing sites include a number of sites that have not been identified as dangerous and congested.
This means that the business case was necessarily limited in its function to fully inform the incoming government about available options and whether the selected sites provided the best approach for it to achieve its desired policy objectives.
Options assessment for grade separation
LXRA and VicRoads completed their options assessments for grade separations—separating the level of rail and road—of 20 crossings before the business case was completed.
LXRA's options assessments for the remaining 30 crossings—developed as part of the business case—differed in approach and in the level of detail to the first 20. The options assessment framework for these 30 crossing sites included a multi-criteria analysis tool to guide the selection of grade separation types. This framework aims to ensure that the chosen options are cost‐effective and defensible, and the process is comprehensive, transparent and consistent.
The options assessment framework does not weight criteria to indicate the relative importance of each criterion. While this allows for flexible decision-making, it also means options assessments can be inconsistent and that the selection of the preferred option lacks transparency.
LXRA refers all preferred grade separation options, including supporting options analysis, to the Minister for Public Transport (the Minister) for approval. The Minister has discretion to approve the option or, where it is likely to be contentious with key stakeholders, refer it to government for endorsement. LXRA's identification of contentious sites is subjective, with no clearly documented rationale, and offers limited transparency around how decisions were made.
In advising government on options for the Frankston line sites, LXRA used different assessment criteria than it used for the other sites. LXRA advised that it did this to accommodate additional information gathered about the sites through more detailed analysis and community consultation. However, the existing option assessment framework is designed to incorporate additional information as site investigation proceeds.
There are important differences between the two sets of criteria. In particular, the criteria used for the Southern package of crossing removals focus on aspects like impact on adjacent properties whereas the original criteria focus on project alignment and outcomes. While the modified criteria produced similar results to the original assessments in this instance, the decision to use different criteria indicates that LXRA is not consistently or transparently applying the options assessment framework.
Program cost
The cumulative cost of the program has increased by more than 38 per cent—based on the initial estimate of $5–6 billion in 2015—to $8.3 billion at July 2017.
DEDJTR did not follow the High Value High Risk (HVHR) guidelines to update the business case to reflect ongoing changes to program cost estimates arising from scope changes, including the addition of two more sites. The identification of future network requirements also did not result in updates to the program costs in the business case. The change in cost, with no assumed benefit increase, would result in a reduced benefit–cost ratio (BCR).
The business case was set up on the assumption of like-for-like replacement of existing infrastructure, but this was not realistic. For example, as the program progresses, works at level crossing removal sites along the Frankston and Cranbourne/Pakenham lines—such as required traction power upgrades and High Capacity Metropolitan Train (HCMT) requirements—are being identified. These requirements were known at the time of the business case development.
The business case provides for future proofing works—for example increasing station platform length, extending the width of the rail corridor, or building wider road bridges—for 16 crossings. LXRA has made provision of $148 million for this work, which is less than 2 per cent of the $7.6 billion identified in the business case.
Procurement and delivery
The 52 level crossing removal sites are divided into packages for delivery—eight packages contain between two and nine level crossings and two packages have one crossing each. There are six crossings that LXRA has not yet allocated to a package.
The LXRP is being delivered using a mix of contract types:
- Competitive alliance contracts—two or more shortlisted parties develop competing project costs (26 sites).
- Partial price competitive alliance contracts—shortlisted parties develop pricing for some elements of the total project cost. The sole successful party then prices the remaining elements alongside the owner of the project (24 sites).
- Design and construct contracts—the client develops a limited design and invites potential suppliers to tender on the basis of completing and constructing the design. This contract typically allocates construction and design risk to the suppliers (two sites).
Partial price competition
While LXRA and VicRoads procured the initial 20 sites through competitive price competition, LXRA will only apply full price competition to a quarter of the remaining 32 sites, procuring the rest through partial price competition. In one instance, for the North Eastern package, LXRA procured the proponent for all four level crossings in the package using partial price competition. The main consideration for this decision was to fast track procurement so that LXRA could meet the government's committed time frame for the LXRP and the duplication of the Hurstbridge line.
While partial price competition can streamline the tendering process—as LXRA does not need to compare two fully priced proposals—it also removes an element of competitive tension. Victorian policy permits the use of partial price competition in some circumstances—for example where the community needs works to commence immediately. However, LXRA's rationale for selecting this method for its North Eastern Package—to fast-track the package to meet a government commitment—is not in itself a sufficient justification.
Contract structure
Under its contract structure for the North Eastern, North Western, Western and Southern packages, parties bid competitively for the initial sites. If LXRA is satisfied with the alliance's performance on those sites, it asks the alliance to develop a formal proposal for the additional sites in the package. This means the additional sites will not be subject to full price competition.
LXRA advises that there are benefits to this structure. For example, according to LXRA, the structure allows for stable engagement with the private sector and locks in key resources prior to significant construction activity across Australia in 2019–22. However there are some inherent risks in the procurement process, primarily due to reduced price and design competition. These risks are compounded in the North Eastern package, where LXRA did not use full price competition to procure a proponent for the initial sites.
Managing procurement risks
To manage its procurement risks, LXRA is using benchmarking and the commercial frameworks of its alliance agreements.
LXRA's benchmarking framework includes a tool for comparing price and productivity efficiencies across the LXRP alliances. The tool allows LXRA to monitor whether it is achieving value for money in delivery of the program. To date, LXRA has only applied the benchmarking tool to the North Eastern package.
When awarding initial works packages, LXRA locks in overhead and profit for all remaining sites in that package. This introduces an element of competition into awarding the remaining sites. However, there is a risk that parties can bid low on overheads and profit with the expectation of increased direct job costs on later sites. To date, overhead and profit as a percentage of direct job costs has been lower for packages using the deferred pricing model than for the initial four alliances that did not use this model. This reinforces the need for LXRA to continue to develop its benchmarking tool to assess proposals effectively and identify potential under- or overpricing. It is important that LXRA continues to improve its framework and embed it into future procurements.
LXRA is also using a risk and reward regime for each alliance, which compares actual and target performance in both cost and non-cost areas. The non-cost elements of LXRA's risk and reward regimes are in line with national guidance and include clear methods for calculating performance. However, LXRA has capped the amount that its contractors pay in the event of a cost overrun. This means there is a risk that if the cost overrun for a package exceeds the cap, the state will effectively bear all additional project risk.
Packaging and sequencing
The LXRP business case considered two options for packaging the remaining 30 level crossing removals:
- a corridor approach—in which crossing sites along rail corridors are packaged together
- a discipline-based approach—where similar work types are packaged together (such as stations, power, signalling and rail track).
LXRA's evaluation of these two options emphasised that time, management of disruptions, and risk management were important considerations. LXRA ultimately determined that the corridor approach better matched the LXRP's cost and timeliness procurement objectives.
LXRA did not analyse which of the crossings had the highest priority for removal from a safety or rail efficiency perspective, to inform the sequencing of crossing removals. Of the 50 level crossings, LXRA has prioritised those that had greater preparatory work completed and that had a less complex design solution. This has brought forward some crossing removals, and LXRA expects to exceed the government target of 20 crossing removals by 2018.
The remaining crossings are more complex and more challenging to complete within the allocated time frame and budget. However, it is too early to tell the impact of the current packaging and sequencing regime on the overall program.
LXRA is using 10 packages across the whole program. However, it did not package the following crossings using the corridor approach:
- Abbotts Road, Dandenong South—part of the Western package instead of the Caulfield to Dandenong (CTD) package
- Skye Road, Frankston—part of the North Western package instead of Southern package.
The level crossing at Skye Road was initially part of the Southern package. However, following a decision to accelerate the removal of this level crossing, LXRA moved Skye Road into the North Western package.
LXRA estimated that this cost an additional $11 million, due to a reduction in planned program efficiencies. While $11 million is not material in the context of the whole LXRP program, accelerating its removal by moving responsibility to the North Western Alliance helps LXRA to meet the government's committed target of removing 20 level crossing by 2018.
Rail occupation management
Removing level crossings involves the temporary closure of the rail line and its occupation to enable construction works. LXRA and alliance members have processes in place to manage rail occupations appropriately and have managed them well. However, more than half of the planned occupations are yet to occur.
Planning for major occupations commences at least six months before the proposed occupation because contractors usually work 24 hours a day, seven days a week during the occupation.
As at July 2017, only three of the 48 completed major occupations were late. Two of these delays were less than one hour, and the third was one day late. This is a good result and evidence of sound occupation planning and project management during the occupations.
Intended benefits
As completion of the LXRP is not due until 2022, there is insufficient data at present to make an informed judgement on how well the program is achieving intended outcomes.
DEDJTR has developed a benefits management framework in accordance with Department of Treasury and Finance (DTF) requirements. This includes development of an investment logic map, benefit map and benefit management plan. However, current monitoring and reporting of outcomes is not meaningful due to the lack of comprehensive key performance indicators (KPI) and targets.
Key performance indicators and targets
KPI targets specified in the benefit management plan only require performance improvement without defining what constitutes the improvement. Examples of such targets are, '100 per cent of sites with road based public transport will have improved punctuality' or '100 per cent of sites will improve access to jobs, education, and services'. LXRA advised that this is deliberate because factors other than the crossing removal can affect outcomes. Given this, the KPIs themselves are unlikely to be suitable measures.
At March 2017, LXRA had prepared four individual draft benefit reports for the removed level crossings. These reports do not provide meaningful information about the extent of improvement and whether the progress results are in line with expectations.
Value capture
LXRA has developed a comprehensive plan aimed at maximising value capture opportunities through the LXRP. For the LXRP, value capture is limited to IDOs—surplus railway land from a grade separation that can be sold to the private sector to develop. IDOs can include broader social benefits, such as social housing, community services and open spaces.
LXRA developed an IDO strategy in December 2015, providing guidance on identifying IDOs and their potential benefits and how these benefits can be realised.
LXRA's ongoing monitoring of identified IDO projects is timely and comprehensive. Monthly IDO dashboard reports provide a comprehensive summary of the status of each level crossing site against project milestones.
Network integrity
One of PTV's key functions, since September 2016, is to ensure the integrity of the public transport network, to make sure it is functionally effective, reliable, maintainable, secure, safe and environmentally compatible. As part of this role, PTV is responsible for establishing:
- network technical requirements—high-level technical requirements for a transport corridor or geographic area
- network technical standards—derived from network technical requirements to inform and direct the development of system requirements and specifications, and accredited rail operators (ARO) engineering standards.
PTV does not have adequate resources to be effective in its network integrity role. This has had undesirable cost and scope consequences for the integration of the LXRP and other concurrent rail projects into the rail network. PTV, with support from TfV—which is now responsible for strategic future transport planning—will need to ensure that actions to address this shortcoming are effective.
Application of standards to the LXRP
LXRA sets project system requirements that contractors delivering the LXRP must comply with. These requirements translate PTV and Metro Trains Melbourne (MTM) requirements, as well as other standards and specifications. However, during the translation process, there is scope for variations which can, in turn, have cost implications for projects. For example, approval to not comply or partially comply may reduce project costs and time lines. MTM manages the approval processes for changes to MTM engineering standards and their interpretation using a standard waiver or design practice note.
However, as MTM has limited insight into network-level requirements and planned developments, there is a risk that these decisions can impact other or future transport projects. Furthermore, as MTM is also a member of all of the LXRP alliances, a perceived conflict of interest exists—MTM is both part of the project development team applying for a standard waiver and part of the organisation making decisions on variation requests.
Controls for network integrity risks
PTV has established a number of arrangements to improve oversight of and accountability over its network integrity function. These include a network integrity governance framework and a formalised standards governance process in the new agreement with MTM, beginning 30 November 2017.
PTV's additional controls to improve its network integrity function are happening in parallel with the delivery of a number of important transport projects. It is important for PTV and TfV to closely monitor the effectiveness of these new arrangements, particularly for programs such as the LXRP which is well underway.
Recommendations
We recommend that the Department of Economic Development, Jobs, Transport and Resources:
1. follow High Value High Risk guidelines in developing a business case as the basis for government's investment decisions, including timing of approval, presenting a range of project options and updating the business case with any significant changes (see Section 2.2)
2. in conjunction with the Level Crossing Removal Authority, develop a transparent selection and prioritisation process for targeted removal of level crossings beyond current commitments made by government (see Sections 2.2 and 2.5)
3. develop comprehensive key performance indicators and targets to meaningfully measure achievement of intended benefits (see Section 4.2)
4. in conjunction with the Level Crossing Removal Authority, progressively monitor the progress of achievement of Level Crossing Removal Program outcomes to facilitate timely insight into how the program is progressing towards benefits realisation (see Section 4.2)
5. in conjunction with Public Transport Victoria, develop contemporary network rail standards, so that agencies delivering rail projects have an understanding of network requirements and what is required to assure projects meet engineering, network integration and safety requirements (see Section 5.2)
6. in conjunction with Public Transport Victoria, monitor the effectiveness of Public Transport Victoria's controls to improve its network integrity function (see Section 5.2).
We recommend that the Level Crossing Removal Authority:
7. apply options assessments transparently and consistently (see Section 2.3)
8. commission an independent evaluation and report on whether the deferred pricing contract structure is cost-effective and has delivered its intended benefits (see Section 3.3)
9. embed its benchmarking tool into the procurement process before using it to award additional works sites (see Section 3.4)
10. in conjunction with Transport for Victoria, evaluate its packaging approach and incorporate lessons learned into future level crossing removals (see Section 3.5).
Responses to recommendations
We have consulted with DEDJTR, PTV, VicRoads and VicTrack, and we considered their views when reaching our audit conclusions. As required by section 16(3) of the Audit Act 1994, we gave a draft copy of this report to those agencies and asked for their submissions or comments. We also provided a copy of the report to the Department of Premier and Cabinet (DPC).
The following is a summary of those responses. The full responses are included in Appendix A.
DEDJTR accepted the recommendations, noting its intention to improve the delivery of the balance of the LXRP, and provided an action plan to address them.
PTV accepted the recommendations and provided an action plan on how it will implement them.
Although there were no recommendations directed toward VicRoads and VicTrack, both agencies provided a response. VicTrack advised it will continue its collaboration with LXRA and other agencies as required.
1 Audit context
1.1 Background
Melbourne has an extensive transport network, which includes rail, roads, cycle paths and footpaths. The challenge is to ensure these components work together as an integrated transport system so that people and goods can move efficiently in and around Melbourne.
Melbourne is facing unprecedented population growth. In the next 30 years, Victoria's population is expected to increase by up to 60 per cent to 9.5 million. As the population grows, travel demands also increase, with public transport use growing at a faster rate than the population. Plan Melbourne 2014 indicates that, by 2050, Melbourne's road and rail network will need to accommodate an additional 10.7 million daily trips, on top of the 14.2 million daily trips recorded in 2014.
Managing increasing demand on road and rail infrastructure is a key task for government, and central to maintaining Melbourne's liveability.
Level crossing removals in Melbourne
A level crossing—also known as a grade crossing—is an intersection where a railway line crosses a road or path at the same level, as opposed to crossing over or under using a bridge or tunnel.
Separating the level of the road and rail is a grade separation. Grade separations can enhance road and rail network performance through the removal of the conflict at a crossing, improved station design, improved station access, and the integration of stations into the surrounding area.
Reasons for removing level crossings
Governments remove level crossings for a range of reasons, including to facilitate an increase in the frequency of train services, to extend rail lines through developed areas or to improve safety and traffic flow. In the past, some of these removals were part of a larger project—for example, the grade separations in the extension of the Hurstbridge-South Morang lines—however, most were done on an ad hoc basis.
|
The rail corridor is the land on which the railway is built. It comprises all property typically bounded from fence line to fence line or, if not fenced, everywhere 15 metres either side of the outermost parts of the track, unless otherwise indicated. |
Between 2005 and 2015, there were more than 149 collisions between a train and a vehicle or pedestrian along a rail corridor across metropolitan Melbourne—including the 178 level crossings on the electrified rail network. Of these, 38 resulted in fatalities and 22 in serious injuries. Boom gate closure times and traffic volumes across sites vary significantly and, in some locations, extended boom gate closures can contribute to road traffic congestion.
Large number of crossings in metropolitan Melbourne
The number of road level crossings remaining on Melbourne's metropolitan electrified train network is high compared to other Australian cities—see Figure 1A.
Figure 1A
National comparison of metropolitan rail level crossings
|
City |
Number of level crossings at September 2017 |
|---|---|
|
Adelaide |
84 |
|
Brisbane |
47 |
|
Melbourne |
178(a) |
|
Perth |
29 |
|
Sydney |
3 |
(a) Figure for Melbourne is prior to the LXRP.
Note: Canberra, Darwin and Hobart do not have metropolitan train services.
Source: VAGO.
A level crossing removal program managed by VicRoads, Metro Level Crossing Blitz, commenced under the previous government in 2011, with business cases finalised in 2013 and 2014.
The current government announced a level crossing removal program while still in opposition. This program formed part of its Project 10 000 election commitment which identified 40 level crossings for removal. Ten further crossings were added before the election.
These crossings formed part of the 2015–22 LXRP. In 2015, LXRA was established and took over responsibility for managing the program from VicRoads.
1.2 Options for level crossing removals
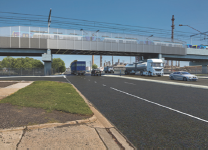
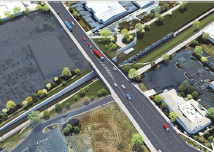
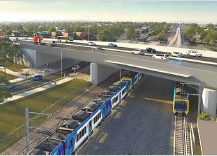
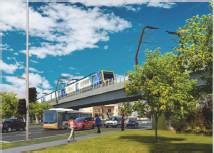
There are four main types of road-rail grade separations—see Figure 1B.
Figure 1B
Main types of road-rail grade separations
|
Rail over road—the road remains at its existing level and a rail bridge is built over it. Modifications to train stations may be required, at least to the platform levels, to suit the new rail level. Elevating the rail line provides opportunities for increased connectivity across the rail corridor. |
|
Rail under road—the rail line is lowered to go beneath the existing road. A bridge is built to maintain the road at its existing level. Where there are nearby train stations, these need to be modified or rebuilt to suit the new rail level. Additional pedestrian or cycling bridges may be used to improve access across the lowered railway. |
|
Road over rail—the rail line remains at its existing level and a road bridge is constructed over it. Local road and pedestrian accessibility is maintained with local service roads or by providing alternative access. This does not generally require any modifications to rail platforms because the level of the rail does not change. Where there are nearby train stations, access to them needs to be maintained. |
|
Road under rail—the road is lowered to go beneath the rail line. A rail bridge is built to allow the rail to remain at its existing level. Local road and pedestrian accessibility is maintained with local service roads or by providing alternative access. Where there are nearby train stations, access to them needs to be maintained. |
Source: VAGO, based on information provided by LXRA. Photographs courtesy of LXRA.
Other options for grade separations include:
- hybrid options—involve raising or lowering both road and rail instead of only one
- closure—closing the level crossing. This option provides no new alternative crossing of the rail corridor and road traffic must find an alternate route.
1.3 Level Crossing Removal Program
The LXRP is one of the Victorian Government's key transport infrastructure projects. Its stated aim is to remove 50 of the most dangerous and congested level crossings by 2022. In May 2015, as part of the Budget, government announced an interim target of 20 removals by 2018.
Since LXRP's announcement, the LXRA has identified two additional level crossings for removal, bringing the total to 52—see Appendix B for a full list. Figure 1C shows the location of these crossings.
Figure 1C
Locations of the level crossings to be removed under the LXRP
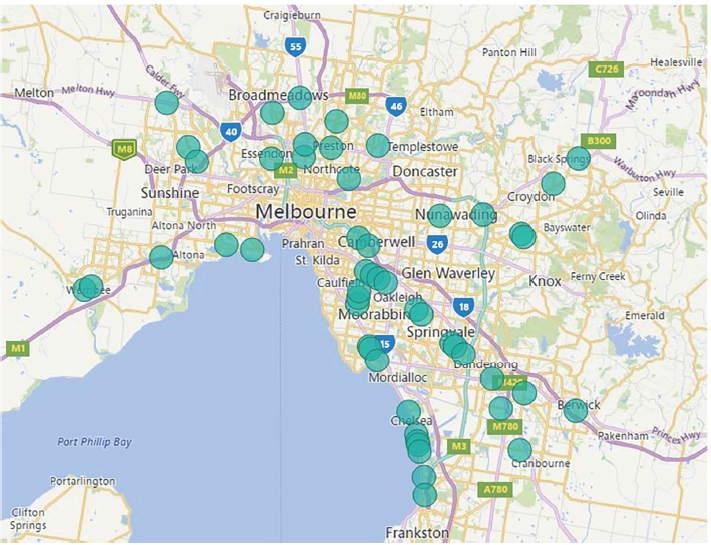
Source: VAGO, based on information provided by LXRA.
The stated benefits of the LXRP are diverse. They include to deliver significant safety improvements for drivers and pedestrians, improve travel around Melbourne and enable more trains to run more often and on time.
Level crossing removal packages
Level crossings will be removed along most Metropolitan train lines. The Cranbourne-Pakenham line will have the most removals, however, these will only amount to 52 per cent of the level crossings on that line—see Figure 1D.
Figure 1D
Level crossing removal by metropolitan train line
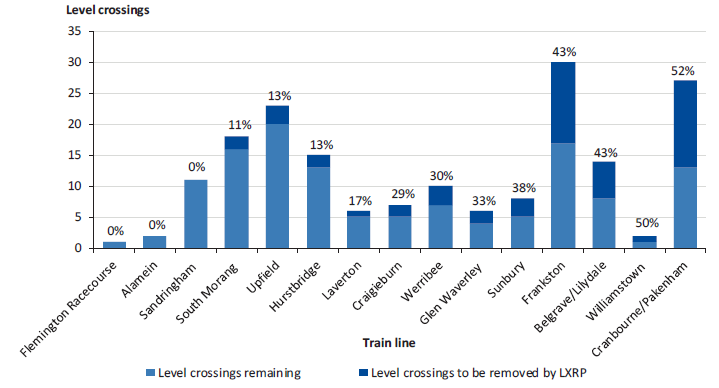
Source: VAGO, based on information provided by LXRA.
Individual level crossing removal sites are grouped into delivery packages—see Figure 1E.
Figure 1E
Level crossing removal packages
|
Package |
Level crossings included |
|---|---|
|
Package 1 |
North Road, Ormond; McKinnon Road, McKinnon; Centre Road, Bentleigh; Burke Road, Glen Iris |
|
Package 2 |
Main Road and Furlong Road, St Albans; Blackburn Road, Blackburn; Heatherdale Road, Mitcham |
|
Package 3 (CTD) |
Grange Road and Koornang Road, Carnegie; Murrumbeena Road, Murrumbeena; Poath Road, Hughesdale; Clayton Road and Centre Road, Clayton; Corrigan Road, Heatherton Road and Chandler Road, Noble Park |
|
Package 4 |
Scoresby Road and Mountain Highway, Bayswater |
|
Melton Highway |
Melton Highway, Sydenham |
|
Thompsons Road |
Thompsons Road, Lyndhurst |
|
North Eastern Package |
Lower Plenty Road, Rosanna; Grange Road, Alphington; Bell Street, Preston; High Street, Reservoir |
|
North Western Package |
Bell Street, Coburg; Buckley Street, Essendon; Camp Road, Campbellfield; Glenroy Road, Glenroy; Moreland Road, Brunswick; Skye Road, Frankston |
|
Western Package |
Abbotts Road, Dandenong South; Aviation Road, Laverton; Cherry Street and Werribee Street, Werribee; Ferguson Street, Williamstown; Kororoit Creek Road, Williamstown North |
|
Southern Package |
Balcombe Road, Mentone; Charman Road and Park Road, Cheltenham; Edithvale Road, Edithvale; Eel Race Road and Station Street, Carrum; Seaford Road, Seaford; Bondi Road and Mascot Avenue, Bonbeach |
|
Unallocated level crossings |
Clyde Road, Berwick; Hallam Road, Hallam; Manchester Road, Mooroolbark; Maroondah Highway, Lilydale; South Gippsland Highway, Dandenong; Toorak Road, Kooyong |
Source: VAGO, based on information provided by LXRA.
Each package has its own governance arrangements that include:
- a project director
- a project team, consisting of senior project managers, project managers, senior project/design engineers, and project control/support officers.
The project director reports to the LXRA Chief Operating Officer, who reports to the Chief Executive Officer.
The project teams are supported by functional teams that include communications and stakeholder relations staff, safety staff, cost controllers and commercial managers.
1.4 Status of the Level Crossing Removal Program
VicRoads had commenced work on the procurement and construction of 10 level crossing removals prior to the establishment of LXRA. The LXRP incorporated these crossings. The status of those crossings was:
- four sites had already completed full business cases—Blackburn Road, Main Road, Burke Road and North Road
- four sites had prepared project proposals—McKinnon Road, Centre Road (Bentleigh), Furlong Road and Heatherdale Road
- two sites had completed preliminary planning and a business case—Mountain Highway and Scoresby Road.
All 52 level crossings are planned to be removed by 2022. While an interim target of removing 20 crossings by 2018 was set in 2015, LXRA is now intending to complete up to 28 by 2018. The 2017–18 State Budget brought forward additional funding to achieve this outcome.
By September 2017, LXRA had removed 10 crossings, with another 16 in the design and construction stage—see Figure 1F.
Figure 1F
LXRP status as at September 2017
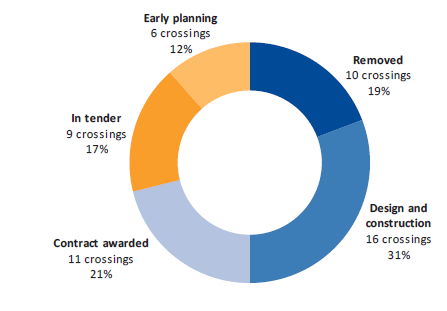
Note: 'Contract awarded' includes additional works packages.
Source: VAGO, based on information on LXRA's website.
1.5 Integration with other transport projects
Some level crossing removals are part of the government's program of major rail network upgrades. This includes the removal of nine level crossings on the Caulfield-Dandenong corridor and three level crossings on the Sunbury corridor to allow for the rail service increases planned as part of the CPLU and MTP.
Coordination between the LXRP and other major transport projects is important for the development of Melbourne's future transport network.
1.6 Governance framework
Project governance is about guiding and monitoring the delivery of intended benefits and outcomes. The DTF project governance guidelines state that there are four key principles for effective project governance:
- establish a single point of overall accountability
- service delivery ownership determines project ownership
- project decision-making is separate to stakeholder management
- distinction between project governance and organisational structures.
HVHR investments require greater scrutiny and support from central agencies.
Major transport infrastructure program
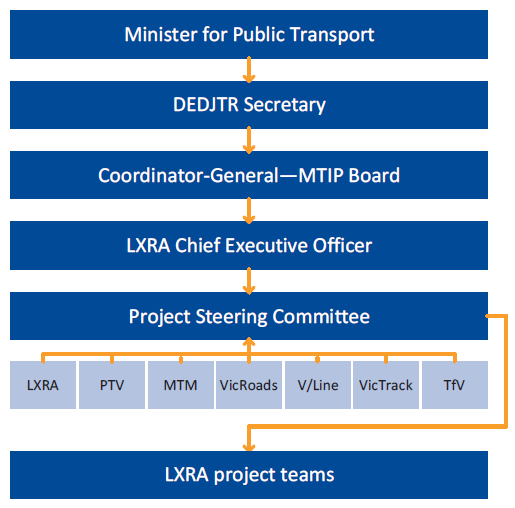
The LXRP is part of DEDJTR's Major Transport Infrastructure Program (MTIP) governance framework. Figure 1G outlines this framework.
As government has approved key decisions for the LXRP (including the scope, budget and procurement approach), the governance focus is now on project delivery.
Ultimately, the government is required to approve the LXRP business case, project proposals or works packages, and funding for project delivery.
Figure 1G
Governance for the MTIP
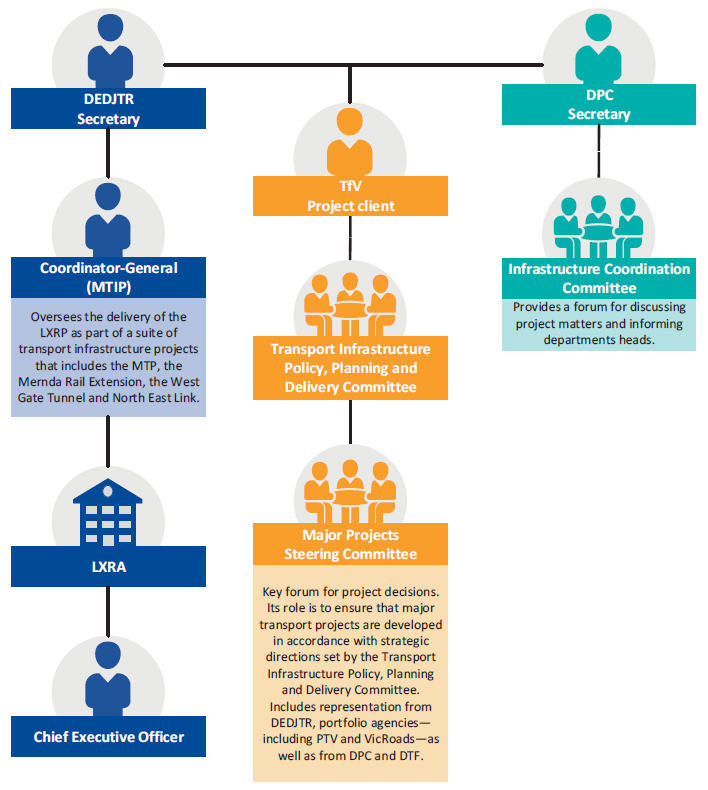
Source: VAGO, based on information provided by LXRA.
Project delivery
Figure 1H shows the framework for the delivery stage of the LXRP.
Figure 1H
LXRP project delivery governance framework
Source: VAGO, based on information provided by TfV.
The Major Transport Infrastructure Board advises the Coordinator-General of the MTIP on the delivery of the program. It includes independent members, industry experts and the Coordinator-General. LXRA reports monthly to the MTIP Board on the progress of the LXRP, including delivery, safety and finance issues, and key risks.
LXRA established a Project Steering Committee to:
- oversee the progress and implementation of the LXRP
- consider operational impacts on the rail and road network and franchise arrangements
- approve plans for level crossing site occupations
- endorse the scope and technical requirements for the project, including agreeing on standards and requirements
- discuss, but not determine, any change to the project scope or time lines
- ensure that objectives and key deliverables are met
- ensure that all stakeholders are kept informed about the progress and status
- resolve disputes arising between the parties
- note monthly reports provided by LXRA, PTV or MTM.
LXRA's Chief Operating Officer chairs the Project Steering Committee which comprises senior representation from PTV, VicRoads, V/Line, VicTrack, MTM and TfV.
Governance prior to LXRA
DEDJTR, PTV and VicRoads were accountable for the finalisation of the project development stage, including the business cases and project proposals prior to LXRA. This audit does not focus on the project prior to LXRA's establishment.
1.7 Agency roles
Level Crossing Removal Authority
The government established LXRA in March 2015 as an administrative office within DEDJTR to manage the delivery of the LXRP, the Mernda Rail Extension and any other project as required. As stated in the LXRP business case, LXRA will oversee the LXRP's implementation and delivery of expected benefits.
Department of Economic Development, Jobs, Transport and Resources
DEDJTR is responsible for the integration of transport projects into the overall transport network. The Coordinator-General sits within DEDJTR and has responsibility for overseeing the MTIP.
The Coordinator-General provides strategic advice on progress towards achieving the intended project benefits to the Premier, the Minister for Public Transport and the Minister for Roads and Road Safety, as well as the Secretary of DEDJTR and the Head of TfV. The Coordinator-General also provides assurance regarding the planning, procurement and delivery of the projects.
Transport for Victoria
Formally established in April 2017, TfV is the state's lead transport agency. TfV's objective is to bring together the planning and coordination of Victoria's transport system and agencies, including VicRoads and PTV, and to integrate Victoria's transport system to connect people, places and opportunities.
VicRoads
VicRoads' purpose is to deliver social, economic and environmental benefits to communities throughout Victoria by managing the state's arterial road network and its use as an integral part of the overall transport system.
Public Transport Victoria
PTV was established in April 2012. In September 2016, PTV received a ministerial direction to undertake a network integrity and assurance role, to ensure:
- the public transport network remains functionally effective, reliable, maintainable, secure, safe and environmentally compatible as it evolves through future investment
- capital programs are aligned to network requirements and standards
- the readiness of the operating environment to implement investments into the transport network.
Prior to the establishment of TfV, PTV was also responsible for detailed public transport network and service planning.
VicTrack
Created in 1997, VicTrack is a state-owned business operating under the Transport Integration Act 2010. It owns Victoria's railway land, infrastructure and assets. Through a subsidiary—the Rolling Stock Holdings group of companies—it also owns much of the state's rolling stock (trains and trams). VicTrack leases train and tram infrastructure and assets to PTV, which then sub‑leases the infrastructure and assets to the metropolitan train and tram operators and V/Line. VicTrack also has a role in providing telecommunications services to operators.
1.8 Relevant legislation
The Transport Integration Act 2010 requires that all decisions affecting the transport system are made within the same decision-making framework, to support the provision of an integrated and sustainable transport system. The Act:
- encourages transport agencies to work together toward the common goal of an integrated and sustainable transport system
- makes it clear that the transport system needs to be sustainable economically, environmentally and socially
- provides a framework for integrated transport policy and operations
- recognises that the transport system should be thought of as a single system performing multiple tasks rather than separate or competing transport modes
- integrates land use and transport planning and decision-making by extending the policy framework to land use agencies which significantly impact the transport system
- establishes transport bodies with consistent charters to deliver outcomes aligned to the overall vision and objectives of the Act.
1.9 Why this audit is important
The LXRP faces a number of challenges including its large scale, engineering complexity, short delivery time frame and budget pressures. Elements of the project have attracted criticism, particularly grade separation options.
The LXRP is designed to contribute to longer-term improvements to the road and rail network by easing transport congestion and delivering a safer and more efficient road network. This audit, at this point in time, serves to identify the risks, lessons and opportunities for improvement for future works.
1.10 What this audit examined and how
This audit examined whether the LXRP has been cost-effective in improving, or potentially improving, the safety and efficiency of the state's road and rail network. Our audit focused on DEDJTR's role, LXRA's role in program delivery and benefits monitoring, and TfV's role in providing oversight and strategic focus for the LXRP.
Other agencies in the scope of this audit are PTV, VicRoads and VicTrack.
The audit methods included:
- interviews with agency and departmental staff, and site visits
- review of strategies, program delivery documents, business case, and Cabinet material
- analysis of datasets relating to road and level crossing safety, traffic congestion and rail services.
We conducted this audit in accordance with section 15 of the Audit Act 1994 and the Australian Auditing and Assurance Standards. The cost of the audit was $530 000.
1.11 Report structure
The rest of this report is structured as follows:
- Part 2 examines the basis for program investment and decision-making
- Part 3 analyses program procurement, packaging and sequencing of works
- Part 4 looks at the intended program benefits
- Part 5 examines network integration and integrity.
2 Level crossing selection and cost
A comprehensive business case is important for large investments and should be prepared prior to making an investment decision. It provides confidence to decision-makers that the:
- strategic justification for the investment is valid
- right investment option is selected
- government can deliver the investment as planned.
DTF's HVHR guidance states that the business case should consider the whole investment life cycle and that its role changes from one stage to another. In later stages, government uses it to ensure that it is delivering the investment as planned. If there are any changes, agencies should update the business case and assess the ongoing business justification in light of the new details.
The LXRP business case was completed prior to the addition of the two extra crossings, and covers only 50.
2.1 Conclusion
Weaknesses in the LXRP business case undermine its value and ability to provide a sound basis for the government's decision to commit to the investment. The government's election commitment was the basis for the selection of sites for the LXRP.
Not all of the selected level crossings are among the 50 most dangerous and congested. However, post-election advice to government did not test the validity of the selected sites against other site options.
2.2 Site prioritisation and selection
The government has consistently stated that the main objective of the LXRP is to remove 50 of the most dangerous and congested level crossings. This is not consistent with the LXRP business case, as it omits the word 'most'.
As the sites identified for removal were part of an election commitment, DEDJTR decided not to assess the merits of their selection. As a result, there is no analysis or rationale in the business case or other documentation about why the 50 level crossings selected were given priority.
The role of the public service to provide full and frank advice was not realised in this case. DEDJTR should have advised the incoming government that an analysis was needed of the selected sites against the stated program objective of removing 50 of the most dangerous and congested level crossings. A 2015 DTF gateway review of the business case identified these issues.
There was a range of guidance, summarised in Figure 2A, available to inform the prioritisation of level crossings for removal. DEDJTR could have used this to validate or test the merits of the sites chosen.
In the absence of program-specific analysis, aligning site-specific conditions to criteria linked to the expected benefits of the LXRP, government cannot be assured that its investment in the removal of 50 level crossings is targeted appropriately.
Figure 2A
Guidance for prioritising level crossing removals
|
Australian Level Crossing Assessment Model (ALCAM) |
|---|
|
ALCAM is a tool for identifying key potential risks or deficiencies at level crossings and for prioritising crossings for upgrades. It has three components:
When combined, these three components produce a unique risk score for each level crossing. Level crossing surveys are used to update the risk profiles for each crossing. A survey of level crossings occurs approximately every five years. A Victorian list was last publicly released in 2008, by the then Department of Transport. |
|
VicRoads strategic framework |
|
VicRoads created a strategic framework to provide guidance on the prioritisation of level crossings for removal in metropolitan Melbourne. Completed in June 2014, the framework used 2013 data and was publicly available in October 2015. VicRoads assessed each level crossing against the following weighted criteria to determine priority:
The framework rated crossings as either high, medium, lower or no priority. VicRoads developed two priority lists of level crossing sites for removal—a 2013 priority list and a 2022 forecast priority list. |
|
Royal Automobile Club of Victoria (RACV) prioritisation list |
|
In February 2013, the RACV published a priority list of 31 level crossings for removal. Project 10 000 cites the RACV prioritisation list as a source for the government's removal program. |
Source: VAGO.
Our analysis of the 50 LXRP sites in the business case compared to the publicly available ALCAM list for 2008 shows around 62 per cent of the LXRP crossings (31 sites) are in the top 50 metropolitan crossings on this list—see Figure 2B. Appendix C contains the ALCAM 2008 list excluding crossings removed before LXRP.
Figure 2B
LXRP crossings compared to ALCAM 2008 list
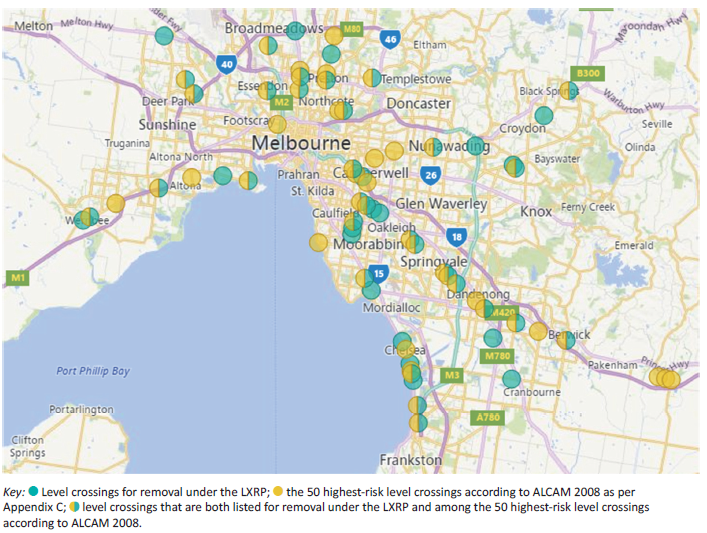
Note: This map shows only the original 50 sites of the LXRP.
Source: VAGO.
Our analysis shows that LXRP will remove 16 of the 20 crossings (80 per cent) that VicRoads rated as high priority in its 2013 list, and five of the nine crossings (56 per cent) rated medium priority—see Figure 2C. However, VicRoads rated 29 crossings in the LXRP lower or no priority—see Appendix D.
Figure 2C
LXRP crossings compared to VicRoads 2013 list
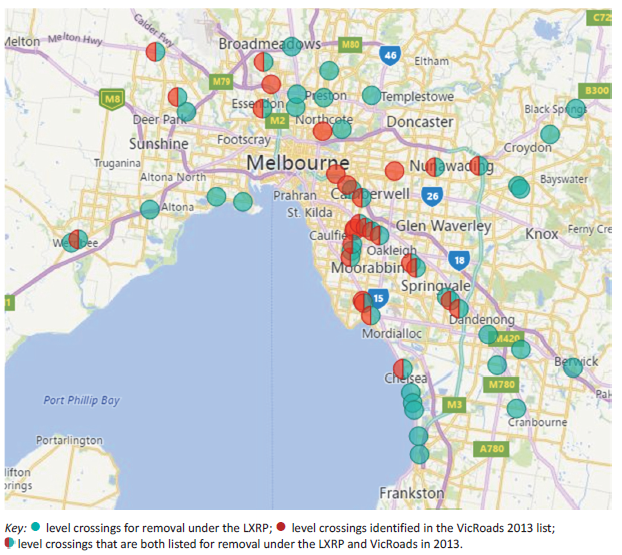
Note: This map shows only the original 50 sites of the LXRP.
Source: VAGO.
Some of the sites in the LXRP are not highly ranked on either the VicRoads or ALCAM lists. For example, VicRoads rated the following sites as no priority and they also received relatively low priority on the full ALCAM 2008 list:
- Camp Road, Campbellfield (ALCAM rank 144)
- Kororoit Creek Road, Williamstown North (ALCAM rank 139)
- Abbotts Road, Dandenong South (ALCAM rank 132)
- Manchester Road, Mooroolbark (ALCAM rank 130).
In contrast, the following sites are not included in the LXRP, despite being high priority on the VicRoads list, with one site in the top 50 of the ALCAM list:
- Union Road, Surrey Hills (ALCAM rank 13)
- Glenferrie Road, Kooyong (ALCAM rank 67)
- Glen Huntly Road, Glen Huntly (ALCAM rank 71)
- Madden Grove, Burnley (ALCAM rank 72).
This shows that the LXRP is not meeting its stated objective of removing 50 of the most dangerous crossings in Melbourne.
2.3 Options assessment
Options assessment is used to identify the most appropriate grade separation option for each site. LXRA and VicRoads completed options assessments for 20 crossings before the business case was completed. LXRA's options assessments for the remaining 30 crossings, developed as part of the business case, differ in approach and level of detail to the first 20.
The remainder of Section 2.3 focuses on options assessments for the remaining 30 sites.
Options assessment framework
DEDJTR developed a framework to assess and shortlist grade separation options at each of the 30 sites. Application of this framework aims to ensure that the chosen options are cost‐effective and defensible, and the process is comprehensive, transparent and consistent. The framework is detailed in Figure 2D.
Figure 2D
Options assessment framework
| Stage | Assessment phase | Description |
|---|---|---|
|
Business case |
Initial feasibility assessment |
Identifies options that are not technically feasible to implement. This results in a shorter list of options for assessment in the next phase. |
|
Rapid assessment |
Identifies options for further development—around four to five. It is a qualitative assessment of the performance of options against the project objectives and outcomes. |
|
|
Detailed assessment |
A detailed evaluation of the performance and impacts of the remaining options, to identify between one and three options to take forward to the next phase. |
|
|
Project/works package proposals |
Final assessment |
A further detailed assessment of the remaining options using more developed design documentation to inform the scope of the recommended reference solution. |
|
Procurement |
Market-based assessment |
An assessment of proposals put forward by bidders during the procurement stage to ensure that the proposed solution still meets project objectives. |
Source: VAGO, based on information provided by LXRA.
The options assessment framework includes a multi-criteria analysis tool to select reference options for inclusion in the business case and the preferred solution to present to government. As LXRA completes further technical investigation and consultation for each site, it reapplies the tool using the updated information.
LXRA does not directly assess primary criteria. It rates an option's performance as either strong, average or poor against each secondary criterion. While there is guidance on what constitutes strong, average or poor performance, the criteria are not weighted. This means that there is no indication of the relative importance of each criterion.
Changes to the multi-criteria analysis tool
Under the options assessment framework—see Figure 2D—LXRA should reapply the multi-criteria analysis tool to options once it has gathered more detailed site information. In the final assessment phase for sites in the Southern package, LXRA used a different set of criteria.
Figure 2E lists the criteria applied to the Southern sites and those applied to all other sites to date.
LXRA advised that it did this to accommodate additional information gathered about the Southern package sites through more detailed analysis and community consultation. However, the existing option assessment framework is designed to incorporate additional information as site investigation proceeds.
Figure 2E
Assessment criteria
|
Southern sites |
All other sites (business case) |
|||
|---|---|---|---|---|
|
Category |
Secondary criteria |
|
Primary criteria |
Secondary criteria |
|
Adjacent properties |
Property acquisition Voluntary Purchase Scheme Permanent land use changes Noise Visual impact/views Overshadowing Overlooking |
|
Alignment with program benefits |
More reliable and efficient transport networks Better connected, liveable communities Safer communities |
|
Community and stakeholders |
Cross-corridor connectivity Shared user paths Linear/parks/landscaping IDOs |
Project outcomes |
Capital cost Whole-of-life costValue-capture opportunities Time frame Delivery risks Protection of future assets |
|
|
Environment and sustainability |
Environment impact Heritage impact Flooding risk Contaminated soil |
|
Project impacts |
Land acquisition impacts Land use impacts Environment impacts Temporary impacts |
|
Construction impact |
Utility service impact Rail closures Road closures Station closures Car park closures Delivery risk |
|||
|
Cost |
Capital cost |
|
|
|
Source: VAGO, based on information provided by LXRA.
There are important differences between the two sets of criteria. In particular, the Southern sites' criteria place more emphasis on adjacent properties and do not consider whole-of-life cost. LXRA's assessment using the modified criteria produced similar results to the original assessments in this instance. However, the decision to change the criteria indicates that LXRA has not consistently or transparently applied the options assessment framework.
Approval of options
LXRA refers all preferred options to the Minister for Public Transport (the Minister) for approval. The Minister may approve the option or, where it is likely to be contentious with key stakeholders, refer the site to government for endorsement.
How LXRA identifies sites as contentious is not clear. LXRA advises that the decision to refer a site to Cabinet is determined by the Minister. LXRA does not document this decision.
Community consultation during options assessment
LXRA's community consultation during the options assessment process differs between packages. LXRA relied on the market to create innovative design solutions in one of the largest packages of works—CTD. The community consultation for this site happened concurrently with the tender process. This limited the role that community views could play in the options assessment process, as shown in the case study in Figure 2F.
Figure 2F
Case study: Consultation for the CTD package
|
Community consultation for the CTD package occurred at the same time as the tender process. LXRA advised that, as a result, probity and commercial confidentiality requirements limited the information that it was able to share with the public. LXRA started raising public awareness of the project in May 2015 and gathered initial community input on design in July 2015. At the same time, it released the request for proposal to two shortlisted parties. During the request for proposal period, LXRA's community consultation efforts included briefings, workshops and feedback sessions aimed at allowing community members to view design concepts. It also included a Community Tender Advisory Panel that consisted of representatives from the community and stakeholder groups. The panel served as a proxy for wider community consultation by giving feedback on design solutions at key points during the tender process. As the request for proposal was occurring concurrently, the panel was bound by confidentiality provisions. LXRA advised that this panel allowed it to gather community feedback on the design without breaching confidentiality and probity arrangements. In February 2016, LXRA announced a preferred party and the preferred design solution. Throughout February and March 2016, LXRA sought community feedback about the preferred rail-over-road solution. The feedback indicated that there was significant opposition from adjacent residents and traders due to concerns over amenity and noise. In advice to government, LXRA defended the rail-over-road solution as performing substantially better than other options. It also cautioned that a complete redesign prior to awarding the contract could have serious probity and legal implications, resulting in a need to re-tender the project. LXRA introduced a range of measures to mitigate the impact of elevated rail on the community, including open spaces, landscaping and a voluntary purchase scheme for properties abutting the corridor. The combined cost of these measures was $49.6 million(a). |
(a) Voluntary purchase scheme accounts for $17.26 million of $49.6 million.
Source: VAGO, based on information provided by LXRA.
In contrast, Figure 2G provides an example of LXRA integrating community consultation into the options assessment process.
Figure 2G
Case study: Southern package consultation time line
|
Community consultation for sites on the Frankston line commenced well before procurement for the package in January 2017. In September and October 2016, LXRA sought feedback from the community on possible design solutions for the sites. The consultation findings showed community opposition to rail-over-road solutions. In December 2016, LXRA presented these findings to government, along with a detailed options analysis for each site. Although LXRA's options analysis showed that rail-over-road solutions generally performed better, government elected to change five sites to rail under road. LXRA advised that as it had not yet released tender documentation, there were no probity or legal concerns about changing design solutions. |
Source: VAGO, based on information provided by LXRA.
These examples demonstrate that the timing of consultation has a big impact on the role community views can play in options assessment. LXRA used the lessons learned from CTD, and applied them to the Southern package. By consulting with the community on design options prior to commencing procurement for the Southern package, LXRA was able to better understand and integrate community views into its advice to government and options assessment process.
Cost estimates for reference options
As part of the detailed assessment phase of the options assessment framework, LXRA produced cost estimates for each shortlisted grade separation option. The LXRP business case, however, does not present this range of cost estimates for grade separation options.
Although LXRA completed cost estimates for one to four grade separation options, the business case only included the cost of one reference option.
These options represented a point‐in‐time view—for February 2016—of the estimated cost of how LXRA could deliver the program. The business case did not include the potential maximum and minimum costs of other options, as shown in Figure 2H.
Figure 2H
Comparative cost estimates for the remaining 30 sites
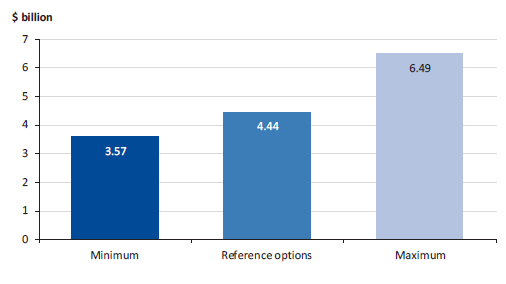
Note: Reference options cost does not include packaging savings.
Source: VAGO, based on information from LXRA project option reports.
As LXRA developed the reference options with limited stakeholder and community consultation, there was a significant risk that the proposed reference option could change and impact on program costs.
This risk has subsequently materialised. There have been multiple changes from reference options, resulting in increases to the total program cost.
Changes from reference options
LXRA is undertaking further investigation and public consultation at individual sites as the LXRP rolls out. As a result, LXRA is recommending different design solutions from the reference options—as shown in Figure 2I. LXRA submits proposed new solutions, together with additional funding requirements, to government for approval.
Figure 2I
Changes from reference options for the remaining 30 sites
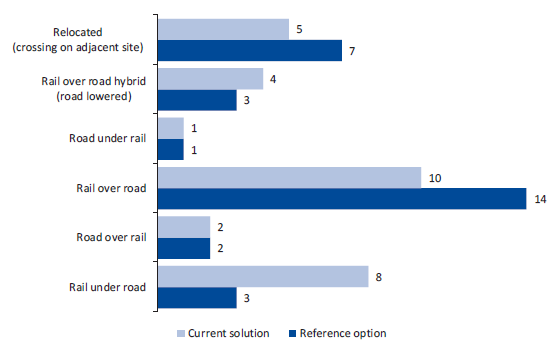
Note: Status at July 2017.
Source: VAGO, based on information provided by LXRA.
The most significant changes are the five additional rail-under-road solutions and four fewer rail-over-road solutions. Based on advice LXRA provided to government, changing a site from rail-over-road to a rail-under-road solution could increase the cost of that removal by an average of $18 million, and up to $100 million for more complex sites, such as those on the Frankston line.
2.4 Program cost
The business case did not adhere to the HVHR guidelines in a number of ways, including by:
- not providing cost estimates for more than one option per site—the HVHR guidelines expect project options to be thoroughly analysed in the business case, including expressing a cost range
- basing business case costings on a like‐for-like replacement of existing infrastructure
- not considering operational or maintenance costs, or other rail programs impacting the LXRP
- not updating the business case to reflect ongoing changes to program cost estimates—these changes include the addition of two level crossing removal sites and changes to preferred reference options.
The cumulative cost of the program has increased since the initial funding announcement in 2015, as shown in Figure 2J.
Figure 2J
LXRP cost
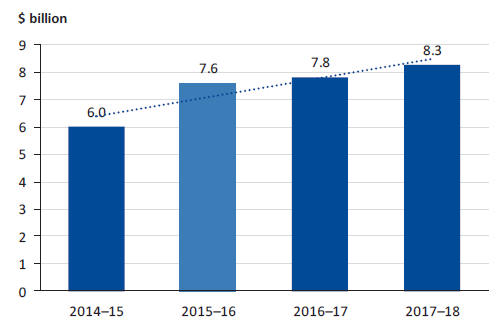
Note: The $6.0 billion in 2014–15 represents the $5–6 billion range quoted as part of government's election commitment.
Note: The $7.6 billion in 2015–16 represents the program cost identified in the business case.
Source: VAGO from information provided by LXRA.
|
LXRP associated network improvements are additional works delivered with level crossing removals, such as new train stations and improved public transport access. |
The business case provides a total program cost estimate of $7.6 billion—made up of $6.6 billion for level crossings and $1.0 billion in associated network improvements. An HVHR gateway review of this business case highlighted that the program cost in the business case is greater than the $5–6 billion election commitment.
The cost of the program as at July 2017 is $8.3 billion. This represents an increase of more than 38 per cent—based on the initial estimate of $5–6 billion.
The cost increase is mostly due to changes in the recommended options, particularly for the sites along the Frankston line.
Cost of works packages
The cost of packages is included in the total program cost. As at July 2017, the program's forecast final cost is $306.3 million over the approved individual work package budgets, excluding program risk. The majority of the budget overrun is from the CTD package—$302.9 million. This is due to a number of factors including the complexity of the construction method, poorer‑than‑expected site conditions and additional scope in response to stakeholder and community feedback.
Other costs
Futureproofing works
The business case provides for the construction of futureproofing works for 13 of the 16 crossings identified as requiring such works. These works include:
- increasing station platform length
- widening the rail corridor
- building wider road bridges.
LXRA will make provisions for the remaining three crossings—for example, by setting aside the required land—but will not construct the works as part of the current program.
The business case estimates the cost of futureproofing works at all 16 sites to be $148 million. This is less than 2 per cent of the $7.6 billion project cost identified in the business case. As LXRA does not track spend on futureproofing items, we are unable to confirm the additional costs of the works undertaken to date.
Power upgrades
Additional works such as upgrades to the traction power network or signal power at a number of crossings were not included in the business case. Figure 2K demonstrates the implications of changing network electrical standards.
Figure 2K
Case study: Implications of changing a network electrical standard
|
MTM and PTV have an agreed electrical network standard requiring a minimum 1 300 volts under normal conditions and 1 150 volts for first-order traction power failure conditions. The standard allows for changes to the service plan including the integration of HCMT rolling stock and proposed service level changes. The majority of the traction power network does not comply with the new standard. The LXRP business case is based on maintaining existing network capacity. LXRP provides for the removal and replacement of overhead systems and associated infrastructure only where the removal requires new track. New substations for future traction power requirements were specifically excluded from the business case cost estimates, as the LXRP is not a network upgrade project. |
Source: VAGO, based on information provided by LXRA.
MTM electrical standards—for traction power and signal power—have been in place since January 2015 and should have been considered when the business case was being developed. As the business case did not consider this electrical standard, unplanned scope and design changes have been necessary.
Cost–benefit analysis
Although a cost–benefit analysis (CBA) is the key metric for evaluating the quantitative economic merit of the program, government decided to fund the LXRP prior to the completion of the business case.
The LXRP's CBA conforms to the HVHR guidelines and applies the recommended discount rate of 7 per cent for this type of project. Sensitivity testing which includes the application of a 10 per cent discount rate was also completed.
|
The Victorian Integrated Transport Model is the state's main strategic transport model that predicts changes in overall transport demand and mode choice. |
In its appraisal, DEDJTR has quantified core benefits using an approach that primarily relies on the Victorian Integrated Transport Model. See Appendix E for a summary of the core quantifiable benefits in its program appraisal.
Benefit–cost ratio
BCR attempts to identify the relationship between the costs and benefits of a project. If a project's BCR is:
- greater than one, it indicates that project benefits outweigh the cost
- less than one, the project's costs outweigh the benefits.
Figure 2L provides a CBA summary for the three appraisal scenarios included in the business case.
Figure 2L
CBA summary
|
Scenario |
Benefits |
7 per cent discount rate (real) |
BCR |
|---|---|---|---|
|
LXRP (reference case) |
Core transport system benefits |
$4.7 billion |
0.78 |
|
LXRP (reference case including additional and wider economic benefits) |
Additional and wider economic benefits |
$0.7 billion |
0.9 |
|
Combined appraisal (LXRA, MTP and CPLU) |
Core transport system benefits |
$14 billion |
1.2 |
|
City-shaping benefits |
$3 billion |
||
|
Productivity benefits |
$4 billion |
Source: VAGO, based on information provided by LXRA.
As shown in Figure 2L, the LXRP reference case does not achieve a positive BCR using the standard discount rate of 7 per cent. If the BCR was updated to account for current program cost, assuming there are no further increases in benefits, this would result in a reduced BCR.
Further, sensitivity testing identifies that if costs increase by 20 per cent, this will result in a BCR of only 0.65 at this discount rate.
The cost at July 2017 stands at $8.3 billion, a 9 per cent increase on the $7.6 billion in the business case. Given the LXRP has only removed 10 crossings to date, with five years still remaining and more complex crossings to remove, there is a real risk of further cost increases.
A BCR of 0.9 is achieved when wider economic benefits are included with the reference case. However, DTF guidelines recommend excluding wider economic benefits from the BCR calculation while appraising projects.
A positive BCR is only achieved for the combined appraisal, which includes the total sum of benefits from all major rail projects—CPLU and the MTP—not just the LXRP.
DEDJTR's rationale for using this approach is that these projects are interdependent, and the CPLU and MTP assume delivery of the LXRP. Therefore, the projects were combined to look at the city-shaping benefits. This is a reasonable approach as these are not mutually exclusive projects.
DEDJTR engaged a third party to peer review the economic evaluation of the LXRP business case. A report was prepared which concluded that, overall, the approaches as described in the economic evaluation appear appropriate for the economic assessment of the LXRP.
2.5 Strategic planning for future prioritisation
TfV and LXRA should develop a robust selection and prioritisation process for future level crossing removals so that the rationale for selecting sites is transparent.
Infrastructure Victoria's 30-year infrastructure strategy recommends that the government develop a transparent prioritisation process within five years for the targeted removal of level crossings beyond its current commitments. It also recommends that this process should build on work already completed by VicRoads and consider desired land use outcomes, including supporting major employment centres.
Activity to date
TfV is leading a planning study to identify potential future level crossing removals as part of it network planning function. This study will:
- identify a list of initial priority sites for government to consider for early removal in conjunction with the current committed program
- provide program options for government to identify future level crossing removals.
The study will also consider the links to other planned network investments and how these may offer opportunities to package them with the level crossing removals.
Figure 2M shows the criteria TfV has developed to identify initial potential sites.
Figure 2M
Criteria for identifying initial sites
|
Adjacency |
The site is adjacent to, and affects, an existing LXRP site. |
|---|---|
|
Major need |
The site will have very significant impacts on congestion or safety, taking into consideration rail service increases that have been enabled by other projects that are being implemented. |
|
Efficiency opportunity |
There may be significant cost efficiencies that could be realised by delivering the level crossing removal in conjunction with an existing LXRP site. |
Source: VAGO, based on information provided by TfV.
Potential sites must satisfy the criteria in Figure 2M before moving to the program options assessment phase. TfV has also developed criteria for this phase as shown in Figure 2N.
Figure 2N
Criteria for identifying program options
|
Movement |
Amount of traffic (current and future), level crossing boom gate closure times, the type of movements and traffic using each crossing, train frequencies (current and future) and strategic network considerations. |
|---|---|
|
Safety |
Safety risk ratings (ALCAM) and incident records (fatalities, serious injuries, near misses). |
|
Place |
Activity areas, urban renewal and growth precincts, community services and facilities, station access, pedestrians, cyclists and emergency services. |
|
Deliverability |
Cost, risk and packaging (considering rail occupations, site adjacency, disruption and likely procurement efficiencies). |
Source: VAGO, based on information provided by TfV.
While initial planning demonstrates TfV is working towards developing criteria and a methodology to test sites, it is not evident if there will be a criteria weighting system so that site assessment is objective and transparent. Nor is it clear how TfV plans to determine which sites to test.
3 Procurement and delivery
Infrastructure project delivery should balance the control of project cost and risk against achieving objectives and outcomes. It also requires agencies to consider which delivery methods are available and best suited to achieve economic and efficient delivery.
3.1 Conclusion
The need for LXRA to meet the government's committed time frame for the LXRP has had an impact on procurement, packaging and sequencing. Although the use of partial price competition saves time, it removes competitive tension and, if not adequately managed, the LXRP is at risk of not maximising value for money. It is too early to tell if LXRA is successfully mitigating this risk because not all of its risk mitigation tools are fully developed.
LXRA has prioritised the removal of level crossings that had greater preparatory work completed and less complex design solutions. This has brought forward some removals, and LXRA now intends to exceed the target of 20 removals by 2018. The remaining crossings are more complex and potentially more challenging to complete within the allocated time frame and budget.
3.2 Delivery models
LXRP sites are grouped into packages for tender. Traditional design and construct contracts are being used to procure two sites and alliance contracts for all others.
Alliance contracting
The alliance contracting model involves a state agency (the owner) working collaboratively with private sector parties, or non-owner participants (NOP), to deliver a project. It requires parties to work together in good faith, act with integrity and make decisions that are best for the project as a collaborative team.
The key difference between a traditional contract model and an alliance contract model is the allocation of risk. In traditional contract arrangements, parties allocate risk to the party best able to deal with it. In contrast, parties to an alliance contract share responsibility for managing all project risks.
Alliance contracting is useful when a project has risks that owners cannot adequately define prior to commencement. The flexibility of the alliance model allows parties to deal with new risks as they arise, rather than seek contract variations.
|
A target outturn cost is the estimated actual cost of designing, constructing and delivering the project. |
There are three main approaches to pricing in alliance contracts:
- Competitive alliances (or full price competition)—where two or more shortlisted parties develop competing target outturn costs. According to the National Alliance Contracting Guidelines (NACG)—which Victoria has adopted as its alliance contracting policy—owners should consider full price competition as the default pricing position for any alliance.
- Partial price competition—where shortlisted parties only develop pricing for some elements of the target outturn cost. The sole successful party then prices the remaining target outturn cost elements alongside the owner.
- Non-price competition—where owners select private sector parties using non-price selection criteria only, such as team capability and experience.
Figure 3A shows the contract and pricing models used by LXRA and VicRoads for each package.
Figure 3A
Contract and pricing model for LXRP delivery
|
Package |
Sites |
Contractual and pricing model |
Awarded by |
|---|---|---|---|
|
Package 1 |
4 |
Competitive alliance for all sites |
VicRoads |
|
Package 2 |
4 |
Competitive alliance for all sites |
VicRoads |
|
Package 3—CTD |
9 |
Competitive alliance for all sites |
LXRA |
|
Package 4 |
2 |
Competitive alliance for all sites |
VicRoads |
|
Melton Highway |
1 |
Design and construct |
LXRA |
|
Thompsons Road |
1 |
Design and construct as part of VicRoads duplication of Thompsons Road |
VicRoads |
|
North Eastern package |
4 |
Partial price competition alliance for all sites |
LXRA |
|
North Western package |
6 |
Competitive alliance for initial two sites; partial price competition for additional four sites |
LXRA |
|
Western package |
6 |
Competitive alliance for initial one site; partial price competition for additional five sites |
LXRA |
|
Southern package |
9 |
Competitive alliance for initial four sites; partial price competition for additional five sites |
LXRA |
|
Unallocated level crossings |
6 |
LXRA to award these sites using partial price competition to existing alliances dependent on performance |
LXRA |
Source: VAGO, based on information provided by LXRA.
Partial price competition
Partial price competition contracts remove an element of competitive tension from the tendering process. This can restrict an agency's ability to achieve value for money and can limit innovation in design and construction solutions.
To date, LXRA has used partial price competition to award two sites, both in the North Eastern package. At the completion of the LXRP, LXRA will have used partial price competition for 24 of the 52 level crossings.
Despite the NACG preferring competition as a default condition for alliances, they permit the use of partial price competition in alliances in some circumstances. However, the guidelines also state that agencies should seek an exemption before proceeding with a non-competitive or partially competitive alliance.
LXRA advised that exemptions were unnecessary as government approved each procurement strategy and, in compliance with this approval, LXRA put in place performance and benchmarking frameworks for comparing price and productivity efficiencies.
North Eastern package
The North Eastern package is the only package where LXRA will use only partial price competition.
The rationale for this decision was the need to fast track procurement for the North Eastern package to meet the government's commitments to remove 20 level crossings and duplicate the Hurstbridge line by 2018.
This is not consistent with the NACG. The need to accelerate procurement—in most situations—does not justify using partial price competition. The exception is a rare situation where the community needs construction to commence immediately. LXRA has not argued that there is a need for immediate commencement of the North Eastern package.
LXRA's view is that the NACG does not apply as the LXRP time frame came from a government direction. However, LXRA is ultimately responsible for advising the government on the appropriateness of procurement strategies, including whether they align with state policy.
In addition to meeting committed time frames, LXRA advised that partial price competition presents other benefits to the project as it:
- secures resources prior to a market activity peak across Australia in 2019–22
- enables concurrent stakeholder consultation and constructor involvement in options assessment.
However, these benefits also apply to other alliances where LXRA procured the initial sites using full price competition. Over the life of the package, LXRA should monitor, report on and commission an independent evaluation on whether partial price competition has achieved value for money and delivered on the benefits stated above.
3.3 Contract structure
LXRA devised a contract structure that allows it to defer pricing on some crossing removal sites for the North Eastern, North Western, Western and Southern packages.
Parties competitively bid for the initial work package, which can include one to four sites. If LXRA is satisfied with the alliance's performance in delivering the first site's works, it will then ask the alliance to develop a formal proposal for the additional sites in that package.
LXRA may approach other alliances or the wider market to deliver the additional works if it is not satisfied with the alliance's performance or proposal.
Appendix F shows the initial and additional works for each package. There are at least two sites in each package that LXRA will allocate to an alliance without full price competition.
Benefits of the contract structure
LXRA chose this contract structure based on lessons learned during VicRoads' extended procurement process for early LXRP packages as well as its own procurement of the CTD package. According to LXRA, one benefit of the structure is that it keeps project teams together, resulting in productivity improvements through the retention of staff and key knowledge and skills throughout the whole process.
LXRA has identified other advantages with this contract structure, in terms of engagement with the private sector—particularly, that it:
- allows LXRA to leverage contractor involvement in development and communications processes
- enables contractors to lock in key resources that may be lost to other infrastructure projects
- ensures stable engagement with the private sector
- reduces tendering costs and ensures focus is on the actual delivery of works
- allows the majority of procurement activity to be completed prior to peak market activity in 2019–22.
As LXRA is yet to allocate any of the additional works to an alliance, it has not tested the effectiveness of its contract structure. LXRA should monitor this throughout the program.
Risks of the contract structure
LXRA's contract structure introduces a number of risks to achieving value for money and on-time project delivery, primarily due to the reduced price and design competition. Parties may also engage in loss-leading behaviours in initial tendering in order to secure the larger package of works.
DTF and DPC advice to government also identified potential risks:
- the selected party for the initial sites may have an incumbency advantage when seeking the additional sites, due to existing knowledge, experience and stakeholder relationships
- LXRA may need to return to the market if the selected proponent performs poorly on the initial site(s), leading to significant program delay—this is particularly the case with the Western program alliance which has only one site in the initial works package.
These risks are compounded in the North Eastern package, where LXRA did not use full price competition to procure a proponent for the initial sites. Acknowledging these risks, LXRA is developing mitigation tools, as outlined in Section 3.4.
3.4 Management of procurement risks
LXRA is using benchmarking and commercial frameworks to manage the risks of partial price competition and the contract structure.
Benchmarking framework
LXRA's benchmarking framework includes a tool for comparing price and productivity efficiencies across the program alliances and allows LXRA to consider whether a proposal achieves value for money.
The benchmarking tool contains a detailed breakdown of costs for each level crossing removal in the program, as well as for some previously completed removals. Where a project has not been completed or awarded, LXRA bases the data on the business case cost estimate for that site. Data compiled in the tool includes direct job costs such as signalling and landscaping, as well as design and occupation costs.
LXRA also collates cost data according to grade separation type—for example, rail under road—which enables it to develop and compare cost profiles for each type of grade separation. This is an essential step as the type of grade separation is a strong factor in determining the overall cost of a removal.
When LXRA awards contracts or completes level crossing removals, it replaces estimates in the tool with contracted or actual costs. Therefore, as the program continues, the tool will become more accurate and will provide a more adequate control for procurement cost risks.
LXRA also uses an independent estimator to confirm that proponents have priced their target outturn costs competitively and that they adequately reflect the scope of work.
Limited application of benchmarking tool
To date, LXRA has only applied the benchmarking tool for the North Eastern Program Alliance.
Government approved the procurement strategy for this package in May 2016, subject to the Treasurer's approval of a strong performance and benchmarking regime. LXRA selected the preferred party for this package in August 2016. The Treasurer only formally approved the benchmarking framework in December 2016, shortly before approving the award of the contract in January 2017. The short time frame between approval of the tool and the award of the contract indicates that LXRA relied on the tool to mitigate procurement risks prior to its formal approval. LXRA advised that DTF had viewed the tool and informally approved its use prior to the Treasurer's formal approval.
LXRA has advised that it will use the benchmarking tool when assessing future proposals for additional works as a way to overcome the risks of a non‑competitive process. It is therefore important that LXRA continues to update the tool with actual cost data as it becomes available and integrate it into future procurements.
While the benchmarking tool has the potential to allow LXRA to monitor value for money, it cannot, on its own, drive innovation in design and construction solutions. LXRA uses the commercial frameworks of its alliances to motivate NOPs to find innovative construction and design solutions.
Commercial frameworks
LXRA is using the commercial framework of its alliance agreements to mitigate the risks of its procurement strategy. The commercial framework sets out the structure and principles that govern remuneration for the project. It includes the following three main elements:
- reimbursable costs—NOPs' actual direct project costs
- corporate overhead and profit
- a risk and reward regime.
Direct costs, corporate overhead and profit
LXRA sets some financial elements for all of its alliances using full price competition. This is what makes LXRA's alliances—excluding CTD—partially competitive rather than non-competitive. These elements serve as a control for the risks of LXRA's deferred pricing contract structure. The largest element set this way is corporate overhead and profit.
When awarding the initial works packages, LXRA locks in overhead and profit for all remaining sites in the package. Overhead and profit as a percentage of direct job costs is lower for awarded packages using the deferred pricing model than for the initial four alliances that did not use this model.
This could demonstrate that LXRA's model is effectively engaging the market, ensuring a steady pipeline of work that allows proponents to lower procurement costs. However, there is a risk that parties have bid low on overhead and profit with the expectation of increased direct job costs on later sites. This highlights the need for LXRA to continue to update and apply the benchmarking tool to effectively assess its proposals.
Risk and reward regimes
A risk and reward regime sets out the owner and NOPs' share of the 'pain or gain' outcome of the project. This involves comparing actual and target performance in both cost and non-cost areas.
In terms of cost, parties essentially share in the cost underrun (gain share) or overrun (pain share) of a project.
All of LXRA's alliance contracts cap NOP pain share—the amount the NOP would have to pay in the event of a cost overrun. This is standard practice in alliance contracting. However, the NACG notes that owners should be cautious of such caps. When the overrun exceeds the cap, the state effectively bears all project risk beyond a certain point. This unequal risk exposure can put pressure on collaborative alliance principles such as best-for-project decision-making.
NACG recommends that owners consider placing a reciprocal cap on the amount NOPs can receive for a cost underrun. This helps to alleviate concerns about the potential for NOPs to earn large profits.
LXRA applied a cap on pain share to three of its works packages. However, there is no reciprocal cap on gain share for CTD. Packages 1, 2 and 4, awarded by VicRoads, also do not have a cap on gain share.
For non-cost areas, the regime includes financial incentives for strong performance and penalties for poor performance. A risk and reward regime is a key element of the collaborative nature of alliances.
LXRA's risk and reward regimes are generally in line with NACG. Although the regime is slightly different for each package of works, each one includes a clear method of calculating performance. LXRA uses its risk and reward regimes to motivate strong performance in areas such as safety, minimising passenger disruptions, continuous improvement and stakeholder management. This mitigates the risks introduced by partial price competition.
LXRA intends to use its risk and reward regimes to measure alliance performance during project delivery. In particular, LXRA intends to apply a 'track record' test to determine whether an alliance has performed well enough to merit allocation of additional sites within the package. The track record test assesses alliance performance against KPIs, package cost risk or reward regime, and any other measures LXRA deems necessary to assess performance.
If LXRA applies this consistently, it will mitigate the risk of parties having an incumbency advantage when seeking further sites.
3.5 Packaging and sequencing of works
Packaging
Dividing the LXRP into packages of work is beneficial for LXRA as it can match level crossing removals to rail capacity investments, road projects or other works. Packaging also provides a more predictable pipeline of work for industry.
LXRA estimated that packaging level crossing removals, as opposed to individually removing them, would save approximately $400 million across the program.
Packaging options
The LXRP business case considered two options for packaging the remaining 30[1] level crossing removals, namely:
- a corridor approach—in which crossing sites along rail corridors are packaged together
- a discipline-based approach—where similar work types are packaged together (such as stations, power, signalling, and rail track).
LXRA's evaluation of these two options emphasised that time, management of disruptions and risk management were important considerations. LXRA ultimately determined that the corridor approach better matched the LXRP's objectives.
The business case also considered the number of crossings in work packages. Analysis of previous procurement processes found larger package sizes could result in savings as they provide efficiencies with staff, site facilities, design, occupation and direct costs. LXRA balanced these potential savings from larger package sizes with market participation and capacity limitations to facilitate competition for packages.
Packages of work
Of the 52 level crossing removal sites, eight packages contain between two and nine level crossings and two packages have one crossing each. There are six crossings that LXRA has not yet allocated to a package.
Figure 3B shows that the LXRP has packaged the majority of crossings according to their rail corridor location.
Figure 3B
Level crossing removal packages
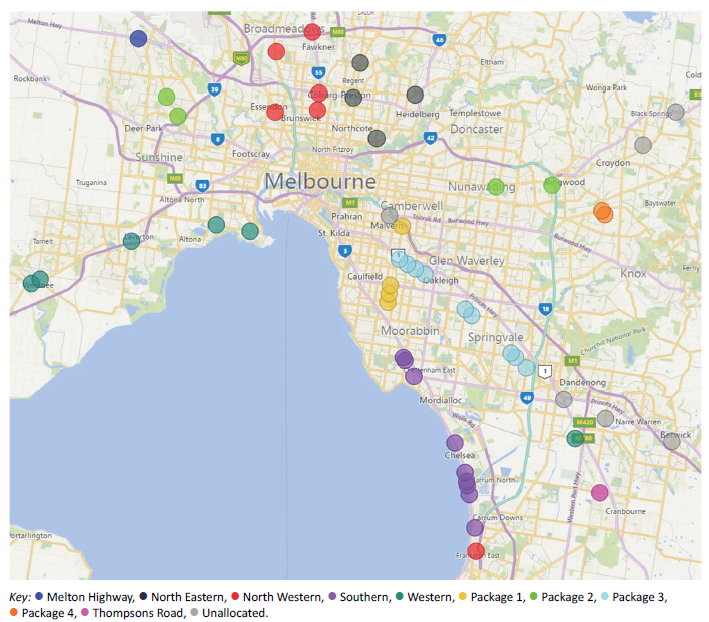
Source: VAGO, based on information provided by LXRA.
LXRA has not packaged three crossings within the relevant corridor:
- Abbotts Road, Dandenong South—Western package
- Toorak Road, Kooyong—unallocated 'package', yet in close proximity to, and on the same line as, Burke Road, Glen Iris (Package 1)
- Skye Road, Frankston—North Western package.
The level crossing at Skye Road was initially part of the Frankston package, consistent with the corridor approach. However, following a decision to accelerate the removal of this level crossing, LXRA moved it to another alliance—North Western package—as described in Figure 3C.
Figure 3C
Case study: Acceleration of Skye Road crossing removal
|
Skye Road is the most southern crossing on the Frankston line in the LXRP. While it was in the top 50 most dangerous metropolitan crossings on the ALCAM 2008 list, VicRoads rated it as no priority in its 2013 list and it was not on RACV's 2013 priority list. LXRA initially listed this crossing as part of the Frankston package—later renamed the Southern package—as additional work. In December 2016, LXRA provided advice to government on accelerating the removal of the Skye Road crossing by moving it to the North Western package, as initial work. Advice to government emphasised the benefits of acceleration, and stated that the change would achieve a value-for-money outcome for the state. However, it did not include the expected acceleration cost, relative priority for removal, or disadvantages of accelerating the removal. LXRA advised that the main benefit achieved would be to bring forward the commencement of the removal by one year, from mid-2018 to mid-2017. LXRA also advised the benefits would include saving escalation costs and assisting delivery of its most difficult and complex package. Both the Southern package and the North Western package are using a competitive alliance for the initial sites, with additional sites dependent on the alliance's performance. DTF initially advised government against accelerating the removal of Skye Road. It considered the acceleration was rushed and warned that it may increase the cost and complexity of the North Western package. At DTF's request, LXRA provided documentation showing the capacity of the North Western package to undertake the additional work. DTF subsequently approved the acceleration. Prior to receipt of this documentation, government decided to proceed and moved responsibility to the North Western Alliance. In March 2017, LXRA estimated that this cost an additional $11 million, due to a reduction in anticipated program efficiencies. |
Source: VAGO, based on information provided by LXRA.
Compared with other crossings in the Southern package, Skye Road is the easiest to progress as the community supports the reference option in the business case. While $11 million in additional costs is not material in the context of the whole LXRP, accelerating its removal by moving responsibility to the North Western Alliance helps LXRA to meet the government's committed target of removing 20 level crossings by 2018.
Inclusion of additional level crossing sites
The pre-determined selection of level crossings affects packaging. As stated previously, the government added two level crossings to the LXRP, due to their adjacency to other LXRP works. This indicates that the LXRP could have gained efficiencies by considering level crossings that are outside the 50 selected.
Figures 3D and 3E present alternative packaging options for the Frankston and Craigieburn lines.
In the 7.5-kilometre stretch of the Frankston rail line between Edithvale Road and Station Street, Seaford, there are 10 level crossings. The LXRP will remove five of these, leaving five in place.
Also on the Frankston line—in the 1.9-kilometre stretch between Neerim Road and North Road—there are three level crossings. The LXRP has removed North Road. Glen Huntly Road level crossing is 1.6 kilometres from North Road and the Neerim Road level crossing is less than 300 metres away. Neither of these are part of the LXRP.
Figure 3D
Alternative packaging options—Frankston line
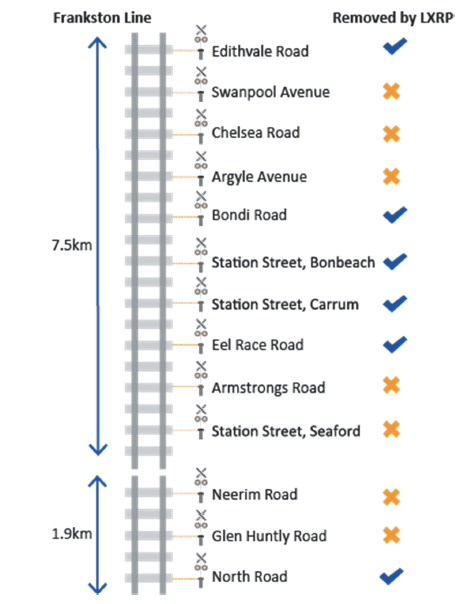
Note: Distances listed are from the first to last crossing.
Source: VAGO, based on research by Stone and Woodcock.
On the Craigieburn line, LXRA will remove Buckley Street as part of the LXRP. However, two level crossings in close proximity are not part of the program for removal. The Park Street level crossing is 550 metres away and Puckle Street is 1.1 kilometres away, as shown in Figure 3E.
Figure 3E
Alternative packaging options—Craigieburn line
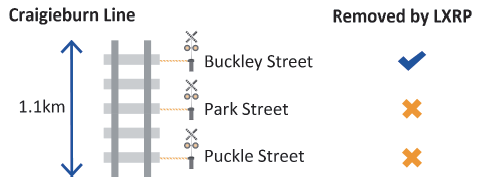
Note: The distance shown is between the Buckley Street and Puckle Street crossings.
Source: VAGO, based on information provided by TfV.
TfV is currently leading the development of the methodology for selecting further level crossings for removal, so neither LXRA nor TfV could advise us of whether or how crossings such as those listed above will be incorporated in future removal packages.
Sequencing
Sequencing refers to the order in which removals occur, both within packages and across the whole LXRP.
Sequencing of all transport infrastructure projects currently underway—including the LXRP—needs effective management to ensure expertise and resources are available, and to minimise the impact on the community.
Sequencing of LXRP works
Meeting the government's commitment to deliver 20 crossing removals by mid-2018 is a determining factor in the sequencing of crossing removals.
When planning the delivery of crossing removals, LXRA also considered:
- the large volume of rail projects in Victoria and New South Wales between 2016 and 2025, including MTP, CPLU, Sydney metro expansions and New South Wales light rail projects
- maintaining flexibility in the procurement and delivery of crossings
- government announcements about the timing of individual crossing removals
- the extent of preparatory works that were complete for each crossing
- whether the design solution was known, and its complexity.
LXRA did not analyse which crossings had the highest priority for removal, from a safety or rail efficiency perspective, to inform the sequencing of crossing removals. LXRA advised that instead, the packaging of works drove sequencing decisions. This meant that crossings that were already progressed enough to be put to tender became the initial works within a package and were removed first.
LXRA implemented the sequencing of works through the request for proposal of each package. This outlined a proposed delivery order and time frame, however, alliances were able to propose alternative sequencing within the package to optimise value for money.
3.6 Rail occupations
Removing level crossings involves the temporary closure of the rail line and its occupation to enable construction works. Minimising the impact to the travelling public has been an important consideration for LXRA and alliance members.
Types of occupations
There have been two types of rail track occupations:
- major works—longer track occupations which result in larger disruptions and often require alternative transport services for the travelling public
- minor works—short-term use of the track, with less disruption, where occupations usually happen after the last train has run and before the first train the following morning, or single weekend day works.
At July 2017, there were 95 major and 257 minor occupations planned, of which around 51 per cent and 56 per cent respectively have been completed, as shown in Figure 3F.
Figure 3F
Occupations
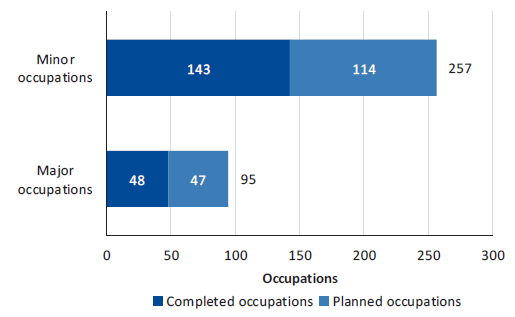
Source: VAGO, based on information provided by LXRA.
At September 2017, the longest major occupation was 42 days and the longest planned occupation is 83 days.
Planning for occupations
During the request for proposal stage, alliances are responsible for proposing the number, type and length of occupations that will best deliver their program of works. If LXRA deems that the proposed occupation schedule is not acceptable, it seeks to resolve its concerns with the appointed alliance.
Planning for major occupations commences at least six months before the proposed occupation. As the rail line operator, MTM is the ultimate approver of rail occupations. If planning documents do not meet its requirements, or the occupation is not likely to cease on the agreed day and time, MTM may postpone or cancel the planned occupation.
At July 2017, the alliances did not complete around 3 per cent—three occupations—of total major occupations as planned. Two of these delays were less than one hour, and the third was one day late. The small number of late completions is a good result, and evidence of sound occupation planning and management.
Alternative transport provision
The majority of major occupations, and some minor occupations, require alternative transport, usually through bus replacements.
PTV, LXRA, MTM and VicRoads notify public transport users of planned service disruptions and bus replacement services well in advance through public transport websites, social media and notifications at train stations and tram stops.
1 The business case was completed prior to the addition of the two extra crossings.
4 Intended benefits
The intended benefits of the LXRP are diverse and include those generally recognised for transport projects—specifically, improvements to safety and travel, stimulating economic growth, revitalising local communities, and facilitating more trains running more often.
4.1 Conclusion
As completion of the LXRP is not due until 2022—with only 10 of 52 crossings removed—there is insufficient data at present to make an informed judgement on the extent to which it is achieving intended outcomes. Additionally, while LXRA has developed KPIs and targets, some of these are not meaningful. Without these, LXRA cannot assess the extent to which the program is achieving intended outcomes.
4.2 Benefits management framework
DEDJTR has developed a benefits management framework in accordance with DTF requirements.
The framework includes an investment logic map, benefit map and benefit management plan. These were developed from a series of workshops, which included consideration of the problem and benefits, and knowledge from previous level crossing removal projects and other related programs.
DEDJTR circulated the investment logic map, benefit map and benefit management plan to stakeholders from various government departments for comment.
The following high-level benefits have been identified for the LXRP:
- Improved productivity from more reliable and efficient transport networks—addressing the congestion and delays caused by level crossings will improve the efficiency of Melbourne's transport networks.
- Better connected, liveable and thriving communities—removal of level crossings will reduce delays and increase the attractiveness of living and investing in areas surrounding the crossings.
- Safer communities—removing rail and road intersections will eliminate the conflict points between trains and road users, and trains and pedestrians, reducing the number of crashes.
DEDJTR developed KPIs and targets to measure the delivery of these benefits. LXRA is responsible for monitoring the achievement of performance targets and for actions required to improve any area where the target is not achieved.
LXRP's benefits framework has limited outcomes reporting—due to the lack of comprehensive indicators and targets—and needs improvement. The benefits framework is outlined in Appendix G.
KPIs, targets and reporting
KPIs and targets specified in the benefit management plan are not comprehensive, in that they only require an 'improvement'—for example:
- 100 per cent of sites with road based public transport will have improved punctuality
- 100 per cent of sites will have improved access to local activity centres and major services.
These targets would be realised with any level crossing removal.
LXRA advised us that it deliberately set targets in this way because factors other than the crossing removal can affect outcomes. Given this, the KPIs themselves are unlikely to be suitable measures.
LXRA should still monitor its performance against intended benefits so that it can meaningfully report on the contribution the LXRP is making in achieving outcomes.
The business case indicates that the principal transport benefits from the LXRP are changes in journey times for private, business and freight vehicles across Melbourne's road network.
The business case indicates that LXRA will measure and report for the whole program, although it will collect some measures and KPIs for individual packages. For the CTD rail corridor project, LXRA will prepare a benefits management plan for the entire corridor rather than for individual crossings.
LXRA advised that when the removal program is completed, it intends to 'roll up' individual benefits reports into a holistic program report. In doing so, LXRA will have limited timely insight into how LXRP as a whole is progressing towards benefits realisation.
LXRA has quantified journey times as travel time savings, included in its CBA as a core benefit. LXRA should use these and other CBA core quantified benefits as KPIs, and measure and report on these core transport benefits consistent with the business case. See Appendix E for the value of core quantifiable benefits.
Progress towards benefit realisation
LXRA prepared draft benefit reports for four sites that show the impact of crossing removals as at March 2017—Burke Road, Centre Road, McKinnon Road and North Road. Three sites, excluding McKinnon Road, have seven KPIs with available data. Data is available for only one KPI for McKinnon Road. None of the sites have met all seven KPIs.
LXRA acknowledges that the draft benefit reports do not provide meaningful information about the extent of improvement and whether the progress results are in line with expectations.
LXRA makes a judgement on KPI data it compiles such as travel times, vehicle speeds, physical pedestrian counts, cyclists and community surveys. Where the data indicates benefits are not tracking as expected, LXRA considers whether it should take corrective action. However, LXRA does not document its assessment of the data.
Benefit reports would be more meaningful if they included commentary to interpret the results. For example, if travel time in the morning peak reduced by 1.9 minutes, commentary on whether these results are positive or otherwise should be included.
Figure 4A provides examples of KPI targets that level crossing removals have met or not met.
Figure 4A
Examples of KPI targets
|
Target |
Result |
|---|---|
|
Average travel time reduced |
|
|
Vehicle throughput increased |
|
|
Travel time reliability improved |
|
|
No new safety incidents |
|
Source: VAGO, based on information provided by LXRA.
Data is not yet available for a number of KPIs. These include:
- community satisfaction with local amenity following crossing removal
- IDOs
- public transport intermodal connectivity
- reduced number of safety incidents and improved ALCAM risk score.
Overall, the reports for the four crossings indicate that benefits realised to date are below expectations. Further, without specific targets, it is not known if the extent of improvement, where achieved, is in line with expected outcomes.
4.3 Maximising value-capture opportunities
LXRA has developed a comprehensive plan aimed at maximising value-capture opportunities through the LXRP.
Value capture is the act of collecting a portion of the benefits from public infrastructure investments that flow to the value of land. Government can then use that value to pay for a portion of the corresponding infrastructure investment.
|
An integrated development opportunity (IDO) refers to the value created through infrastructure and land development that occurs when removing the level crossing. |
For the LXRP, value capture is limited to IDOs. For example, railway land that becomes surplus to requirements through a grade separation may, with some enabling works by LXRA, be suitable for sale to the private sector to develop. IDOs can also include broader social benefits such as social housing, community services and open spaces.
LXRA released an IDO strategy in December 2015. It provides guidance on identifying IDOs, potential benefits and how benefits can be realised.
Implementing the strategy involves the following key activities:
- establishing an experienced multidisciplinary team to optimise value capture
- developing an appropriate planning approval process focused on project planning and design, to increase certainty and improve value-capture opportunities
- identifying entrepreneurial commercial and development opportunities that are scoped against market appetite for investment and risk taking—the identification of development opportunities is done using project proposals and the procurement process, rather than through program-level planning.
Monitoring IDOs
LXRA's ongoing monitoring of IDO projects is timely and comprehensive. It produces monthly IDO dashboard reports that provide a high-level comprehensive summary of the status of each level crossing site against project milestones. The report includes:
- gross and net revenue forecasts for the state from the sale of developed land
- costs incurred by the state to facilitate IDOs
- the type and number of residential and commercial properties proposed to be developed.
At March 2017, LXRA had identified 26 possible IDO sites estimated to provide a net return to the state of $153 million. This includes $271 million from property sales less $118 million for development enabling works, such as site preparation works.
The Coordinator-General has signed the development contract for one site, 24 sites are under consideration and one site is not proceeding. LXRA expects completion of the first IDO site in March 2021 and the last in September 2027. While LXRA aims to recover the enabling costs it incurs at each site, it does not have a specific net revenue return target.
LXRA's inability to get stakeholders to reach agreement on property developments is delaying the timely realisation of IDOs, particularly on more contentious developments, such as high-rise apartments or office towers.
This lack of agreement delays government approval of the development scope and subsequent property development agreement. This means that despite the alliance completing the level crossing removal and enabling works for the IDO, construction cannot start even though LXRA has engaged a developer.
LXRA also acknowledges the estimated return to the state may reduce if there is significant community opposition to the proposed development or the cost of enabling works becomes excessive.
Maintenance of open space
Responsibility for maintenance of community open space, such as parklands, created through an IDO project is yet to be resolved.
Although LXRA meets the cost of developing the land into open space, its crossing removal budget does not extend to meeting the ongoing maintenance costs. LXRA has advised that VicTrack—the owner of the railway land—and the local councils—whose municipality the open space belongs to—have not yet reached agreement for the ongoing maintenance of the area. VicTrack advised that it could manage this activity if funding was provided to do so.
In April 2016, LXRA put forward a proposal to government for a $15 million open space maintenance account created through the CTD project. DPC and DTF questioned the establishment, management and maintenance of the account. As at October 2017, the proposal is still under consideration.
5 Network integration and integrity
The LXRP is occurring in parallel with a range of other major transport projects including the MTP, CPLU and HCMT projects.
Integration between the LXRP and other major rail projects is important for ensuring the efficient and effective development of Melbourne's future transport network—now overseen by TfV. PTV also has a major role in ensuring integration of all rail projects into the network.
5.1 Conclusion
PTV does not have adequate resources to effectively perform its network integrity role. This has undesirable cost and scope consequences for the integration of the LXRP and other concurrent rail projects into the rail network. PTV, with support from TfV, which is now responsible for transport planning, will need to ensure that actions to address shortcomings are effective.
5.2 Oversight of public transport network integrity
One of PTV's key functions, since September 2016, is to ensure network integrity—a functionally effective, reliable, maintainable, secure, safe and environmentally compatible public transport network. Among other things, this requires PTV to:
- understand the network's future performance requirements
- establish network requirements and standards
- understand the current condition of rail assets.
This function is particularly important for the effective delivery of the LXRP as part of a series of other city-changing rail projects. Specifically, PTV and TfV need to make sure all concurrent rail projects properly integrate with the existing train network and that their expected project benefits can be realised.
PTV has not performed this role due to a lack of capability, and by not establishing standards or controlling risks.
Capability gaps
PTV commissioned an independent review in May 2016 (the May 2016 review), which identified that PTV had insufficient capability to perform its network integrity function:
'the network integrity role was not performed to an adequate level having limited resources, a focus on discrete individual projects rather than a ‘whole of network’ public transport system perspective and insufficient governance during delivery.'
The May 2016 review also found a number of capability gaps existed within PTV, including engineering, technical safety and asset management. The review noted that if PTV does not address these gaps, network integrity is at significant risk. PTV would then not be able to demonstrate that it is effectively managing its portfolio of transport assets and providing long-term value for money.
Absence of contemporary rail standards
As part of its network integrity and assurance role, PTV is responsible for establishing:
- network technical requirements—high-level technical requirements for a transport corridor or geographic area
- network technical standards—derived from network technical requirements and used to inform and direct the development of system requirements and specifications, and engineering standards that AROs are required to develop.
Neither network technical requirements nor network technical standards have been established—instead, Victoria operates under the industry-derived Victorian Rail Industry Operators Group standards.
The May 2016 review also found that no entity has responsibility for reviewing the Victorian Rail Industry Operators Group standards adopted by the AROs. The process of updating and challenging standards to achieve a best-for-Victoria performance standard has not progressed effectively in recent times.
The May 2016 review emphasised that without contemporary standards, agencies delivering rail projects are proceeding with varying levels of understanding of network requirements and of their duties to assure projects meet engineering, network integration and technical safety requirements.
This poses significant risks of the new systems not being integrated into the current network.
PTV has acknowledged that while it has relied on Victorian Rail Industry Operators Group standards, a modern public transport network requires a more robust and formally managed set of technical standards, including the establishment of appropriately controlled engineering standards.
PTV has initiated action aimed at establishing appropriate engineering standards, with a view to replacing the Victorian Rail Industry Operators Group standards with the network technical standards by July 2018.
Application of standards to the LXRP
LXRA set project system requirements that contractors delivering the LXRP are required to comply with. These project system requirements are a translation of PTV and MTM requirements, as well as other standards and specifications. However, during the project system requirements process, there is scope for variations which, in turn, can have cost implications for projects—for example, an approval to not comply or partially comply may reduce project costs and time lines.
MTM, the ARO in the metropolitan area, manages the approval processes for changes to its engineering standards and their interpretation. This can occur using either a:
- standard waiver—a mechanism to assess, document and approve any deviation from current endorsed standards applicable to maintain, upgrade, renew, build and commission MTM assets
- design practice note—an instruction issued by MTM on how to interpret, or to clarify a standard or practice, which is then applicable to that standard for the entire network.
However, PTV agrees that as MTM has limited insight into network-level requirements, including future developments, there is a risk that these decisions can affect other transport projects.
Furthermore, as MTM is also a member of all of the LXRP alliances, there is a perceived conflict of interest. MTM is both part of the project development team applying for a standard waiver and part of the organisation making decisions on variation requests.
LXRA and PTV have both advised that MTM's standard waiver process mitigates the risk of the perceived conflict occurring, as the process is managed through a different part of the organisation than the one that is involved with the project. The Office of the National Rail Safety Regulator is also an important control. MTM is accountable to the Office of the National Rail Safety Regulator, requiring it to conform to correct processes in granting waivers; otherwise, its accreditation is at risk.
While the Office of the National Rail Safety Regulator would consider processes for granting standard waivers, it would not necessarily look at the process of developing design practice notes. To mitigate this and other network integrity risks, PTV has introduced a number of controls.
Controls for network integrity risks
PTV has established a number of arrangements to improve oversight of and accountability over how it manages network integrity risks. These include a network integrity governance framework, as shown in Figure 5A.
Figure 5A
Network integrity governance framework
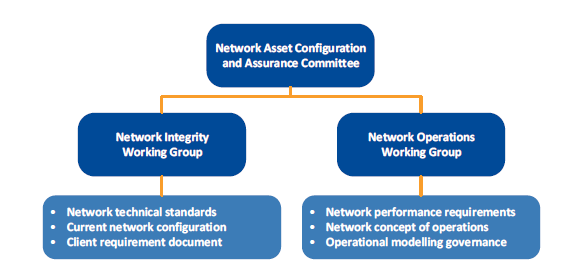
Source: VAGO, based on information provided by PTV.
In November 2016, PTV established the Network Asset Configuration and Assurance Committee to provide:
- integrated advice on network planning and development
- assurance that the capital program is aligned to network technical requirements and network technical standards
- assurance that the existing network is ready to receive planned investments.
The Network Asset Configuration and Assurance Committee also approves any proposed changes to network performance requirements.
Two working groups support the Network Asset Configuration and Assurance Committee:
- The Network Integrity Working Group—established in February 2017, includes representatives from PTV, MTM, TfV, VicTrack, V/Line and Yarra Trams. It is accountable for the technical integrity of the public transport network system and assets, including:
- approving interpretation of network standards
- approving all standard waivers specific to a project
- reviewing risks, assumptions, issues and opportunities that will have an impact on the integrity of the network, including future proofing.
- The Network Operations Working Group—provides advice on public transport network capability and performance.
In addition to these internal governance arrangements, PTV also added a formalised standards governance process in the new franchise agreement with MTM, beginning on 30 November 2017. This includes the planned establishment, in January 2018, of a standards governance group comprising senior representatives from PTV and MTM that will review and approve:
- any proposed changes to network standards
- any proposed new standards
- any processes to be adopted relating to the assessment or acceptance of any MTM noncompliance with a standard.
PTV's introduction of these additional controls to improve its network integrity function is happening in parallel with the delivery of a number of important transport projects. It is therefore important for PTV, and TfV, to closely monitor the effectiveness of these new arrangements, particularly for programs such as the LXRP, which is well underway.
Network development plan
PTV developed a network development plan for metropolitan rail in 2012, which sets out the future state of the rail network. PTV has not revised this plan.
TfV has indicated that it is developing a rail network development plan to replace PTV's 2012 plan. The LXRP business case refers to PTV's plan.
LXRA's report to the MTIP board in April 2017 stated that:
'TfV currently does not have an agreed baseline for the performance of the metropolitan rail network (e.g. trains per hour, power requirements), no comprehensive assessment of the condition of rail assets and no agreed plan for the future state of the network.'
Until TfV develops and approves an updated plan, there is a risk that LXRA may need to vary or redo works associated with the current crossing removals.
5.3 Cost implications of poor network integrity
Poor network integrity has already contributed to cost increases for some rail projects, such as those along the Cranbourne Pakenham rail corridor that include the HCMT, CTD and the MTP.
In March 2017, PTV predicted that the long lead times of projects in the CPLU program would necessitate parallel development and delivery to meet key delivery dates. However, detailed consideration of the appropriate network requirements, and their subsequent application to the projects currently in delivery, highlighted some scope gaps and interface management issues that need to be resolved.
An indicative cost estimate for addressing these issues was $381.3 million—$158.6 million for additional work required in 2017–18 and a provision to cover associated risks of $222.7 million.
The successful completion of the CTD project, as well as other major transport projects, is critical for the successful future operation of the MTP. As PTV predicted, parallel development and delivery of these projects has been necessary to meet key delivery dates.
As part of DTF's HVHR project requirements, a due-diligence review on the interface and integration risks associated with the MTP and associated inter‑related projects on the Sunbury to Dandenong rail corridor was commissioned in September 2016.
The review noted that the LXRA, together with the Melbourne Metro Rail Authority, had developed interface control documents for the CTD and HCMT projects—including for additional works that LXRA could deliver while completing grade separations that would be beneficial for the HCMT.
The review also acknowledged that while a number of issues with the inconsistency of network standards existed, these are dealt with through the MTM Engineering Standards Committee. LXRA, MTM, PTV and the Melbourne Metro Rail Authority attend this committee. LXRA has established a process to evaluate the inconsistencies against current approved project baselines. The outcomes are reported back to MTM and PTV.
The April 2017 Infrastructure Coordination Committee report also stated that the absence of an agreed network performance plan is resulting in the uncoordinated inclusion of additional scope to accommodate some future requirements, including:
- Camp Road futureproofing of the Somerton rail connection and future Campbellfield Station
- Kororoit Creek Road power upgrade to 1 300kV
- Aviation Road/Cherry Street upgrade to include two additional tracks on the Werribee Line.
The April 2017 Infrastructure Coordination Committee report also identified that the uncoordinated changes to rail standards related to existing LXRA projects have impacts on scope, cost and time lines.
In response, LXRA has started discussions across the MTIP and with TfV aimed at developing future rail standards and an interim change management control arrangement to enable the scope of LXRA projects to be controlled.
Change management process
The LXRP project steering committee, comprising LXRA, PTV, MTM, VicRoads, VicTrack and TfV, manages information gaps such as network performance, asset condition and future network requirements.
For example, if PTV requests LXRA undertake additional works to accommodate possible future changes to the network, PTV needs to justify the request, including the cost. If the committee considers the request is not justified, it does not proceed. If the committee cannot reach a decision, it puts the request to TfV. The steering committee can make decisions on additional works' ability to comply with any updated or new standards.
Without additional funding, LXRA is reluctant to approve requests for additional works.
Now that TfV is responsible for setting the strategic transport direction, it should capture lessons from the LXRP to provide sector-wide leadership to transport agencies, so that future network requirements underpin planning for all future major transport projects.
Appendix A. Audit Act 1994 section 16—submissions and comments
We have consulted with the DEDJTR, PTV, VicRoads and VicTrack, and we considered their views when reaching our audit conclusions. As required by section 16(3) of the Audit Act 1994, we gave a draft copy of this report to those agencies and asked for their submissions and comments. We also provided a copy of the report to DPC.
Responsibility for the accuracy, fairness and balance of those comments rests solely with the agency head.
Responses were received as follows:
RESPONSE provided by the Secretary, DEDJTR
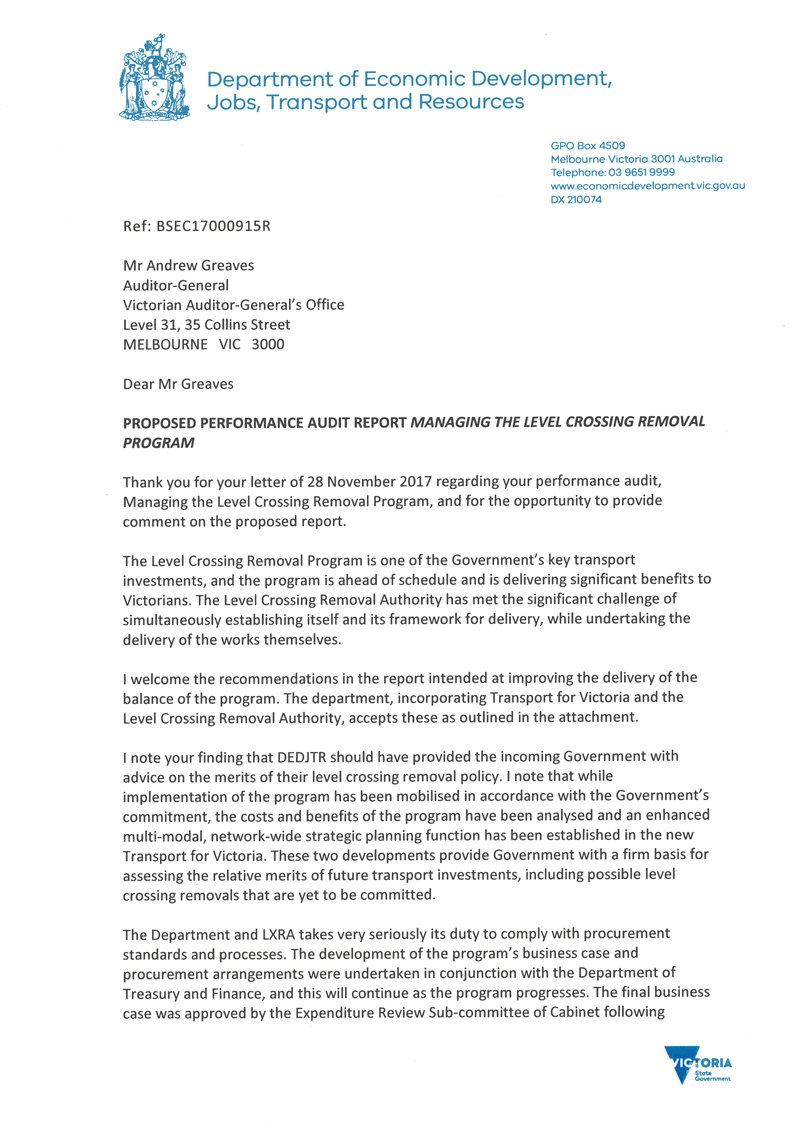

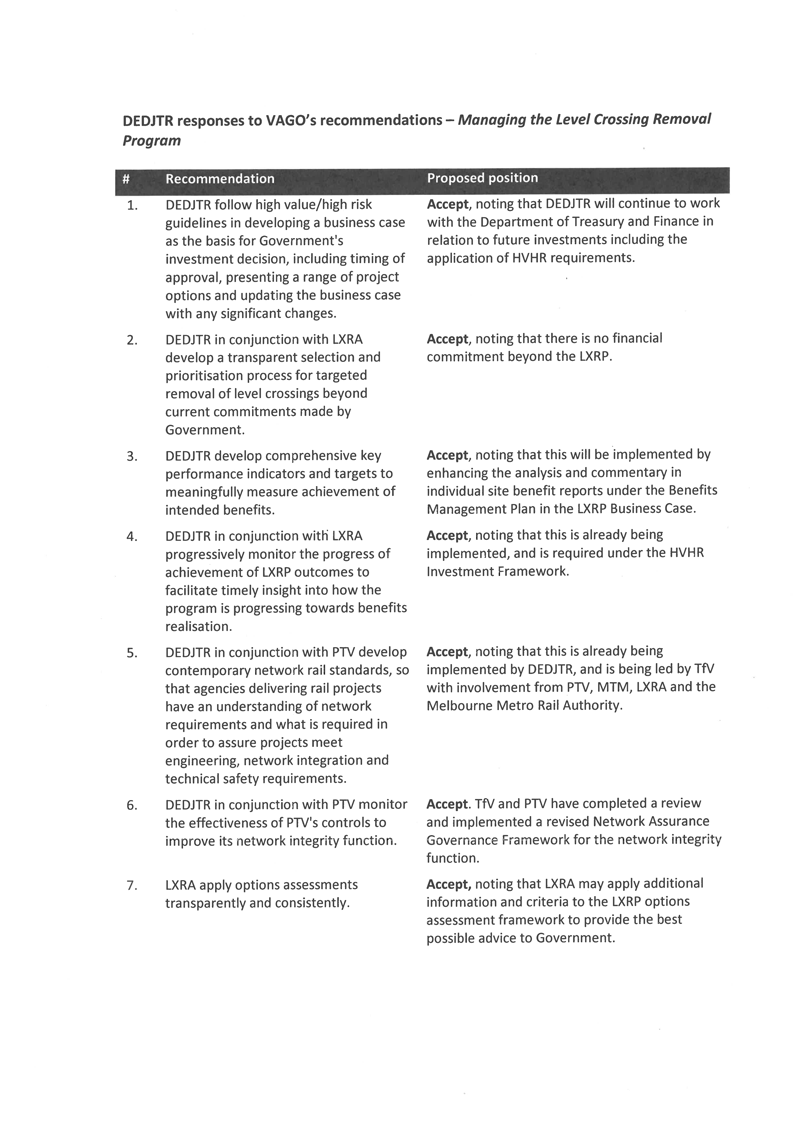
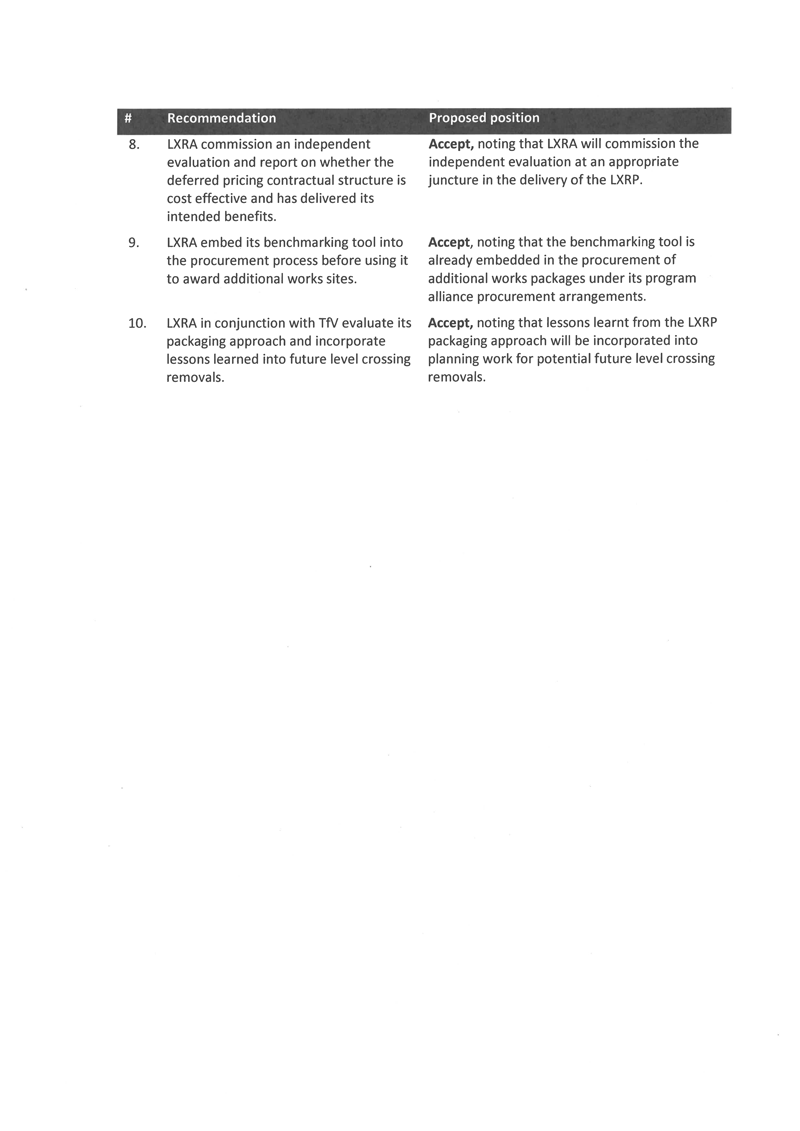
RESPONSE provided by the Acting Chief Executive Officer, PTV
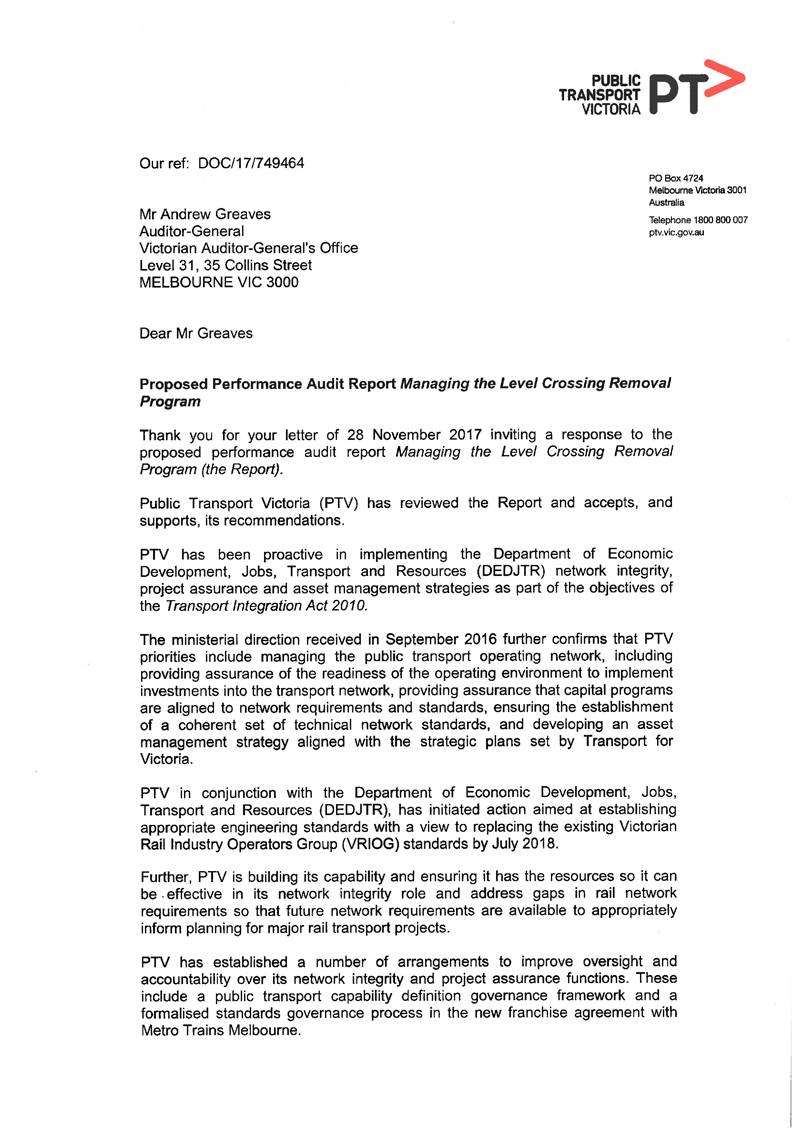
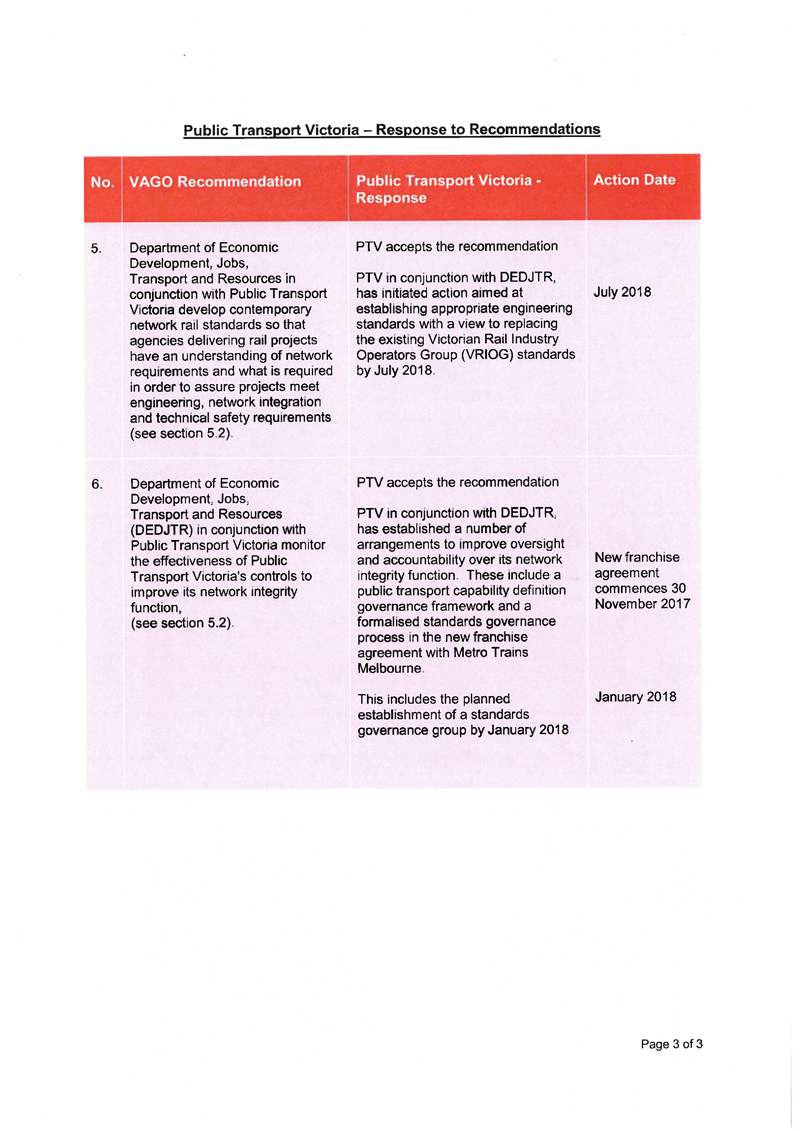
RESPONSE provided by the Chief Executive Officer, VicRoads
RESPONSE provided by the Acting Chief Executive, VicTrack
Appendix B. List of crossings for removal
Figure B1 provides the list of LXRP level crossing removals.
Figure B1
Level crossings part of the LXRP
|
1 |
Burke Road, Glen Iris |
27 |
Camp Road, Campbellfield |
|
|
2 |
Centre Road, Bentleigh |
28 |
Buckley Street, Essendon |
|
|
3 |
McKinnon Road, McKinnon |
29 |
Glenroy Road, Glenroy |
|
|
4 |
North Road, Ormond |
30 |
Bell Street, Coburg |
|
|
5 |
Furlong Road, St Albans |
31 |
Moreland Road, Brunswick |
|
|
6 |
Main Road, St Albans |
32 |
Kororoit Creek Road, Williamstown North |
|
|
7 |
Blackburn Road, Blackburn |
33 |
Abbotts Road, Dandenong South |
|
|
8 |
Heatherdale Road, Mitcham |
34 |
Aviation Road, Laverton |
|
|
9 |
Chandler Road, Noble Park |
35 |
Ferguson Street, Williamstown |
|
|
10 |
Corrigan Road, Noble Park |
36 |
Cherry Street, Werribee |
|
|
11 |
Grange Road, Carnegie |
37 |
Werribee Street, Werribee |
|
|
12 |
Heatherton Road, Noble Park |
38 |
Eel Race Road, Carrum |
|
|
13 |
Koornang Road, Carnegie |
39 |
Seaford Road, Seaford |
|
|
14 |
Murrumbeena Road, Murrumbeena |
40 |
Station Street, Carrum |
|
|
15 |
Poath Road, Hughesdale |
41 |
Balcombe Road, Mentone |
|
|
16 |
Centre Road, Clayton |
42 |
Charman Road, Cheltenham |
|
|
17 |
Clayton Road, Clayton |
43 |
Edithvale Road, Edithvale |
|
|
18 |
Mountain Highway, Bayswater |
44 |
Station St/Bondi Road, Bonbeach |
|
|
19 |
Scoresby Road, Bayswater |
45 |
Manchester Road, Mooroolbark |
|
|
20 |
Thompsons Road, Lyndhurst |
46 |
Maroondah Highway, Lilydale |
|
|
21 |
Melton Highway, Sydenham |
47 |
Clyde Road, Berwick |
|
|
22 |
Grange Road, Alphington |
48 |
Hallam Road, Hallam |
|
|
23 |
Lower Plenty Road, Rosanna |
49 |
South Gippsland Highway, Dandenong |
|
|
24 |
Bell Street, Preston |
50 |
Toorak Road, Kooyong |
|
|
25 |
High Street, Reservoir |
51 |
Park Road, Cheltenham(a) |
|
|
26 |
Skye Road, Frankston |
52 |
Mascot Avenue/Station Street, Bonbeach(a) |
(a) Additional level crossings identified for removal.
Source: VAGO, based on information provided by LXRA.
Appendix C. ALCAM 2008 metropolitan crossings list
Figure C1 is the ALCAM 2008 list of 50 metropolitan level crossing ranked from highest to lower risk.
Figure C1
ALCAM 2008 metropolitan crossings rank
|
1 |
Main Road, St Albans |
26 |
Heatherton Road, Noble Park |
|
2 |
Furlong Road, St Albans |
27 |
Charman Road, Cheltenham |
|
3 |
Bell Street, Coburg |
28 |
Clyde Road, Berwick |
|
4 |
Clayton Road, Clayton |
29 |
Toorak Road, Kooyong |
|
5 |
Macaulay Road, Kensington |
30 |
Hallam Road, Hallam |
|
6 |
Bell Street, Preston |
31 |
Swanpool Avenue, Chelsea |
|
7 |
Glenroy Road, Glenroy |
32 |
Racecourse Road, Pakenham |
|
8 |
Grange Road, Carnegie |
33 |
Koornang Road, Carnegie |
|
9 |
Cherry Street, Werribee |
34 |
Webster Street, Dandenong |
|
10 |
Union Road, Surrey Hills |
35 |
Tooronga Road, Malvern |
|
11 |
North Road, Ormond |
36 |
Chandler Road, Noble Park |
|
12 |
Aviation Road, Laverton |
37 |
Station Street, Bonbeach(a) |
|
13 |
Blackburn Road, Blackburn |
38 |
Skye Road, Frankston |
|
14 |
Buckley Street, Essendon |
39 |
Keon Parade, Keon Park |
|
15 |
Old Geelong Road, Hoppers Crossing |
40 |
Gaffney Street, Coburg North |
|
16 |
Mc Gregor Road, Pakenham |
41 |
South Gippsland Highway, Dandenong |
|
17 |
Riversdale Road, Camberwell |
42 |
Maidstone Street, Altona |
|
18 |
Ferguson Street, Williamstown |
43 |
Scoresby Road, Bayswater |
|
19 |
Lower Plenty Road, Rosanna |
44 |
Webb Street, Narre Warren |
|
20 |
Station Street, Fairfield |
45 |
South Road, Brighton |
|
21 |
Murray Road, Preston |
46 |
Main Street, Pakenham |
|
22 |
Station Street, Carrum |
47 |
High Street, Glen Iris |
|
23 |
Centre Road, Clayton |
48 |
Grange Road, Alphington |
|
24 |
Seaford Road, Seaford |
49 |
Corrigan Road, Noble Park |
|
25 |
Moreland Road, Brunswick |
50 |
Maroondah Highway, Lilydale |
(a) This site is one of the additional two sites and is not included in our analysis.
Note: Springvale Road, Nunawading; Springvale Road, Springvale; Mitcham Road, Mitcham and Kororoit Creek Road, Altona were removed prior to the LXRP and are not included in this list or in our analysis. Those highlighted in light blue are part of the LXRP.
Source: VAGO.
Appendix D. VicRoads 2013 priority list
Figure D1 is VicRoads' 2013 priority list of individual metropolitan crossing sites.
Figure D1
VicRoads' 2013 priority list
|
VicRoads 2013 high priority crossings |
VicRoads 2013 medium priority crossings |
VicRoads 2013 lower priority crossings |
|---|---|---|
|
Balcombe Road, Mentone |
Buckley Street, Essendon |
Anderson Road, Yarraville |
|
Blackburn Road, Blackburn |
Edithvale Road, Edithvale |
Aviation Road, Laverton |
|
Burke Road, Glen Iris |
Gaffney Street, Pascoe Vale |
Bear Street, Mordialloc |
|
Centre Road, Bentleigh |
Glenroy Road, Glenroy |
Bondi Road, Bonbeach |
|
Centre Road, Clayton |
Grange Road, Caulfield East |
Champion Road, Williamstown |
|
Chandler Road, Noble Park |
Heatherdale Road, Mitcham |
Chelsea Road, Chelsea |
|
Charman Road, Cheltenham |
Neerim Road, Caulfield East |
Corrigan Road, Noble Park |
|
Cherry Street, Werribee |
Park Road, Cheltenham(a) |
Highett Road, Highett |
|
Clayton Road, Clayton |
Westgarth Street, Northcote |
Hudsons Road, Spotswood |
|
Glen Huntly Road, Glen Huntly |
Lincoln Parade, Aspendale |
|
|
Glenferrie Road, Kooyong |
Lochiel Avenue, Edithvale |
|
|
Heatherton Road, Noble Park |
Maddox Road, Williamstown |
|
|
Koornang Road, Carnegie |
McDonald Street, Mordialloc |
|
|
Madden Grove, Richmond |
McKinnon Road, McKinnon |
|
|
Main Road, St Albans |
Mont Albert Road, Canterbury |
|
|
Melton Highway, Sydenham |
Parkers Road, Parkdale |
|
|
Murrumbeena Road, Murrumbeena |
Puckle Street, Moonee Ponds |
|
|
North Road, Ormond |
Ramsden Street, Clifton Hill |
|
|
Poath Road, Hughesdale |
Seaford Road, Seaford |
|
|
Union Road, Surrey Hills |
Station Street, Carrum |
|
|
Station Street, Fairfield |
||
|
Station Street, Seaford |
||
|
Webster Street, Dandenong |
||
|
Wickham Road, Moorabbin |
Figure D1
VicRoads' 2013 priority list—continued
|
VicRoads 2013 no priority crossings |
||
|---|---|---|
|
Abbott Street, Sandringham |
Charles Street, Northcote |
Greens Road, Dandenong South |
|
Abbotts Road, Lyndhurst |
Childs Road, Epping |
Greville Street, Prahran |
|
Albert Street, Brunswick |
Church Street, Brighton |
Grieve Parade, Altona |
|
Albion Street, Brunswick |
Civic Parade, Seaholme |
Hallam South Road, Hallam |
|
Allendale Road, Eltham |
Clarendon Street, Frankston |
Hampton Street, Hampton |
|
Alpine Street, Ferntree Gully |
Clyde Road, Berwick |
Heyington Avenue, Thomastown |
|
Arden Street, North Melbourne |
Coolstore Road, Croydon |
High Street, Glen Iris |
|
Argyle Avenue, Chelsea |
Cramer Street, Preston |
High Street, Reservoir |
|
Armstrongs Road, Seaford |
Dawson Street, Brunswick |
Hillcrest Road, Frankston |
|
Arthurton Road, Northcote |
Devon Road, Pascoe Vale |
Holden Road, Diggers Rest |
|
Ascot Vale, Road Flemington |
Diamond Street, Eltham |
Hope Street, Brunswick |
|
Bakers Road, Coburg North |
Donnybrook Road, Donnybrook |
Hopkins Road, Rockbank |
|
Barry Road, Campbellfield |
Dublin Road, Ringwood East |
Hutton Street, Thornbury |
|
Bay Street, Brighton |
Eel Race Road, Carrum |
Keon Parade, Reservoir |
|
Beavers Road, Thornbury |
Evans Road, Lyndhurst |
Kororoit Creek Road, Altona |
|
Bedford Road, Ringwood |
Exford Road, Melton South |
Latrobe Street, Cheltenham |
|
Bell Street, Coburg |
Fawkner Cemetery Entrance, Hadfield |
Leakes Road, Rockbank |
|
Bell Street, Preston |
Ferguson Street, Williamstown |
Linacre Road, Hampton |
|
Beveridge Road, Beveridge |
Ferris Road, Melton South |
Lower Grange Road, Alphington |
|
Boundary Road, Hadfield |
Fitzgerald Road, Sunshine West/Ardeer |
Lower Plenty Road, Rosanna |
|
Box Forest Road, Hadfield |
Furlong Road, St Albans |
Macaulay Road, Kensington |
|
Brunswick Road, Brunswick |
Gaffney Street, Coburg |
Macaulay Road, North Melbourne |
|
Brunt Road, Officer |
Galvin Road, Werribee |
Maidstone Street, Altona |
|
Calder Park Drive, Calder Park |
Giffard Street, Williamstown |
Maidstone Street, Altona |
|
Camms Road, Cranbourne |
Glen Eira Road, Ripponlea |
Main Hurstbridge, Rd Diamond Creek |
|
Camp Road, Campbellfield |
Golf Links Road, Baxter |
Main Street, Pakenham |
|
Cardinia Road, Pakenham |
Grange Road, Alphington |
Manchester Road, Mooroolbark |
Figure D1
VicRoads' 2013 priority list—continued
|
VicRoads 2013 no priority crossings |
||
|---|---|---|
|
Maroondah Hwy, Lilydale |
Park Street, Parkville |
Station Street (Mascot Avenue), Bonbeach(a) |
|
Marshall Street, Ivanhoe |
Paschke Crescent, Lalor |
Station Street, Lalor |
|
McGregor Road, Pakenham |
Paynes Road, Rockbank |
Sth Gippsland Hwy, Dandenong South |
|
Melba Avenue, Lilydale |
Pier Street, Altona |
Summerhill Road, Wollert |
|
Millers Road, Seaholme |
Poplar Road, Parkville |
Swanpool Avenue, Chelsea |
|
Moorooduc Hwy, Frankston |
Progress Street, Dandenong South |
Thompsons Road, Cranbourne West |
|
Moreland Road, Brunswick |
Prospect Hill Road, Camberwell |
Toorak Road, Kooyong |
|
Mountain Highway, Bayswater |
Racecourse Road, Pakenham |
Tooronga Road, Malvern |
|
Mt Cottrell Road, Melton South |
Railway Avenue, Ferntree Gully |
Troups Road, Rockbank |
|
Mt Derrimut Road, Deer Park |
Railway Road, Eltham |
Union Street, Brunswick |
|
Munro Street, Coburg |
Regent Street, Reservoir |
Union Street, Windsor |
|
Murray Road, Preston |
Reynard Street, Coburg |
Victoria Road, Northcote |
|
New Street, Hampton |
Riversdale Road, Camberwell |
Victoria Street, Brunswick |
|
New Street/Dendy Street, Brighton |
Robinsons Road, Deer Park |
Warrigal Road, Parkdale |
|
Normanby Avenue, Thornbury |
Robinsons Road, Frankston |
Watsons Rd, Diggers Rest |
|
Oakover Road, Preston |
Ruthven Street, Macleod West |
Wattletree Road, Eltham |
|
Officer South Road, Officer |
Scoresby Road, Bayswater |
Webb Street, Narre |
|
O'Hea Street, Coburg |
Settlement Road, Thomastown |
Werribee Street, Werribee |
|
Old Calder Hwy, Diggers Rest |
South Road, Brighton |
Wilson Road, Wattle Glen |
|
Old Geelong Road, Hoppers Crossing |
Station Street, Sunbury |
Woolton Avenue, Thornbury |
|
Overton Road, Seaford |
Station Street, Aspendale |
Yarralea Street, Alphington |
|
Park Street, Moonee Ponds |
Station Street, Beaconsfield |
|
(a) Additional level crossing removals.
Note: Level crossing sites included in the LXRP are highlighted blue.
Source: VAGO, based on data provided by VicRoads' strategic framework for the prioritisation of metropolitan level crossings.
Appendix E. Core quantifiable benefits
Figure E1 describes the quantifiable benefits and net present value (NPV), collectively referred to as the core cost–benefit analysis approach.
Figure E1
Benefits summary
|
Core quantifiable benefits |
Description |
2016 NPV $ million |
|---|---|---|
|
Travel time savings |
Includes changes in the journey times for private, business and freight vehicles across Melbourne's road network. |
1 898 |
|
Vehicle operating cost (VOC) savings |
Total VOCs include all running costs of the vehicle—depreciation, fuel, repairs and maintenance. |
362 |
|
Road travel reliability savings |
The removal of level crossings may have an impact on travel time reliability for road users by eliminated unpredictability of boom gates. |
546 |
|
Public transport user benefits |
A reduction in road congestion will improve travel times and reliability for bus passengers, as well as potentially causing some rail users to drive instead, and therefore alleviate crowding on trains. A number of new train stations will be built, or existing ones upgraded. |
899(a) |
|
Accident cost savings |
The removal of level crossings will eliminate a number of dangerous locations from the road network and may reduce the likelihood of risk‐taking behaviour along these roads. |
134(b) |
|
Resource cost corrections (RCC) savings |
RCCs are the difference between the overall social and user‐perceived costs of travel. For example, motorists perceive some of the costs of operating a vehicle, such as fuel, but do not necessarily perceive other expenses like depreciation. |
751 |
|
Cost of pollution |
Different transport modes result in different production of environmental emissions, such as air pollution and greenhouse gas emissions, changes in travel patterns may cause changes in network-wide emissions. |
0.03 |
|
Residual value—replacement cost |
Benefits are based on a 50-year evaluation period. Beyond this LXRP assets will still provide services to transport users. The residual value of the benefits to be derived from level crossing removals at the end of the 50‐year evaluation period has been estimated as the discounted value of the assets at the end of the period. |
128 |
|
Construction disruption cost |
During construction, there will be times requiring road and rail line closures. Road diversions and/or provision of replacement bus services but this may mean that journey times are longer. At other times, roads or rail lines may operate with reduced levels of service. |
-57(c) |
|
Wider economic benefits |
Wider economic benefits are productivity impacts that a standard CBA does not adequately cover. Analysis of wider economic impacts attempts to capture the broader impacts of a project including the effects of connectivity, land development and business logistics improvement on productivity and output. |
554(d) |
(a) Public transport user benefits is made up of public transport user benefits ($141 million), station improvement benefits ($466 million) and interchange improvement benefits ($292 million).
(b) Accident cost savings is made up of direct level crossing relating collision reduction ($145 million) offset by an estimated increase in other road incidents due to higher vehicle kilometres travelled (-$11 million).
(c) Construction disruption disbenefit comprises disruption to rail passengers ($39 million) and disruption to road users ($18 million).
(d) The figure in the table includes agglomeration benefits ($420 million), increased labour supply ($82 million), and imperfectly competitive markets ($52 million).
Source: VAGO from information provided by LXRA.
Appendix F. Contract models
Figure F1 shows the break-up of initial and additional works, for each package.
Figure F1
Contract structure
|
Package |
Initial or additional works |
Level crossing sites |
|---|---|---|
|
North Eastern |
Initial |
Grange Road, Alphington |
|
Additional |
Bell Street, Preston |
|
|
North Western |
Initial |
Camp Road, Campbellfield |
|
Additional |
Bell Street, Coburg |
|
|
Western |
Initial |
Kororoit Creek Road, Williamstown |
|
Additional |
Abbotts Road, Dandenong South |
|
|
Southern |
Initial |
Seaford Road, Seaford |
|
Additional |
Balcombe Road, Mentone |
Note: Additional site packages not yet awarded.
Source: VAGO, based on information provided by LXRA.
Appendix G. Benefits framework
Figure G1 shows the measures and targets for each of the LRXP's benefits.
Figure G1
Benefits framework
|
Measure (KPI) |
Target |
|---|---|
|
Improved productivity from more reliable and efficient transport networks |
|
|
Travel time in minutes from specified origin to destination during a specified time period through the level crossing |
100% of sites will have an improvement in travel time following removal of level crossings. |
|
Increased vehicle, pedestrian and cyclist throughput per hour in a defined area around the level crossing |
100% of sites will have increased throughput of vehicles, cyclists or pedestrians following removal of level crossings. |
|
Standard deviation of travel time from specified origin to destination during a specified time period through the level crossing |
100% of sites with boom gate closures of more than 25% of the AM peak will have an improvement to the reliability of travel time following removal of level crossings |
|
Average variability in train punctuality directly attributable to the level crossing |
100% of sites will have an elimination of passenger weighted minutes as a result of signal faults at the level crossing following removal of level crossings. |
|
Percentage of line grade separated as a result of the LXRP |
Dandenong: 100%, Belgrave: 44%, Lilydale: 44%, Hurstbridge: 13%, Pakenham: 55%, Cranbourne: 73%, South Morang: 11%, Upfield: 13%, Craigieburn: 29%, Glen Waverley: 33%, Sunbury: 38%, Altona Loop: 17%, Williamstown: 25%, Werribee: 27%. |
|
Road based public transport service punctuality in a defined area around the level crossing |
100% of sites with road based public transport will have improved punctuality of road based public transport (i.e. an increase in the number of services that are on time) following removal of level crossings. |
|
Access to labour markets for National Employment Clusters that are constrained by the level crossing |
100% of National Employment Clusters will have improved access to labour markets following the removal of level crossings. |
|
Better connected, liveable and thriving communities |
|
|
Percentage of community satisfied with local amenity as a result of the level crossing removal |
At least 60% of survey respondents at each site are satisfied with the changes as a result of the level crossing removal. |
|
IDOs as a result of the level crossing removal |
All sites identified with IDOs at the Project Proposal stage will achieve an increase in residential units and/or lettable retail/business floor space. |
|
Average time to access employment from different locations as a result of the level crossing removal |
100% of sites will improve access to jobs, education, and services. |
|
Access to local activity centres and major services within a specified number of minutes as a result of the level crossing removal |
100% of sites will have improved access to local activity centres and major services. |
|
Distance and travel time between collection and drop off points in a defined area around the level crossing |
100% of sites have reduced distance and/or travel time between collection and drop off points. |
|
Safer communities |
|
|
Number of near miss incidents, fatal and serious injury crashes in a defined area around the level crossing |
100% of sites have zero crashes and near miss incidents involving trains as a result of the level crossing removal. No negative safety outcomes as a result of the level crossing removal works. |
|
Improved ALCAM risk score at the level crossing |
100% of sites have an ALCAM risk score of zero. |
Source: VAGO, based on information provided by LXRA.