Results of 2022 Audits: Universities
Data dashboard
Data dashboard
Click here to view the dashboard full screen
Dashboard data
Click the links below to download CSV copies of the following datasets:
- Universities financial data 2018–2022
- Universities indicators data 2018–2022
- Universities non-financial data 2018–2022
Key facts

Source: VAGO.
1. Audit outcomes
We gave clear audit opinions for financial reports across the Victorian university sector. Parliament and the community can confidently use these reports.
Financial reports are reliable
The university sector
There are 8 universities and 44 controlled entities* in the Victorian university sector (as at 31 December 2022).
We audit their financial reports. They all prepared a report for 2022.
See Appendix B for more information about the sector, including its annual reporting timelines and requirements.
*Refer to the glossary in Appendix D for more information.
Number of clear audit opinions
To date, we have issued 36 clear audit opinions across the sector for 2022, which Figure 1 shows.
Figure 1: Clear audit opinions we issued for 2022

Source: VAGO.
This means Parliament and the community can confidently use these reports.
Clear opinion
A ‘clear’ or ‘unmodified’ audit opinion means we have reviewed an entity's financial report and believe it is reliable and complies with relevant reporting requirements.
Audits still in progress
As at 1 June 2023, 16 audits of controlled entities' financial reports are still in progress for 2022.
See Appendix E for more information about these audits.
We have not included these entities in our analysis for 2022.
Universities met their reporting timeframes
Reporting timeframes
Under the Financial Management Act 1994, universities have 8 weeks from the end of the year, or 'balance date', to give us their draft financial report to audit.
Under their universities' enabling legislation, controlled entities need to give us their draft financial report within 3 months of their balance date for audit.
Universities' timeliness
As Figure 2 shows, all universities gave us their 2021 and 2022 draft financial reports within the 8 week deadline.
Figure 2: Timeliness of universities' financial reporting in 2021 and 2022
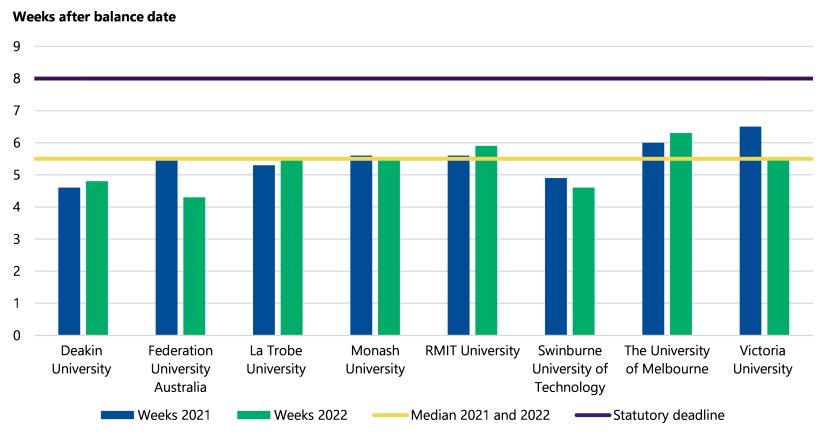
Note: The medians for 2021 and 2022 were the same, and are presented as one line in the above figure.
Source: VAGO.
Controlled entities' timeliness
Thirty-two out of 44 controlled entities gave us their draft financial reports within the 3-month deadline.
This was partly because universities diverted their resources to make sure the financial reports of the universities were prepared within the deadline, ahead of focusing on the subsidiary entities.
The financial reports of 11 controlled entities are still being prepared and we are still auditing the financial reports of 5 others.
Financial reports were good quality
Material and immaterial errors
The nature, number and size of errors in financial reports submitted for auditing are measures of their quality and the effectiveness of the systems and processes used to compile them. During an audit we sometimes find an item that an entity has not prepared in line with relevant reporting requirements.
We classify these items as either material or immaterial errors.
|
If an error is ... |
Then ... |
|---|---|
|
material |
the entity needs to adjust, or correct, it before we can issue a clear audit opinion. |
|
immaterial |
we recommend the entity corrects it, but we can still issue a clear audit opinion without it being corrected. |
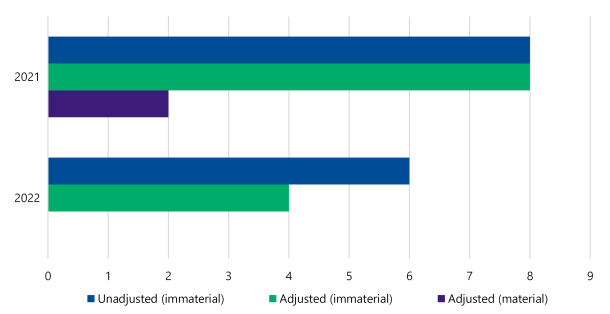
We did not find any material errors in 2022.
As Figure 3 shows, this is an improvement from 2021, when we found 2 material errors at Federation University Australia. This shows improvements in how universities prepare and review their draft financial reports, ensuring a higher level of quality before they provide them to audit.
We found only 10 immaterial errors in 2022 compared to 16 in 2021. Of the immaterial errors found in 2022, universities corrected 4 and left 6.
Figure 3: Errors we found in 2021 and 2022
Source: VAGO.
Causes of errors
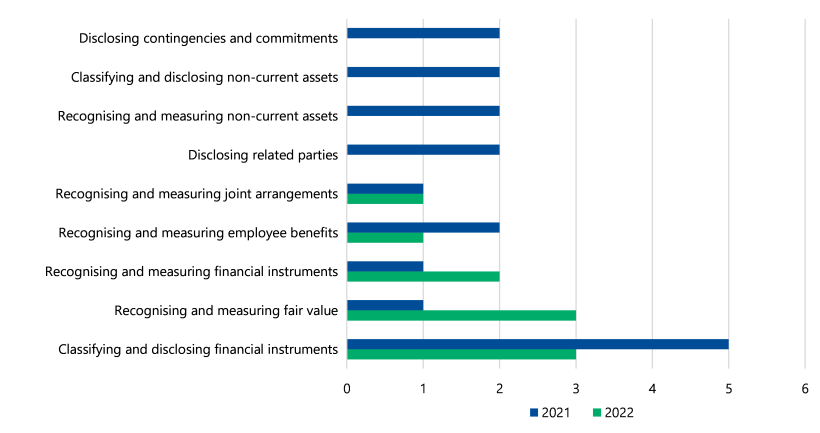
Figure 4 shows the number of errors we found by category for 2022 and 2021.
As the figure shows, accounting for financial instruments continued to be a common cause of error in universities' financial statements for 2022.
Financial instruments
Financial instruments are assets and liabilities created by contracts or agreements between 2 parties. It represents a form of ownership of a party, or a future cashflow between the 2 parties. Shares, bonds, trade payables, and borrowings are all examples of financial instruments.
Financial assets that are held for income generation or capital gain are commonly called 'investments'.
We also found more fair value accounting errors.
We usually find errors in these areas because the sector has $8.1 billion invested in financial instruments – and accounting for financial instruments and their fair values is complex.
Fair value accounting
Fair value accounting is when an entity values an asset based on its current price in the market. The entity also needs to consider how future events and conditions could affect the asset's value.
Figure 4: Errors we found by category for 2021 and 2022
Source: VAGO.
2. Financial analysis
The sector’s financial performance declined in 2022. International student numbers continued to drop and, for the first time since 2019, domestic student numbers followed. On-campus operations opened post pandemic, driving expenditure up.
Student course fees and charges stay well below pre-pandemic levels and expenditure above. Declining investment values also significantly affected financial performance.
Despite these negative trends, universities focused on growing commercial and partnership activity, leading to higher own-sourced revenue.
Strong financial and non-financial asset portfolios remain.
The sector is still recovering from the disruption of the pandemic, with new challenges ahead due to political and economic pressures. Longer-term financial risks will emerge if universities cannot manage these challenges.
Universities performed worse financially compared to last year
Financial performance snapshot
As Figure 5 shows, universities had a net deficit of $0.52 billion in 2022.
This is a $1.77 billion decline from their $1.25 billion net surplus in 2021.
Figure 5: Universities' total revenue and expenses in 2022

Note: Totals may not add due to rounding.
Source: VAGO.
|
In 2022 the sector reported … |
Which is a … |
From … |
Because … |
|---|---|---|---|
|
$11.0b in revenue and income* |
3.5% decrease |
$11.4b in 2021 |
universities had lower student revenue and investment income. |
|
$11.5b in expenses |
12.7% increase |
$10.2b in 2021 |
|
|
$1.3b in operating cashflows* |
35.0% decrease |
$2.0b in 2021 |
|
*Refer to the glossary in Appendix D for more information.
Net result margin
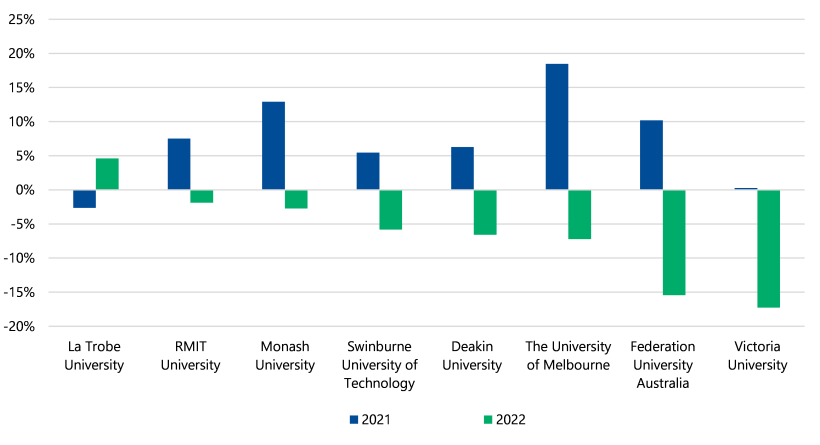
Figure 6 shows all universities recorded deficits for 2022 except La Trobe University. La Trobe University's surplus can be substantially attributed to a significant philanthropic gift of $42 million it received for autism research.
If we exclude unrealised fair value losses recognised in its income statements, the sector would have had an $84 million surplus, a net result margin of only 1 per cent.
Net result margin
An entity's net result is its revenue and income minus its expenses. The net result margin is the net result divided by total revenue and income.
A positive result shows a surplus, and a negative result shows a deficit. The larger the percentage, the stronger the result.
This measures how efficiently entities earn and spend their revenue and income.
Figure 6: Universities' net result margin indicators for 2021 and 2022
Source: VAGO.
Deficits
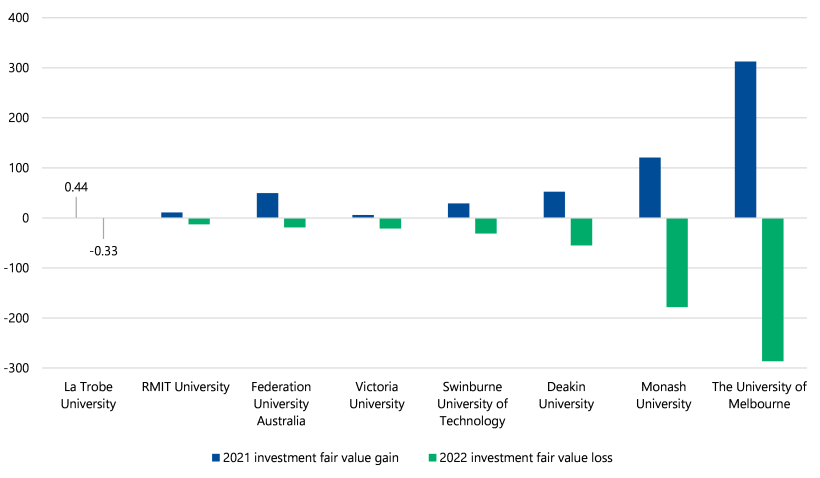
The sector recorded a combined deficit of $520 million in 2022. This is mostly because universities' investment portfolios fell in value. The gains-to-loss swing from a $582 million gain in 2021 to $604 million loss in 2022 is a $1.19 billion difference year on year. As Figure 7 shows, this swing was consistent across all universities.
Figure 7: Universities' investment fair value gains and losses for 2021 and 2022 ($ million)
Source: VAGO.
Universities got less revenue and income from students but more from other sources
Overview of revenue and income sources
As Figure 8 shows, universities continued to get most of their revenue and income from student enrolments in 2022. This includes Australian Government student grants and student course fees and charges.
Student revenue
Student revenue is revenue that a university gets from running courses.
Most of this revenue is fees and charges from international students and Australian Government student grants for 'Commonwealth-supported places'.
A Commonwealth-supported place is when the Australian Government pays for part of a student's course fees.
Figure 8: Types of revenue and income universities got from 2018 to 2022 as a percentage of total revenue and income
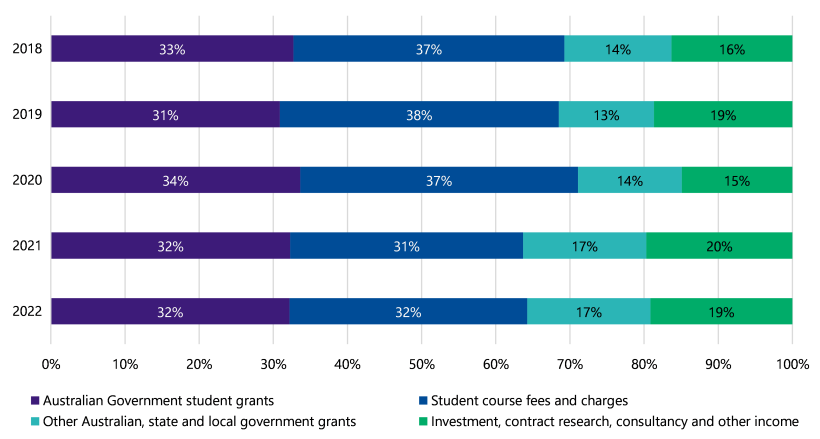
Note: Percentages may not total 100 due to rounding.
Source: VAGO.
Student revenue
International student numbers have been steadily falling since COVID-19 border closures. But domestic student numbers had been increasing over the same period.
2022 is the first time since 2019 that domestic student numbers have gone down.
|
In 2022 the equivalent full-time student load (EFTSL) for … |
Was … |
Which is a decrease of … |
|---|---|---|
|
domestic students |
200,170 |
18,015, or 8.3%, from 218,185 in 2021. |
|
onshore international students |
72,309 |
1,758, or 2.4%, from 74,067 in 2021. |
|
offshore international students |
34,472 |
1,611, or 4.5%, from 36,083 in 2021. |
As a result, student course fees and charges, which universities mainly get from international students, are still well below pre-COVID-19 levels. In 2022 they got $3.40 billion, a decrease of 2 per cent compared to $3.47 billion in 2021. This is a 17 per cent decrease from the $4.11 billion in 2019.
Universities received more Australian Government funding per domestic student in 2022; however, the decrease in revenue was due to the lower number of students.
Other revenue and income sources
While universities' investments went down in value, the dividends, interest and trust distributions from these investments stayed strong. These returns increased from $306.1 million in 2021 to $448.6 million in 2022. Financial performance over a year affects investment returns, and with strong profits generated by businesses in 2021 and 2022, this led to higher investment returns. However, the economic climate and market attitudes at the end of the year drive the value of the overall investment. With high inflation, higher interest rates and world political conditions, market views were gloomier at the end of 2022 driving the fair value losses previously explained.
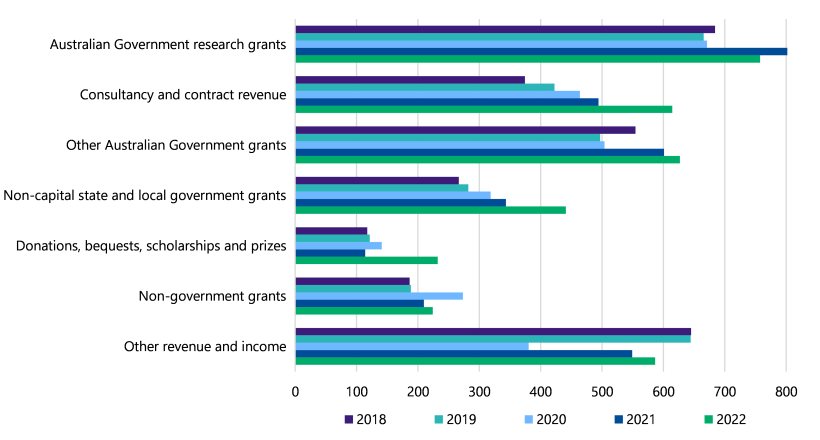
Universities also got more revenue from other sources. They received $614 million of funding for consultancy and contract research in 2022 – an increase of $120 million from the $494 million in 2021. This compares to $423 million in 2019, an increase of $191 million, as universities have partnered with industry and governments as part of their broader strategy to diversify revenue streams in managing the impacts of falling student revenue.
As Figure 9 shows, universities got $1.83 billion in non-student related Australian, state and local government grants in 2022. This is $70 million lower than $1.90 billion in 2021. But it is $390 million more than the $1.44 billion they got in 2019 before COVID-19.
Universities also got significant donations, bequests and scholarships. They got more than $232 million in 2022. This is a large increase from the $114 million in 2021.
Figure 9: Universities' non-student-related revenue by category from 2018 to 2022 ($ million)
Source: VAGO.
Revenue received in advance
Despite the declines in revenue, universities received significant up-front funding in 2022 for services they will provide in 2023. At 31 December 2022, universities received $2.42 billion in cash from students and other parties, for which they will provide the service related to that income in 2023 or the years following. Universities recognise this funding as a liability on the balance sheet and they therefore do not reflect it in the revenue received for 2022 and it does not affect their net deficit result. This is a 147 per cent increase from $979 million received in up-front funding in 2019 before COVID-19.
Universities spent more in 2022 returning to in-person teaching and expanding their services
Overview of expense sources
Universities spent more in 2022. This was because:
- they continued to spend a lot on employee benefits
- their investments went down in value
- they reopened fully for in-person teaching, which meant they spent more on utilities and other expenses to run their campuses
- they spent more on contracted and professional services, agent fees and partnership costs to diversify their revenue sources.
Overall, the sector spent $10.91 billion in 2022 (excluding losses from the value of their investments). This is a:
- 7 per cent increase from $10.20 billion in 2021
- 6 per cent increase compared to $10.30 billion of expenses incurred in 2019 before the pandemic.
Employee benefits
Universities continued to spend the most money on employee benefits in 2022.
These costs were higher than their other types of spending combined.
Despite this, universities spent less per full-time equivalent (FTE) employee. In 2022 they spent $153.3 per FTE position, which is 3.3 per cent less than $158.6 spent per FTE position in 2021.
|
In 2022 the sector … |
Compared to … |
Which is a … |
|---|---|---|
|
spent $5.90b on employee wages and other benefits |
$5.76b in 2021 |
$0.1b, or 2.4%, increase. |
|
had 38,468 FTE positions at 31 December 2022 |
36,319 FTE positions at 31 December 2021 |
2,149, or 5.9%, increase. |
Unrealised fair value losses
Universities have significant investments, such as shares and managed funds, that they recognise in financial reports at fair value.
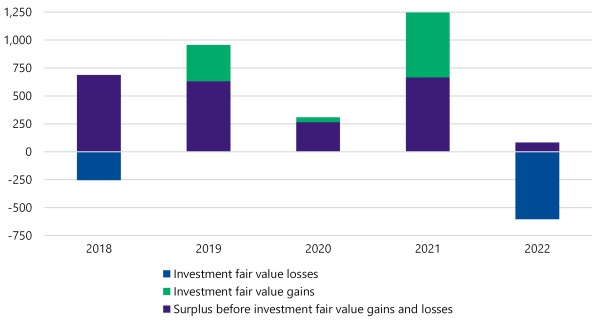
Universities recorded $603.9 million of unrealised fair value losses on these investments in 2022. This compares to their $581.8 million of unrealised fair value gains in 2021. But if universities keep these investments, they will record any increases in value as income in future years.
Figure 10 shows how unrealised fair value changes affected universities' net results from 2018 to 2022. The volatility of investment markets can significantly affect universities' financial outcomes from year to year due to the unrealised gains and losses being recognised directly within their comprehensive operating statement. In 2022, they were a key driver to the sectors net deficit position.
Figure 10: The sector's net result before and after unrealised fair value gains or losses on investments ($ million)
Source: VAGO.
Unrealised fair value losses
Universities can choose to record fair value changes for some investments in their net result when they happen or when they sell the asset.
Most universities record fair value changes within their net result for the year. They do this even if they have not sold the investment. This means their net result is susceptible to fair value changes each year.
When an investment's fair value goes down, but a university has not sold it, it is called an 'unrealised fair value loss'.
Other types of expenses
Universities partnered with other entities to broaden their services and diversify their revenue sources, such as partnerships with microcredential course providers and online course delivery providers.
As Figure 11 shows, universities spent $946.6 million on partnership, agent, contracted and professional services costs in 2022. This is a $115.9 million, or 14 per cent, increase from $830.7 million in 2021.
In 2022 students returned to campuses, and staff started going to training and conferences in person again. So, universities' costs associated with staff, students and travel increased by $132 million.
Figure 11: Universities' expenses in 2021 and 2022 by type excluding employee benefits ($ million)
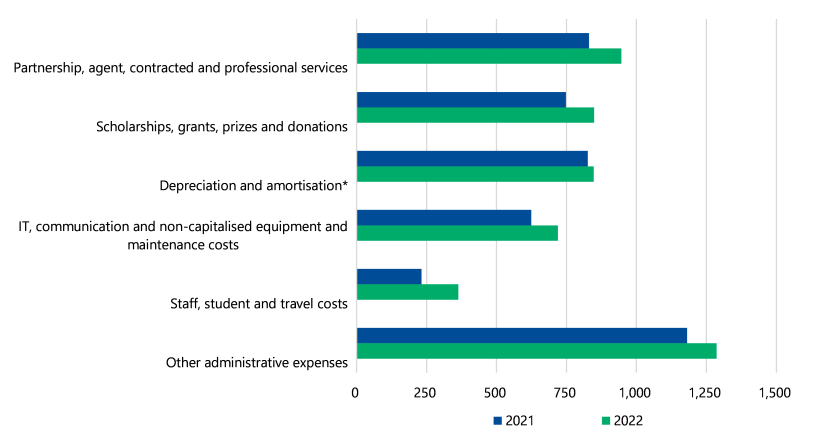
Note: *Refer to the glossary in Appendix D for more information.
Source: VAGO.
Universities used cash and debt to buy new assets and make investments
Financial position snapshot
As Figure 12 shows, the sector had $32.7 billion in assets and $10.4 billion in liabilities as at 31 December 2022.
Land and buildings make up a significant part of universities' assets, and the value of their land and buildings went up in 2022.
While the fair value of their investments went down, investments went up overall due to new investments purchased during the year.
To fund this, universities used cash they had saved, and took on more debt or lease liabilities (for investments into land, buildings and equipment).
Lease liabilities
Leases are contractual arrangements granting the right to use an asset in exchange for payments over an agreed period. The value of payments owed under these arrangements are lease liabilities.
Universities have also been getting more revenue from students and research funding in advance. In 2022 this has become their second largest liability. Universities will record these amounts as revenue when they deliver the tuition in the next year.
Figure 12: Universities' total assets and liabilities in 2022

Note: Totals may not add due to rounding.
Source: VAGO.
|
In 2022 the sector reported … |
Which is a … |
From … |
|---|---|---|
|
$32.7b in assets |
4.1% increase |
$31.4b in 2021. |
|
$10.4b in liabilities |
13.0% increase |
$9.2b in 2021. |
|
$2.71b in cash outflow for investing* |
176.5% increase |
a $0.98b outflow in 2021. |
|
$0.32b in cash inflow from financing* |
155.2% increase |
a $0.58b outflow in 2021. |
Note: Cash inflow means more cash was received than paid, cash outflow means more cash was paid than received.
*Refer to the glossary in Appendix D for more information.
Borrowings and lease liabilities
Universities' total liabilities went up in 2022. The largest increases related to borrowings and lease liabilities.
Some universities paid down existing borrowings. But in total the sector borrowed a further $518 million after making their 2022 repayments. Combined with new leases, the sector's total debt increased by $730 million to $3.74 billion from $3.01 billion in 2021.
Group of Eight (Go8) universities borrowed an additional $700 million in 2022. Their borrowings increased to $1.99 billion from $1.29 billion in 2021. The rest of the sector decreased their borrowings by $190 million, from $564 million in 2021 to $374 million in 2022.
On the other hand, Go8 universities decreased their lease liabilities by $22 million, from $885 million in 2021 to $863 million in 2022. The rest of the sector increased their lease liabilities by $237 million, from $271 million in 2021 to $508 million in 2022.
The Go8 universities can obtain borrowings at lower interest rates, including from foreign markets, due to their stronger credit ratings as compared with smaller universities. The rest of the sector use lease liabilities, as they are guaranteed over the asset obtained, allowing them to access lower interest rates compared with what they would be able to access via borrowings through financial markets. However, leases can only be used to obtain tangible assets such as land, buildings and equipment – this means that Go8 universities have a distinct advantage, as they have more choice when using the cash gained from borrowings (such as buying investments).
While universities’ total borrowings and lease liabilities went up overall, their finance and interest expenses stayed the same at $140 million for 2021 and 2022.
Land, buildings, equipment and intangible assets
In 2022 universities invested in land, buildings, equipment and intangible assets using borrowings, leases, existing cash reserves, and funding from revenue and income received in advance.
As Figure 13 shows, universities spent $881 million on new assets in 2022. This is $114 million more than they spent in 2021. But it is still lower than the $1.44 billion they spent in 2019 before COVID-19.
Figure 13: Universities’ cash payments for land, buildings, plant, equipment and intangibles from 2018 to 2022 ($ million)
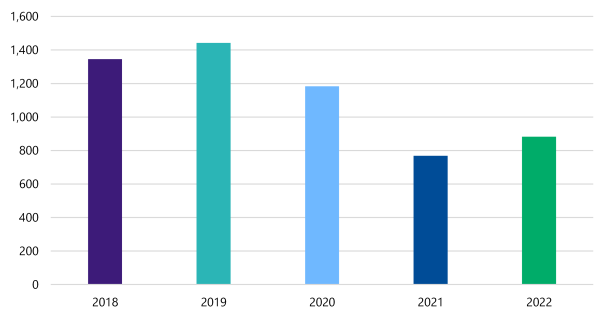
Source: VAGO.
Universities’ existing land and buildings also continued to go up in value in 2022.
After accounting for depreciation and amortisation, universities’ overall land, buildings, plant, equipment and intangible assets were worth $820 million more in 2022, increasing to $20.18 billion from $19.36 billion in 2021.
Investments
The sector put $2.08 billion of cash into investments in 2022, such as managed funds and term deposits.
Of this, Go8 universities invested cash of $1.84 billion. Despite the fair value losses, total investments were $6.01 billion, which is a $1.36 billion increase from $4.65 billion in 2021.
Despite spending cash of $237 million on new investments, the total value of the rest of the sector’s investments went down by $17 million. This is because the value of the rest of the sector’s existing investments went down relatively more.
Cash balances
Universities’ cash had been gradually increasing since the start of the pandemic. Their total cash on hand went up from $1.48 billion in 2019 to $2.37 billion in 2021. But it went down to $1.33 billion in 2022.
This is because universities invested existing cash and new cash received in 2022 on $2.71 billion of tangible and intangible assets, and investments. This is more than they spent on investments in 2020 and 2021 combined ($2.32 billion across the 2 years).
Universities had been keeping cash surpluses from previous years. This is because they were expecting lower revenue from falling student enrolments.
With borders reopening, classes returning to in-person and inflation affecting the real value of cash, universities are now using these funds to invest in their own services.
Liquidity
Universities recorded deficits across the sector because the value of their investments went down. But they have enough cash and liquid investments to sustain themselves into the future.
While they spent more of their cash on hand in 2022, they put the most of it into liquid investments.
As Figure 14 shows, all universities except La Trobe University kept their adjusted liquidity ratio above one in 2022.
La Trobe University's ratio was below one because it:
- implemented a liquidity strategy to use any surplus cash to pay down debt
- had some short-term debt maturing within 12 months of balance date.
This reduced its cash balance and increased its current liabilities, which impacted the ratio.
Revenue and income in advance affected some universities' liquidity ratios.
Adjusted liquidity ratio
A liquidity ratio measures if an entity can likely pay its liabilities in the immediate future using cash and short term assets. An entity's adjusted liquidity ratio also includes its non-current investments.
Figure 14: Universities' adjusted liquidity ratios for 2021 and 2022
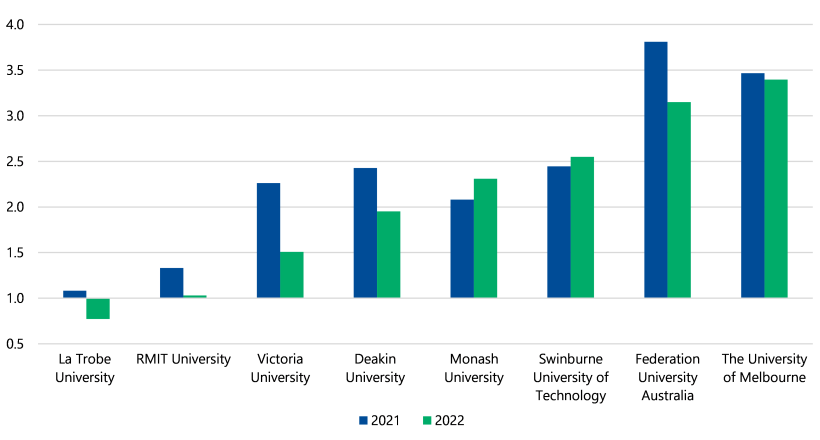
Source: VAGO.
Universities face challenges to their sustainability, but opportunities exist
Challenges
Universities face challenges that could put their future sustainability at risk, including continued:
- low net result margins
- fair value losses
- falling student numbers.
These challenges limit the accumulation of retained profits that can be used to fund operating and growth activities.
Falling student numbers
In 2022 the sector's student revenue was the lowest it has been in 5 years, with the high point being $7.71 billion in 2019. This is because, as explained previously, there were fewer domestic Australian-Government-supported students and international fee-paying students in 2022.
There are several challenges that continue to put pressure on student enrolments:
- A strong jobs market, combined with the rising cost of living may continue to cause students to move away from enrolling at university:
- high availability of jobs means would-be students can gain well-paid employment without needing to attend university beforehand
- increasing cost of living pressures mean the course cost is a much more crucial factor considered when students decide to study. Australia's ongoing rental crisis is adding more focus on these costs, particularly for international students.
- Domestic students are facing increased prices for courses at universities, as the rising consumer price index (CPI) has resulted in larger increases in Higher Education Loan Program (HELP) loans – this may deter would-be students or existing students from university.
- 84.5 per cent of students completed year 12 in 2022 according to the Australian Bureau of Statistics. This is a 5-year low. It means fewer Australian students may be eligible to enrol in university now and into the future.
- Chinese residents make up 36 per cent of all international students according to the Australian Department of Education's 2021 Higher Education Statistics. In the longer term, Chinese residents may become a decreasing source of student revenue for universities into the future as the Chinese government is working to further develop and prioritise the quality of their own higher education system.
Student revenue is crucial to Victorian universities' ongoing sustainability. So, universities need to keep their courses attractive to both domestic and international students. They must focus on relevance, access, price and employment outcomes to maintain and grow their student base.
Opportunities
Despite these challenges, the sector has opportunities to improve its sustainability.
In 2022, universities diversified their revenue streams. They also prepared for the future by investing in either physical infrastructure, which they use to deliver core services, or investments, which significantly supplement their income.
In addition, they successfully managed employee benefits, which is their largest expense. While all their other expenses grew 26.5 per cent in 2022, salaries and wages grew by only 2.4 per cent.
While the sector had fewer international students overall, not all universities recorded a decrease.
|
In 2022 … |
Recorded a … |
Which led to a … |
|---|---|---|
|
Swinburne University of Technology |
21.4% increase in international EFTSL |
$28.1 million increase in revenue from student course fees and charges. |
|
Victoria University |
8.9% increase in international EFTSL |
$3.1 million increase in revenue from student course fees and charges. |
Whereas China may become a decreasing source of students for Victoria into the future, the World Economic Forum notes that India has become home to the largest population of young adults worldwide, and projects that India will become the world’s largest middle-class market by 2030. Wealthier middle-class students may look to travel abroad for their education and be an increasing source of international student revenue for Victorian universities.
Universities are also working more closely with industries. In 2022 their revenue from consulting, contract research and grants from non-government entities increased by 49.6 per cent compared to 5 years ago, to $839 million in 2022 from $561 million in 2018. Universities can continue to focus on these relationships to further increase revenue from these sources.
Government partnerships and reviews
There are 2 reviews being undertaken in 2023 that may affect the sector’s funding and future financial sustainability.
In 2021 the Victorian Government set up partnership agreements with Victorian universities. These agreements reflect their ongoing and evolving approach to working together.
The government plans to revisit these agreements in 2023. It plans to focus on initiatives to:
- improve how universities partner and collaborate with industry
- increase university courses’ industry relevance, including through partnerships with TAFEs.
These revised agreements may create new opportunities for universities to partner with other Victorian government entities (such as TAFEs) and create new or broader revenue sources using their access to industry partners.
In 2022, the Australian Minister for Education formally announced a major review of Australia’s higher education sector. This review is known as the Australian Universities Accord.
The Accord will assess:
- if universities meet Australia’s knowledge and skill needs now and in the future
- access to university and opportunities for potential students
- if universities are affordable and what they are investing in
- universities' governance, accountability and communities
- the connection between the vocational education and training and higher education systems
- universities' quality and sustainability
- how universities are delivering new knowledge, innovation and capability.
The terms of reference for the Accord are broad and the Accord's aim is extensive. The Accord's overall objective is to 'devise recommendations and performance targets that will improve the quality, accessibility, affordability and sustainability of higher education'.
The results of the Accord may have significant impacts on universities' courses, funding and operations in the future. We encourage Victorian universities and the Victorian Government to keep engaging with this process to advocate for themselves and the sector.
3. Internal controls
Universities' internal controls are adequate for them to prepare reliable financial reports. But they have not resolved some key information technology (IT) issues. These issues could prevent universities from preparing reliable financial reports or protecting their sensitive data.
We found fewer new control issues in 2022 but there are still unresolved issues from previous years
Internal control snapshot
Universities must have effective internal controls to keep proper accounts and records. These controls should cover people, systems and processes.
We assess if universities’ internal controls allow them to prepare reliable financial reports.
Overall, universities’ internal controls are adequate. But there are areas for improvement.
Raising internal control and financial reporting issues
We raise internal control and financial reporting issues to a university's management and audit committee. This includes:
- reporting new issues
- giving updates on unresolved issues we raised in previous years.
Universities can strengthen their internal controls and financial reporting processes by promptly responding to the issues we raise.
While universities need to address all weaknesses, they should prioritise higher-risk and unresolved issues.
New issues we found in 2022
As Figure 15 shows, we found 10 new control issues in 2022 compared to 13 in 2021.
IT control weaknesses continue to be the most common type of issue. We found some weaknesses in the key IT systems that universities use to record accounting information and prepare financial reports.
But universities have been improving in this area. We found 7 new IT control issues in 2022 compared to 12 new issues in 2021.
We also found other financial reporting related issues in 2022, including weaknesses in:
- how universities account for fixed assets
- how universities account for intangible assets
- financial reporting timeliness.
But these issues were relatively minor.
Unresolved issues
As Figure 15 shows, universities had 4 unresolved issues in 2022 compared to 5 in 2021.
We are concerned there are still some longstanding issues that universities had not yet resolved.
IT-related issues can take time to resolve. Especially if a university needs to work with a system's supplier to address them. But it is important that they resolve these issues as soon as possible to ensure the protection and reliability of the data in these systems.
Figure 15: New and unresolved issues from 2018 to 2022
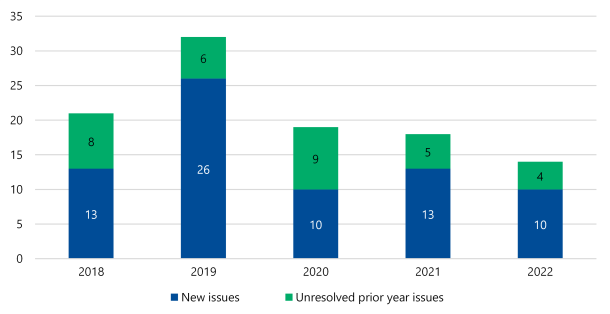
Source: VAGO.
IT control weaknesses
Why IT controls are important
IT controls help prevent and detect errors in financial information. Universities use modern IT systems for many processes such as authorising purchases or paying employees. By having strong IT controls, universities can be sure around the:
- accuracy of transactions recorded in the IT system
- precision of calculations made by the IT system
- reliability of reports created from the IT system
- confidentiality and security of the data stored in the IT system.
In its Annual Cyber Threat Report July 2021–June 2022, the Australian Cyber Security Centre (ACSC) said:
- 'the education and training sector reported the most ransomware incidents in 2021–22'
- 'the threat to the education and training sector is significant as its business model favours open collaborative environments'.
So, universities also need strong IT controls to prevent and detect malicious access to their IT systems.
IT issues we found in 2022
When we assess if universities’ internal controls allow them to prepare reliable financial reports, we consider IT controls for the key systems they use to store financial information or produce their financial reports.
As Figure 16 shows, in 2022:
|
The IT control issues we found mainly related to … |
Which involves … |
|---|---|
|
managing access for general users and privileged users |
universities' policies and processes for which users have access to a system. Universities need strong controls for users with privileged access because they can often make significant changes to a system or database. |
|
managing changes to the configuration of systems |
how a university manages changes to a system. This includes:
|
|
audit logging and monitoring |
how a university records changes to key parts of a system. For example, changes to a dataset or vendor's details. It also involves checking these records, or 'logs'. Monitoring logs can help a university identify:
|
ACSC's report said that 'inadequate patching' caused 'the majority of significant incidents ACSC responded to in 2021–22'.
Pleasingly, we found no new or unresolved patching issues at universities in 2022.
Figure 16: Medium and high-risk IT and other control issues we identified by type in 2021 and 2022
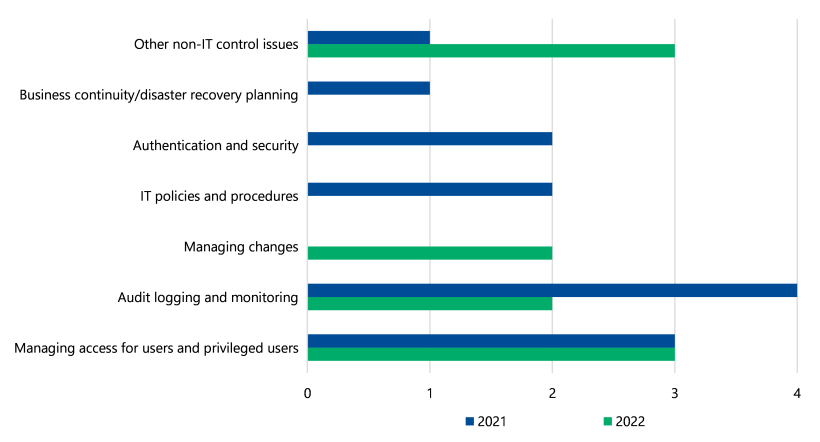
Note: We excluded low-risk issues because we consider them as minor or opportunities to improve controls.
Source: VAGO.
Essential Eight strategies
According to ACSC's website, 'no set of mitigation strategies are guaranteed to protect against all cyber threats'.
But ACSC recommends that organisations implement 8 essential IT security strategies as a baseline. We have made similar recommendations in our Results of Audits reports for other sectors, and we support the position of the ACSC on this matter.
This baseline, which is known as the Essential Eight, makes it much harder for people to compromise a system.
The Essential Eight strategies are:
- application control
- patch applications
- configure Microsoft Office macro settings
- user application hardening
- restrict administrative privileges
- patch operating systems
- multi-factor authentication
- regular backups.
Using the Essential Eight strategies can help universities protect staff, student and other sensitive data better.
We did not find any weakness that directly related to most of the Essential Eight strategies listed above; however, we did find 3 issues related to users' and privileged users' access in both 2022 and 2021. We encourage universities to address these issues as priority and continue to assess their maturity against the Essential Eight Maturity Model.
Recommendation
All universities
1. We recommend that all universities:
- with reported issues relating to users and privileged users access work to implement agreed management actions as soon as practical
- continue to assess against the Essential Eight Maturity Model for their key finance and other information technology systems.
Appendix A: Submissions and comments
Download a PDF copy of Appendix A: Submissions and comments.

Appendix B: Sector context
Appendix C: Our audit approach
Appendix D: Abbreviations, acronyms and glossary
Download a PDF copy of Appendix D: Abbreviations, acronyms and glossary.
Appendix E: Audit opinions
Appendix F: Control issue risk ratings
Download a PDF copy of Appendix F: Control issue risk ratings.
Appendix G: Financial and non-financial sustainability indicators
Download a PDF copy of Appendix G: Financial and non-financial sustainability indicators.
Download Appendix G: Financial and non-financial sustainability indicators