Tertiary Education and Other Entities: Results of the 2012 Audits
Overview
This report presents the results of our financial audits of 106 entities mainly with a 31 December financial year end. It focuses on technical and further education (TAFE) institutes, universities and alpine resort management boards (ARMBs) and provides detailed analysis of their financial reporting, performance reporting, financial results, financial sustainability and internal controls. It informs Parliament about significant issues arising from the audits and complements the assurance provided through individual audit opinions included in the entities' annual reports.
Clear audit opinions were issued on the financial reports of all
but three entities. The three qualified opinions related to the
financial reports of The University of Melbourne, Deakin University
and the Anti-Cancer Council of Victoria.
Clear opinions were issued on all 20 performance statement
audits.
Overall, internal controls in TAFEs and universities were
adequate for producing reliable, accurate and timely financial
reports. Internal audit functions were well developed, although
four universities and five TAFEs did not have arrangements for
internal auditors to report their conflicts of interests.
Improvements could be made in relation to internal audit coverage,
with a number of key business areas not subject to recent internal
audit scrutiny.
Controls over credit card purchasing were generally sound, however
improvements can be made in relation to risk identification.
Sample-based testing produced positive results, with identified
internal controls operating in a majority of instances.
Ten of the 22 tertiary education entities (three universities and
seven TAFEs) had not assessed themselves as being compliant with
the requirements of the Payment Card Industry-Data Security
Standard. This shows a lack of understanding of the importance of
this high-risk activity, and potentially exposes students to risks
of identity theft or fraud if their credit card information is
accessed by unauthorised persons.
Tertiary Education and Other Entities: Results of the 2012 Audits: Message
Ordered to be printed
VICTORIAN GOVERNMENT PRINTER May 2013
PP No 233, Session 2010–13
President
Legislative Council
Parliament House
Melbourne
Speaker
Legislative Assembly
Parliament House
Melbourne
Dear Presiding Officers
Under the provisions of section 16AB of the Audit Act 1994, I transmit my report Tertiary Education and Other Entities: Results of the 2012 Audits.
Yours faithfully

Dr Peter Frost
Acting Auditor-General
29 May 2013
Audit summary
This report presents the results of our financial audits of 106 entities mainly with a 31 December financial year end. It focuses on technical and further education (TAFE) institutes, universities and alpine resort management boards (ARMB) and provides detailed analysis of their financial reporting, performance reporting, financial results, financial sustainability and internal controls. It informs Parliament about significant issues arising from the audits and complements the assurance provided through individual audit opinions included in the entities' annual reports.
Clear audit opinions were issued on the financial reports of all but three entities. The three qualified opinions related to the financial reports of The University of Melbourne, Deakin University and the Anti-Cancer Council of Victoria.
Clear opinions were issued on all 20 performance statement audits.
Conclusion
Notwithstanding some areas for improvement, Parliament can have confidence in the adequacy of financial and performance reporting and the internal controls of the entities audited.
Performance reporting
The usefulness of current performance information is limited, as there is little consistency in indicators and targets. We intend to provide advice to TAFEs on the relevance and appropriateness of performance indicators in management letters in years ending 31 December 2013 and 2014. In the year ending 31 December 2015 we will express an audit opinion on the relevance and appropriateness of performance indicators.
Financial results and sustainability
TAFEs collectively generated a surplus of $58.5 million in 2012, down 39.1 per cent on 2011 as a result of increased employee costs due to structured redundancy programs. Changes to funding mean that TAFEs are now more reliant on student tuition fees for generating a major portion of their operating revenue. Overall student fee revenue was consistent with 2011, with a $7.1 million decrease in international student fees offset by a $7.7 million increase in domestic student fees.
The sector's financial sustainability risk is deteriorating, with 10 of the 14 TAFEs assessed as medium risk in 2012, compared with seven in 2011. TAFEs generally recorded poor self‑financing indicators, which suggests that they are unable to fund asset replacement or renewal with cash generated from their operating activities. Capital replacement indicator results declined at nine of the 14 TAFEs, and there is an increasing dependence on government funding for capital programs.
Seven of the eight universities reported a surplus in 2012, with the sector generating a total surplus of $454.6 million, compared to a $478.5 million surplus in 2011. Student fee revenue grew by $107.4 million, mainly due to higher domestic student fees.
Victoria University was assessed as having medium financial sustainability risk due to its poor self-financing indicator. Monash University's financial sustainability risk was assessed as high due to low liquidity, however it had financial assets classified as 'available for sale' which can be converted to cash if required. The remaining six universities had a low financial sustainability risk in 2012.
Universities that have established overseas campuses have experienced mixed financial success. Monash University's campus in South Africa is reliant on its parent to meet its ongoing expenditure commitments, requiring $34.0 million in loan funding over the past five years. Conversely, RMIT International University Vietnam has generated surpluses over the past five years totalling $30.5 million, and has no outstanding loans.
Alpine resorts collectively reported an operating deficit of $1.7 million in 2011–12 ($5.2 million surplus in 2010–11) notwithstanding support payments contributed by the Department of Environment and Primary Industries. Without this support funding, the sector's operating deficit would have been $4.9 million—similar to its 2011 result.
The three larger alpine resorts at Mt Buller and Mt Stirling, Mt Hotham and Falls Creek generated surpluses in 2012. These three resorts were assessed as having low financial sustainability risk on average for the past five years.
Financial sustainability continues to be of concern for Mt Baw Baw and Lake Mountain, with poor operating results and low liquidity levels placing them at high risk in 2011–12. Work has commenced on investigating sustainable operating solutions for Lake Mountain, with it appointing an external contractor to deliver services and products at the resort during 2013.
Internal controls
Overall, internal controls in TAFEs and universities were adequate for producing reliable, accurate and timely financial reports.
Internal audit functions were well developed, although four universities and five TAFEs did not have arrangements for internal auditors to report their conflicts of interests. Improvements could be made in relation to internal audit coverage, with a number of key business areas not subject to recent internal audit scrutiny.
Controls over credit card purchasing were generally sound, however improvements can be made in relation to risk identification. Sample-based testing produced positive results, with identified internal controls operating in a majority of instances.
Ten of the 22 tertiary education entities (three universities and seven TAFEs) had not assessed themselves as being compliant with the requirements of the Payment Card Industry-Data Security Standard. This shows a lack of understanding of the importance of this high risk activitiy, and potentially exposes students to risks of identity theft or fraud if their credit card information is accessed by unauthorised persons.
- That universities and TAFEs address the better practice report preparation elements by preparing shell financial statements, performing materiality assessments and implementing rigorous analytical reviews, in order to improve the quality of reporting.
- That performance reporting for the tertiary education sector be elevated to legislative status, and a clear framework developed, with standard benchmarks and disclosure requirements.
That TAFEs:
- review key strategies and service objectives set out in their strategic plans so that they are clearly expressed, aligned and measurable
- review their financial and non-financial key performance indicators to determine, and if necessary improve, their relevance and appropriateness to their key strategies and service objectives
- improve the quality of data relating to their international student cohort in order to better inform decision-making to improve their financial sustainability and to identify and promote a competitive advantage
- revise internal audit charters to address reporting conflicts of interest of internal auditors, and to outline the selection process for internal audit providers
- obtain regular internal audit assurance over key business areas, in particular cash management and operational efficiency and effectiveness
- obtain annual certification of compliance with agreements from cardholders
- identify risks associated with using credit cards for purchasing, and mitigation strategies
- develop policies for revenue paid by credit or debit cards and achieve compliance with the Payment Card Industry‑Data Security Standard, and actively manage the associated risks in order to protect the security of payers' personal information.
That universities:
- obtain regular internal audit assurance over key business areas
- obtain annual certification of compliance with agreements from cardholders
- identify risks associated with using credit cards for purchasing, and mitigation strategies
- develop policies for revenue paid by credit or debit cards and achieve compliance with the Payment Card Industry-Data Security Standard, and actively manage the associated risks in order to protect the security of payers' personal information.
- That Lake Mountain and Mt Baw Baw Alpine Resort Management Boards should continue to develop strategies to attract greater visitor numbers.
- That Mt Baw Baw Alpine Resort Management Board should identify the reasons leading to shorter length of stay by visitors and develop strategies to address this.
- The Alpine Resorts Co-ordinating Council together with Lake Mountain and Mt Baw Baw Alpine Resort Management Boards should implement revised operating arrangements to improve their financial viability.
Submissions and comments received
In addition to progressive engagement during the course of the audit, in accordance with section 16(3) of the Audit Act 1994 a copy of this report, or relevant extracts from the report, was provided to all universities, TAFEs, ARMBs, the Department of Treasury and Finance, the Department of Education and Early Childhood Development and the Department of Environment and Primary Industries with a request for submissions or comments.
Agency views have been considered in reaching our audit conclusions and are represented to the extent relevant and warranted in preparing this report. Their full section 16(3) submissions and comments however, are included in Appendix F.
1 Background
1.1 Introduction
This report covers 106 entities with a financial year end other than 30 June 2012. Principally it deals with the results of the audits of 98 tertiary education sector entities, comprising universities, technical and further education (TAFE) institutes, training entities and the entities that they control. The profile of these entities is set out in Figure 1A.
Figure 1A
Entities with a financial year end other than 30 June 2012
2012–13 |
|||||||
|---|---|---|---|---|---|---|---|
Balance date |
|||||||
Sector |
Type of entity |
2011 |
31 Oct |
31 Dec |
31 Mar |
Other |
Total |
Tertiary Education |
University |
8 |
8 |
8 |
|||
Entity controlled by university |
57 |
53 |
3 |
56 |
|||
TAFE institute |
14 |
14 |
14 |
||||
Entity controlled by TAFE institute |
11 |
12 |
12 |
||||
Training entity |
7 |
7 |
7 |
||||
Entity controlled by training entity |
1 |
– |
– |
||||
Other |
– |
1 |
1 |
||||
Total Tertiary Education |
98 |
98 |
|||||
Sustainability and Environment |
Alpine resort |
5 |
5 |
5 |
|||
Health |
Charity |
1 |
1 |
1 |
|||
Planning and Community Development |
Trust |
1 |
1 |
1 |
|||
Local Government |
Company |
1 |
1 |
1 |
|||
Total |
106 |
5 |
96 |
1 |
4 |
106 |
|
Note: Controlled entities generally include associated companies, trusts and joint ventures.
Source: Victorian Auditor-General’s Office.
The report informs Parliament about significant issues arising from the financial audits and augments the assurance provided through audit opinions on financial reports and performance reports included in the respective entities’ annual reports.
The report comments on the quality and timeliness of financial reporting and the financial sustainability of tertiary education bodies and alpine resort management boards. It also comments on the effectiveness of internal audit and credit card management controls in the tertiary education sector.
Other reports of the Victorian Auditor-General's Office on the results of financial audits for 2012 are outlined in Appendix B.
1.1.2 Audit of financial reports
An annual financial audit has two aims:
- to give an opinion consistent with section 9 of the Audit Act 1994, on whether the financial statements are fairly stated
- to consider whether there has been wastage of public resources or a lack of probity or financial prudence in the management or application of public resources, consistent with section 3A (2) of the Audit Act 1994.
The financial audit framework applied in the conduct of the 2012 audits is set out in Appendix C.
1.1.3 Audit of performance reports
Section 8(3) of the Audit Act 1994 authorises the Auditor-General to audit performance indicators included in the annual reports of a public sector entity to determine whether they fairly represent the entity's actual performance.
The Auditor-General uses this authority to audit the performance reports prepared by the TAFE sector.
1.1.4 Audit of internal controls
An entity's governing body is responsible for developing and maintaining its internal control framework. Internal controls are systems, policies and procedures that help an entity to reliably and cost-effectively meet its objectives. Sound internal controls enable delivery of reliable, accurate and timely external and internal reporting. The main components of an effective internal control framework and an explanation of the framework are set out in Appendix C.
1.2 Audit conduct
The audits of 98 tertiary education entities, five alpine resort management boards and three other entities were undertaken in accordance with the Australian Auditing Standards.
Pursuant to section 20(3) of the Audit Act 1994, unless otherwise indicated any persons named in this report are not the subject of adverse comment or opinion.
The total cost of preparing and printing this report was $225 000.
1.3 Structure of this report
Details of the entities covered within each Part of this report are set out in Figure 1B.
Figure 1B
Report structure
Report part |
Description |
|---|---|
Part B: Financial and performance reporting |
Reports the results of the 2012 financial audits of eight universities, 14 TAFE institutes, five alpine resort management boards, seven training entities and the 69 entities that they control. It also reports on performance reporting for the TAFE sector. |
Part C: TAFEs |
Reports the financial results and assesses the sustainability of the 14 TAFE institutes. It also comments on internal controls including over credit card management across the TAFE sector. |
Part D: Universities |
Reports the financial results and assesses the sustainability of the eight universities. It also comments on internal controls including over credit card management across the university sector. |
Part E: Alpine resorts |
Reports the financial results of five alpine resort management boards and assesses their financial sustainability. |
Source: Victorian Auditor-General’s Office.
2 Financial reporting
At a glance
Background
Independent audit opinions add credibility to financial reports by providing reasonable assurance that the information reported is reliable and accurate. The timeliness and accuracy of the preparation of an entity's report is integral to the quality of financial reporting.
This chapter covers the results from the audits of the 106 entities with a financial year end other than 30 June 2012.
Findings
- The financial reports of all but three entities received clear audit opinions:
- Deakin University and The University of Melbourne received qualified opinions due to their accounting treatment for non-reciprocal research and capital grants.
- Anti-Cancer Council of Victoria received a qualified opinion due to the inherent risks associated with its cash donations.
- In 2012, 103 entities completed their financial reports within the mandated time frames.
Recommendation
That universities and TAFEs address the better practice report preparation elements by preparing shell financial statements, performing materiality assessments and implementing rigorous analytical reviews, in order to improve the quality of reporting.
2.1 Introduction
This chapter covers the results from the audits of the 106 entities with a financial year end other than 30 June 2012.
Each entity must prepare its financial report in accordance with Australian Accounting Standards, including the Australian Accounting Interpretations.
The principal legislation governing financial reporting by these entities in 2012 was the Financial Management Act 1994 (FMA) and the Corporations Act 2001.
Appendix A details the legislative and reporting framework for the 106 entities.
2.2 Audit opinions issued
Clear audit opinions were issued on the financial reports of 103 entities for the year.
Independent audit opinions add credibility to financial reports by providing reasonable assurance that the information reported is reliable and accurate. A clear audit opinion confirms that the financial statements present fairly the transactions and balances for the reporting period, in accordance with the requirements of relevant accounting standards and legislation.
A qualified audit opinion means that the financial report is materially different to the requirements of the relevant reporting framework or accounting standards, and is less reliable and useful as an accountability document.
Qualifications
Three qualified audit opinions were issued for the 2012 financial year (three for 2011).
The University of Melbourne and Deakin University again received qualified audit opinions because their accounting treatment of non-reciprocal research and capital grant income as a liability was not in accordance with Australian Accounting Standards. Accounting standards require grants which are non-reciprocal to be recognised as revenue in the year they are received—when the entity gains control of the funds.
Deakin University regards the receipt of these monies as a reciprocal transfer where the grants have outstanding performance or return conditions and accounts for them in accordance with Australian Accounting Standard AASB 118 – Revenue. VAGO is of the opinion that these monies are non-reciprocal grants and should be accounted for in accordance with Australian Accounting Standard 1004 – Contributions, whereby such payments are treated as income in the year of receipt.
The Australian Accounting Standards Board is currently reviewing grant accounting in not-for-profit organisations. However, until that review is complete, the accounting standards in their current form apply.
The ongoing qualified opinion issued to the Anti-Cancer Council of Victoria is generally attached to the financial reports of entities with significant voluntary fundraising activities. The qualification draws attention to the risk inherent in management assuring the complete recording of cash collected through donations. The risk is unavoidable and cannot be cost-effectively mitigated by further internal controls.
Emphasis of matters
In certain circumstances an audit opinion may draw attention to, or emphasise, a matter relevant to the users of an entity’s financial report but does not warrant a qualification. Unmodified opinions can include an emphasis of matter (EOM) paragraph.
The audit opinion on the financial report of the International Fibre Centre Limited contained an EOM, which drew attention to the material uncertainty surrounding the continued existence of the company beyond 2013.
In previous years, the audit opinions of several entities included an EOM. The EOMs drew attention to each entity's reliance on continuing financial support from its parent entity to sustain its operations. An EOM was not included in audit opinions in 2012 where the entity had received a letter of financial support from its parent entity. In these instances, the entity was able to demonstrate that the going concern assumption was satisfied.
2.3 Quality of reporting
The timeliness and accuracy of the preparation of an entity's financial report is integral to the quality of reporting. Entities need to have a well-planned and managed preparation process to achieve cost-effective and efficient financial reporting.
In 2012, 103 entities completed their financial reports within their mandated time frames. The audited financial statements for three entities had not been finalised at the time of writing this report.
Overall, the financial report preparation processes of universities and technical and further education (TAFE) institutes produced accurate, complete and reliable information. There was an overall improvement in all key areas that form a better practice reporting framework. The framework applied in assessing the quality of reporting is detailed in Appendix C.
Figure 2A shows that the overall quality of financial reporting improved in 2012.
Figure 2A
Quality of financial reporting in 2012
|
Quality of financial reporting |
Universities |
TAFEs |
Total |
|||
|---|---|---|---|---|---|---|
|
(%) |
(no.) |
(%) |
(no.) |
(%) |
(no.) |
|
|
Improved from previous year |
25 |
2 |
36 |
5 |
28 |
7 |
|
Same as previous year |
75 |
6 |
64 |
9 |
72 |
15 |
|
Worse than previous year |
0 |
0 |
0 |
0 |
0 |
0 |
|
Total |
100 |
8 |
100 |
14 |
100 |
22 |
Source: Victorian Auditor-General’s Office.
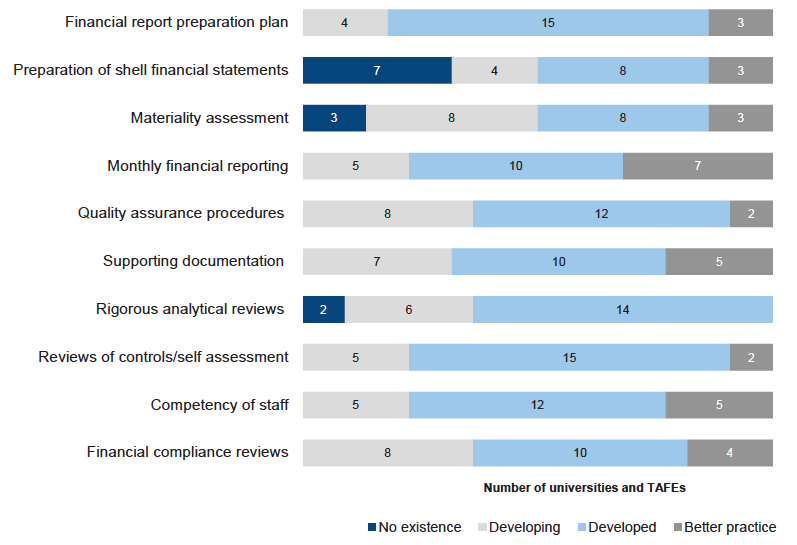
The assessment of performance was against better practice criteria using the following scale:
- no existence—function not conducted by the entity
- developing—partially encompassed in the entity's financial reporting process
- developed—entity has implemented the process, however it is not fully effective or efficient
- better practice—entity has implemented processes which are effective and efficient.
Figure 2B summarises the results of our analysis.
Figure 2B
Results of assessment of report preparation processes against better practice elements
Source: Victorian Auditor-General’s Office.
Further improvement is needed in relation to:
- preparation of shell financial accounts
- materiality assessments
- rigorous analytical reviews
- quality assurance procedures
- financial compliance reviews.
There was no noticeable improvement in these areas in 2012. Improving these areas will assist the quality of reporting by enabling the timely preparation of financial reports and early detection and correction of errors.
The Victorian Skills Commission (VSC) previously prepared model financial statements for TAFEs, although this was not the case in 2012. VSC's activities have been assumed by the Department of Education and Early Childhood Development, with the entity ceasing to exist from 31 December 2012.
Recommendation
- That universities and TAFEs address the better practice report preparation elements by preparing shell financial statements, performing materiality assessments and implementing rigorous analytical reviews, in order to improve the quality of reporting.
3 Performance reporting
At a glance
Background
Fourteen technical and further education (TAFE) institutes, four universities and two training entities are required to include an audited statement of performance in their annual report.
This chapter outlines the performance reporting framework and comments on the results of our audits of these reports. It also highlights our intention to develop our audit of performance reports in future periods.
Conclusion
A formal performance reporting framework is yet to be developed for the tertiary education sector. The usefulness of current performance information reported by the sector is limited as there is little consistency in indicators and targets across the sector. The relevance and appropriateness of current indicators merits review.
Findings
- Use of targets was inconsistent across the performance statements audited, with 45 per cent of entities setting benchmarks for less than half of their indicators.
- Explanations for variances between targets and actual results were not provided by 25 per cent of the 20 entities.
Recommendations
- That performance reporting for the tertiary education sector be elevated to legislative status, and a clear framework developed, with standard benchmarks and disclosure requirements.
That TAFEs:
- review key strategies and service objectives set out in their strategic plans so that they are clearly expressed, aligned and measurable
- review their financial and non-financial key performance indicators to determine, and if necessary improve, their relevance and appropriateness to their key strategies and service objectives.
3.1 Introduction
The Audit Act 1994 empowers the Auditor-General to audit any performance indicators in the report of operations of an audited entity to determine whether they:
- are relevant to any stated objectives of the entity
- are appropriate for the assessment of the entity’s actual performance
- fairly represent the entity’s actual performance.
The annual attest audit of performance statements currently expresses an opinion on whether the reported results are presented fairly and whether they have been prepared in accordance with the Financial Management Act 1994. It does not express an opinion on the relevance or appropriateness of the performance information reported.
This chapter outlines the performance reporting framework and comments on the results of our audits of the associated statements in 2012. It also signals our intention to further develop our audit of the performance statements in the future.
3.2 Elements of effective performance reporting
Effective performance measurement and monitoring enables managers and the governing boards of entities to evaluate performance against a set of key indicators. It also facilitates appropriate and timely action to achieve organisational objectives and outcomes. Reporting on performance to senior management and the community is an important part of a performance management framework and public sector accountability.
Central to effective performance measurement, management and reporting is a comprehensive suite of relevant and appropriate performance measures or indicators, and targets.
Relevant indicators have a logical and consistent relationship to an entity's objectives and are linked to the outcomes to be achieved. Ideally they should take into account immediate deliverables and long-term sustainability.
Appropriate indicators give sufficient information to assess the extent to which the entity has achieved a predetermined target, goal or outcome. They can include the trends in performance over time, performance relative to that of similar agencies and performance relative to benchmarks.
Fair presentation of performance results requires that the information provided is able to be measured, consistently represents what it purports to indicate without bias, and is accurate and auditable.
3.3 Performance reporting by education entities
The preparation of performance statements by technical and further education (TAFE) and other tertiary education entities is not mandated under legislation. In November 2008 the Department of Innovation, Industry and Regional Development (DIIRD)—now the Department of State Development, Business and Innovation—issued an executive memorandum requesting 20 entities report on certain key performance indicators (KPI). This included the 14 TAFEs, four universities with TAFE divisions and two training entities. DIIRD required the performance indicators to be disclosed in a performance statement, subject to audit by the Auditor-General, and included in the entity's annual report.
The current indicators reported on by the 20 entities are:
- participation of 15–24 year olds
- participation of 25–64 year olds
- module load completion rate
- student satisfaction
- total cost per student contact hour
- working capital ratio
- net operating margin
- fee for service revenue
- revenue per equivalent full-time staff
- student contact hours
- energy consumption.
Minimal guidance was provided by the DIIRD on the calculation method for these indicators, and no further guidance has been issued since the original memorandum.
3.4 Audit opinions issued
This year we reviewed the performance indicators of 20 entities. They comprised the 14 TAFEs and:
- Ballarat University
- RMIT University
- Swinburne University of Technology
- Victoria University
- Centre for Adult Education
- Driver Education Centre of Australia.
Clear audit opinions were issued on the 20 performance reports.
3.5 The quality of reporting
3.5.1 Indicators reported
KPIs need to be reliable, relevant and measurable. They are most effective where there is consistent application of underlying data and calculation method across entities. This allows for the comparison of results over time and against other bodies.
The current arrangements for tertiary sector performance reporting do not prescribe how each indicator should be measured. As a result, entities are using different calculation methods and many of the indicators, and therefore performance, is incomparable across entities.
The indicators that commonly result in difficulty in comparison are:
- participation of 15–24 year olds
- participation of 25–64 year olds
- student contact hours
- energy consumption.
These indicators in particular are quantitative measures which ignore the relative size of an entity. Larger entities may report better results against participation indicators because of their expanded capacity, rather than as a result of sound management. Conversely, smaller entities may have better energy consumption rates because of reduced campus sizes.
In contrast, the indicators that best enable cross-entity comparisons are:
- module load completion rate
- cost per student contact hour
- fee for service revenue
- revenue per equivalent full-time staff.
These indicate how well an entity is performing in a particular area, and are not distorted by the size of the entity's operations.
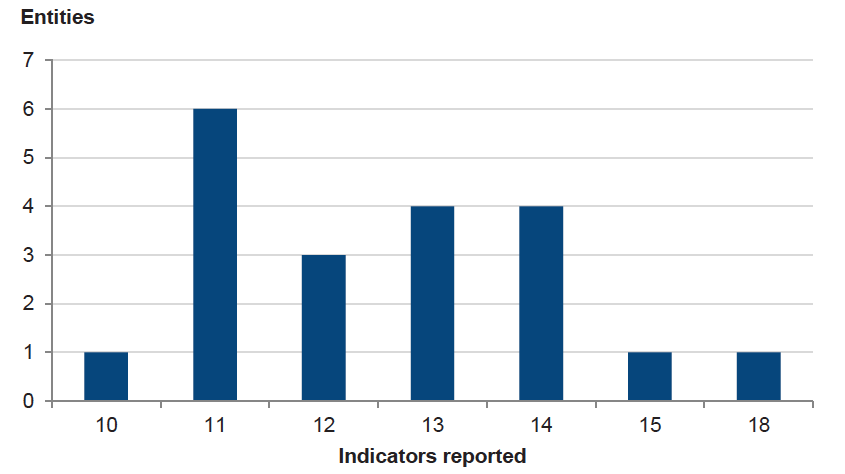
The number of indicators reported by the 20 entities varies, as presented in Figure 3A.
Figure 3A
Indicators reported in performance statements
Source: Victorian Auditor-General’s Office.
The range of indicators was mainly due to some entities reporting energy consumption in greater detail. Eight reported an aggregate result for energy consumption, while 11 provided a breakdown based on various energy sources. The remaining entity did not include energy consumption results in its performance statement, however, it provided a separate report on environmental performance.
The usefulness of performance reporting by TAFEs would be improved with a review of the indicators used, and consistency in their calculation.
3.5.2 Achievement of targets
Effective performance reporting includes a comparison of results against indicators that are consistent across the sector. Benchmarks provide users of information with a clearer understanding of how an entity has performed against like industry operators.
The current performance reporting framework does not prescribe a set of standard indicators, targets or benchmarks. As a result, entities are able to set their own indicators and targets, or report only actual results.
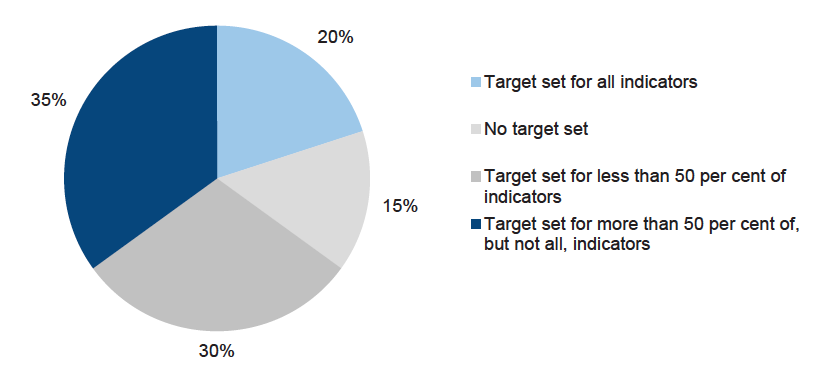
Figure 3B shows the number of targets set by the 20 entities.
Figure 3B
Target setting
Source: Victorian Auditor-General’s Office.
Target setting was generally poor, with 45 per cent of performance statements including them for less than half the indicators reported.
To be useful, KPIs should be consistent across a number of entities and reflect a predetermined level of required performance. Targets should reflect a standard for each particular KPI that is relevant and appropriate to the entity.
3.5.3 Quality of analysis
Comparative information is important, as it highlights how an entity has performed over a period of time. We noted that nine of the 20 entities that prepared performance reports did not include results achieved in the prior year.
Sound performance reporting is accompanied by commentary explaining why a target was not achieved, or analysing variances from year to year. This provides greater clarity around the information reported and offers users a clearer picture of why performance varied.
Explanations for significant variances in the actual result to the target or prior year result were provided by 75 per cent of entities (15 of 20) in 2012. However, where provided, the analysis was generally poor, with commentary stating that a variance had occurred, without giving an explanation why.
3.6 Future audit approach
Performance reporting for tertiary education entities was established in 2008. Since that time, we have focused the audit of performance information on whether the reports fairly present performance and comply with the legislative requirements.
However, given that performance reporting has been in place within the sector for more than five years, we intend to expand our audit of performance indicators in future periods, to promote improvement in the sector and exercise audit's complete mandate. On 26 April 2013 it was gazetted that TAFEs were required to have a current strategic plan that included financial and non-financial KPIs. The KPIs were to have clear links with each TAFE's key strategies.
Recognising the relative immaturity of existing performance information across the sector, and the scale of improvements required to achieve relevant and appropriate performance indicators, we intend to gradually move to express an opinion on the relevance and appropriateness of the indicators reported in TAFE performance statements.
We intend to implement this approach over a three-year period. In the years ending 31 December 2013 and 2014 we propose to convey our opinion on the relevance and appropriateness of performance indicators through management letters to encourage their further development, while continuing to express a public opinion on their fair representation. We will also provide an update each year on the sector's progress in our annual report on the results of audits.
In the third year, TAFEs will be expected to provide a suite of measures that are relevant and appropriate for assessing the TAFE's performance, and that fairly represent that performance. From that year the public audit opinion will address the relevance and appropriateness of the indicators and whether they fairly present performance. Where this standard is not met, a qualified audit opinion may be issued on the performance statement.
This transitional approach will require the support of the Department of Education and Early Childhood Development and the TAFEs to achieve the desired outcome—more transparent and meaningful reporting on TAFE performance to the community.
Recommendations
- That performance reporting for the tertiary education sector be elevated to legislative status, and a clear framework developed, with standard benchmarks and disclosure requirements.
That TAFEs:
- review key strategies and service objectives set out in their strategic plans so that they are clearly expressed, aligned and measurable
- review their financial and non-financial key performance indicators to determine, and if necessary improve, their relevance and appropriateness to their key strategies and service objectives.
4 Part C: Technical and further education institutes
4. Financial results – TAFEs
At a glance
Background
Accrual-based financial statements enable an assessment of whether entities are generating sufficient surpluses from operations to maintain services, fund asset maintenance and retire debt. This chapter analyses the financial results of the 14 technical and further education (TAFE) institutes for the year ended 31 December 2012.
Findings
- TAFEs collectively generated a surplus of $58.5 million in 2012, down 39.1 per cent on the 2011 result.
- Ten of the 14 TAFEs recorded a lower operating result in 2012 than 2011, driven by:
- a decrease in capital government grants of $39.5 million or 40.1 per cent
- an increase in employee costs of $25.7 million or 3.5 per cent.
- International student fee revenue decreased by $7.1 million or 6.3 per cent to $105.5 million in 2012—the lowest level over the past five years.
- Domestic student fee revenue increased by $7.7 million or 11.8 per cent in 2012, and represented 41.0 per cent of total student fees (36.9 per cent in 2011).
- Only six of the 11 TAFEs with international students were able to provide comprehensive data on their enrolments, such as country of residence and enrolments by semester.
Recommendation
That TAFEs improve the quality of data relating to their international student cohort in order to better inform decision-making to improve their financial sustainability and to identify and promote a competitive advantage.
4.1 Introduction
Accrual-based financial statements enable an assessment of whether technical and further education (TAFE) institutes are generating sufficient surpluses from operations to maintain services, fund asset maintenance and retire debt. Their ability to generate surpluses is subject to the regulatory environment in which they operate, and their ability to minimise costs and maximise revenue.
An entity's financial performance is measured by its net operating result—the difference between its revenues and expenses. An entity's financial position is generally measured by reference to its net assets—the difference between its total assets and total liabilities.
4.2 Financial results
4.2.1 Financial performance
The TAFE sector generated a surplus of $58.5 million in 2012, a decrease of $37.5 million or 39.1 per cent over the prior year. This was mainly due to an increase in employee related costs, and a decrease in government grants received by the sector.
Figure 4A provides a comparison of the total operating result for the TAFE sector for 2012 and 2011.
Figure 4A
Surplus/(deficit) by TAFE, 2011 and 2012
|
Entity |
2012 |
2011 |
|---|---|---|
|
Advance TAFE |
(874) |
4 027 |
|
Bendigo Regional Institute of TAFE |
257 |
(2 530) |
|
Box Hill Institute of TAFE |
8 355 |
19 362 |
|
Central Gippsland Institute of TAFE |
5 939 |
10 803 |
|
Chisholm Institute of TAFE |
3 538 |
6 402 |
|
Gordon Institute of TAFE |
13 129 |
17 213 |
|
Goulburn Ovens Institute of TAFE |
11 493 |
(4 474) |
|
Holmesglen Institute of TAFE |
4 622 |
13 488 |
|
Kangan Institute of TAFE |
(1 197) |
16 129 |
|
Northern Melbourne Institute of TAFE |
5 107 |
13 676 |
|
South West Institute of TAFE |
(653) |
1 665 |
|
Sunraysia Institute of TAFE |
81 |
(1 446) |
|
William Angliss Institute of TAFE |
(1 081) |
(1 005) |
|
Wodonga Institute of TAFE |
9 798 |
2 694 |
|
Total |
58 514 |
96 004 |
Source: Victorian Auditor-General’s Office.
Figure 4A shows that 10 TAFEs reported a lower result in 2012 than in 2011.
Revenue
In 2012 TAFEs collectively generated revenue of $1.2 billion, a decrease of $13.1 million from 2011. The decrease was mainly due to a reduction of 40.1 per cent in government capital grants.
Nevertheless government funding remained the largest revenue component for TAFEs, comprising 66 per cent of total revenue in 2012. The majority comprised $539.0 million in operating grants from the State Government ($525.5 million in 2011) and $168.1 million from the Commonwealth Government ($157.9 million in 2011). These figures included capital grants from the state and Commonwealth governments which decreased to $59.1 million in 2012 ($98.6 million in 2011).
The composition of operating revenue for 2012 is presented in Figure 4B.
Figure 4B
TAFE revenue composition, 2012
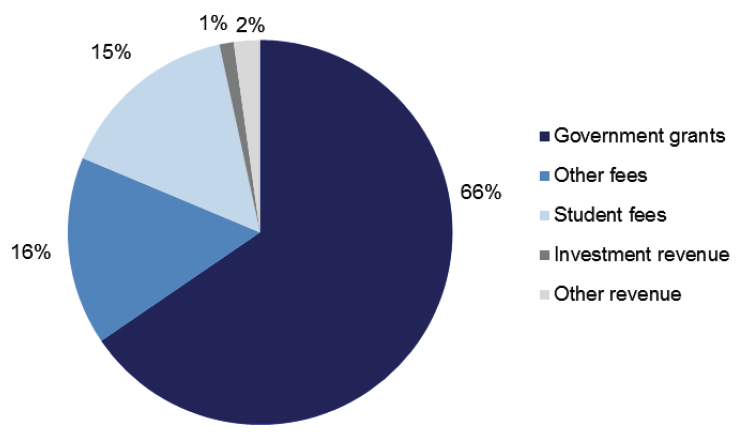
Source: Victorian Auditor-General’s Office.
Figure 4B highlights the sector's financial dependence on government. Student fees generated 15 per cent of total revenue in 2012, highlighting the sector's relatively low level of self-generated income.
Trends in student fee revenue
Student fee revenue did not change materially in 2012, with the sector reporting a total of $178.9 million ($178.2 million in 2011). However, the following TAFEs experienced significant variances in 2012:
- Goulburn Ovens Institute of TAFE—an increase of $1.03 million or 30.9 per cent
- Wodonga Institute of TAFE—an increase of $0.464 million or 20.9 per cent
- Northern Melbourne Institute of TAFE—a decrease of $2.02 million or 7.5 per cent.
Total student fee revenue increased by 18.2 per cent from 2008–12, despite a volatile international student market during the period.
Recent policy changes in the TAFE sector increasing competition between private and public sector tertiary education providers mean it is increasingly important that TAFEs proactively target students and modify their marketing activities and course design to attract enrolments and to enhance their competitive advantage. This is especially important in the international student market, as international students generate higher revenue per student than domestic enrolments, and their fees are an important factor in the ongoing viability of individual TAFEs and the sector.
International students
International student fee revenue declined by $7.1 million or 6.3 per cent to $105.5 million in 2012—their lowest level over the past five years.
Fees received from international students represented 59.0 per cent of total student fees in 2012 (62.1 per cent in 2011). International student fee revenue has decreased in the past two years, contributing to the decline in surpluses.
Therefore, it is of concern that only six of the 11 TAFEs with international students were able to provide us with comprehensive data on student enrolments.
Common data issues included:
- inability to provide a breakdown of student countries of residence
- inconsistent reporting of figures from year to year
- deficiencies in comparative figures
- unable to provide commencement details.
TAFEs are heavily reliant on revenue from international students, and a lack of quality information may impact on their ongoing ability to attract and retain these students. With the international market in decline it is important that TAFEs improve the quality of this data to maximise their return on effort and investment, and to improve their financial sustainability.
Domestic students
Domestic student fee revenue increased by $7.7 million or 11.8 per cent in 2012, and represented 41.0 per cent of total student fees (36.9 per cent in 2011).
Domestic student fee revenue increased at the following TAFEs in 2012:
- Goulburn Ovens Institute of TAFE—an increase of $1.0 million or 29.3 per cent
- Chisholm Institute of TAFE—an increase of $1.3 million or 11.9 per cent
- Holmesglen Institute of TAFE—an increase of $3.0 million or 39.0 per cent.
Fee revenue from domestic students has increased in four of the past five years and, over the period from 2008–12, increased by 68.9 per cent.
Expenses
In 2012 the 14 TAFEs collectively incurred $1.1 billion in operating expenses, an increase of $24.4 million or 2.2 per cent from the prior year. The increase was predominantly due to:
- employee benefits up $25.7 million or 3.5 per cent
- depreciation up $4.0 million or 6.4 per cent.
Figure 4C shows the composition of TAFE expenditure for 2012.
Figure 4C
TAFE expenditure composition, 2012
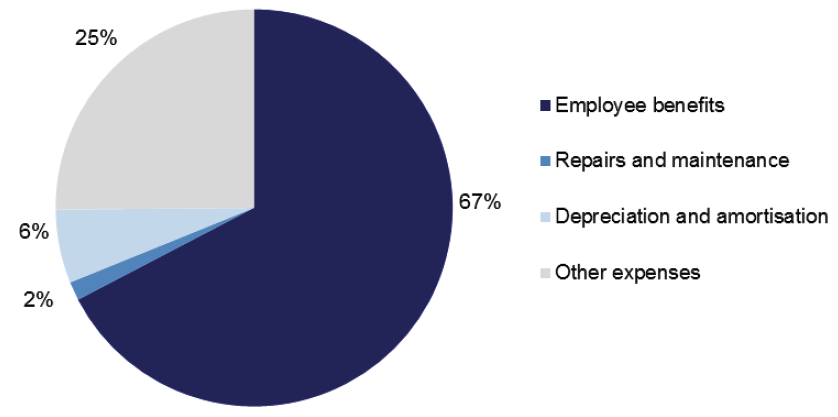
Source: Victorian Auditor-General’s Office.
Employee-related costs remained the most significant expenditure item, representing 67 per cent of total expenses in 2012 (66 per cent in 2011). Expenditure composition for the TAFE sector was consistent with 2011.
4.3 Financial position
An entity’s financial position is generally measured by reference to its net assets—the difference between its total assets and total liabilities. However, this measure is less appropriate for TAFEs, as they are not-for-profit entities, and generally do not hold assets that generate revenue. While they carry land and buildings of significant value on their balance sheets, representing 73 per cent of their total assets, the revenue base of TAFEs is not tied to the value of their assets and most of their assets cannot be readily sold to obtain funds.
The objective for a TAFE should, therefore, be to maintain and improve its asset base and related service provision, while managing levels of debt.
4.3.1 Assets
During 2012 the total value of TAFE assets increased by $176.5 million or 8.0 per cent to $2.4 billion. This was mainly due to an increase in the values of land and building assets as well as a $35.0 million increase in cash assets (15.6 per cent).
Land and buildings were revalued at all TAFEs in 2012, based on independent assessments by the Valuer-General.
Significant increases in the value of land included:
- Northern Melbourne Institute of TAFE—an increase of $25.5 million or 39.4 per cent
- Chisholm Institute of TAFE—an increase of $11.2 million or 32.7 per cent
- Holmesglen Institute of TAFE—an increase of $10.1 million or 18.9 per cent.
Building values increased by $92.5 million or 7.8 per cent. This was due to new asset construction and some valuation increments, including at:
- Box Hill Institute of TAFE—an increase of $24.8 million or 29.3per cent
- Central Gippsland Institute of TAFE—an increase of $14.9 million or 37.8 per cent
- Holmesglen Institute of TAFE—an increase of $17.4 million or 8.0 per cent.
The composition of TAFE assets in 2012 is presented in Figure 4D.
Figure 4D
TAFE asset composition, 2012
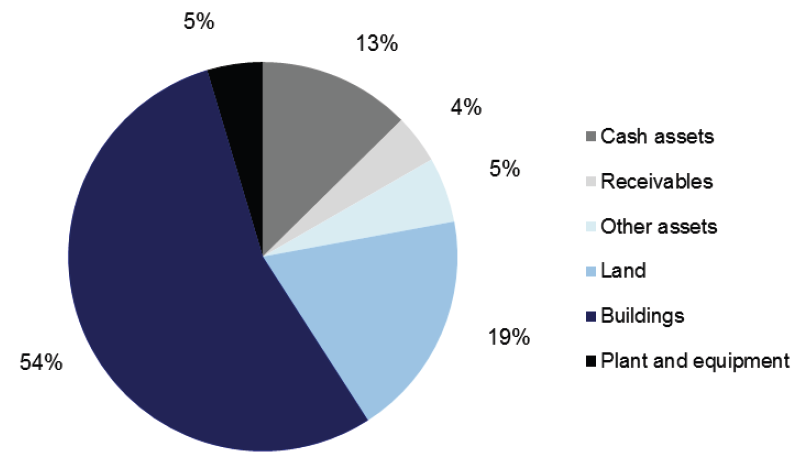
Source: Victorian Auditor-General’s Office.
4.3.2 Liabilities
At 31 December 2012 the total value of liabilities for the TAFE sector was $235.0 million. This was substantially the same as in 2011, although there were movements noted in each class of liability. A $6.8 million increase in payables was offset by a $9.7 million decrease in provisions. There was a decrease in employee benefit provisions at 11 of the 14 TAFEs, mainly due to fewer staff as a result of structured redundancy programs.
Provisions (47 per cent) and payables (38 per cent) continued to represent the majority of total TAFE liabilities.
Recommendation
- That TAFEs improve the quality of data relating to their international student cohort in order to better inform decision-making to improve their financial sustainability and to identify and promote a competitive advantage.
5 Financial sustainability – TAFEs
At a glance
Background
To be financially sustainable, entities need to be able to meet current and future expenditure as it falls due. They also need the ability to absorb foreseeable changes and materialising risks. This chapter provides our insight into the financial sustainability of the technical and further education (TAFE) institutes based on our analysis of the trends in five key financial indicators over a five-year period.
Conclusion
Four TAFEs were assessed as having low financial sustainability risk in 2012. The remaining 10 were assessed as medium risk, due to poor results for their self-financing indicator and capital replacement indicators. The sector's financial sustainability has declined between 2008 and 2012.
Findings
- TAFEs generally recorded poor self-financing indicators, indicative of an inability to fund asset replacement or renewal with cash generated from operating activities.
- Capital replacement indicator results had declined at nine TAFEs, suggesting that assets are being consumed faster than they are being replaced.
5.1 Introduction
To be financially sustainable, entities need to be able to meet their current and future expenditure as it falls due. They also need the ability to absorb foreseeable changes and financial risks as they materialise.
In this chapter we provide insight into the financial sustainability of the 14 technical and further education (TAFE) institutes through analysing the trends in each of five financial sustainability indicators over a five-year period. The five indicators are:
- underlying result
- liquidity
- debt-to-equity
- self-financing
- capital replacement.
Appendix D describes the sustainability indicators and risk assessment criteria used in this report.
The financial sustainability indicators and assessments flag departures from the norm that warrant attention. However, to form a definitive view of an entity’s financial sustainability, a holistic analysis that moves beyond financial indicators is required, including an assessment of the entity’s operations and the regulatory environment. These additional considerations are not examined in this report.
5.2 Financial sustainability
5.2.1 Overall assessment
The risk to financial sustainability for four TAFEs was assessed as low for 2012. The risk for the remaining 10 was assessed as medium, due to poor self-financing and capital replacement indicators.
Figure 5A provides a summary of our overall financial sustainability risk assessment results for the past two years.
Figure 5A
Two-year financial sustainability risk assessment
|
Entity |
2012 |
2011 |
|---|---|---|
|
Advance TAFE |
Medium |
Low |
|
Bendigo Institute |
Medium |
Medium |
|
Box Hill Institute |
Medium |
Medium |
|
Central Gippsland Institute |
Low |
Low |
|
Chisholm Institute |
Medium |
Low |
|
Gordon Institute |
Low |
Medium |
|
Goulburn Ovens Institute |
Medium |
Medium |
|
Holmesglen Institute |
Low |
Medium |
|
Kangan Institute |
Medium |
Low |
|
Northern Melbourne Institute |
Medium |
Low |
|
South West Institute |
Medium |
Low |
|
Sunraysia Institute |
Medium |
Medium |
|
William Angliss Institute |
Medium |
Medium |
|
Wodonga Institute |
Low |
Low |
|
Total |
14 |
14 |
Source: Victorian Auditor-General’s Office.
This shows that the risk to financial sustainability for the sector as a whole deteriorated between 2011 and 2012, with the number of TAFEs with medium risk to their financial sustainability increasing from seven to 10 over the two years.
5.2.2 Summary of trends in risk assessments over the five‑year period
When the risk assessments for each indicator are analysed for the sector they show the following trends over the five years to 2012:
- underlying result—the number of TAFEs in the medium-risk category has increased from three to four, with the remainder in the low-risk category
- liquidity—the number of TAFEs in the low-risk category has remained stable at14
- debt-to-equity—the number of TAFEs in the low-risk category has remained stable at 14
- self-financing—the number of TAFEs in the high-risk category has increased from three to nine
- capital replacement—the number of TAFEs in the high-risk category has increased from two to six
In summary, the sector's financial sustainability has deteriorated over the past five years.
5.2.3 Analysis of trends in sustainability indicators across the five-year period
To further understand the results, we analysed the five-year data for the five indicators. The relevant data are reproduced in Appendix B.
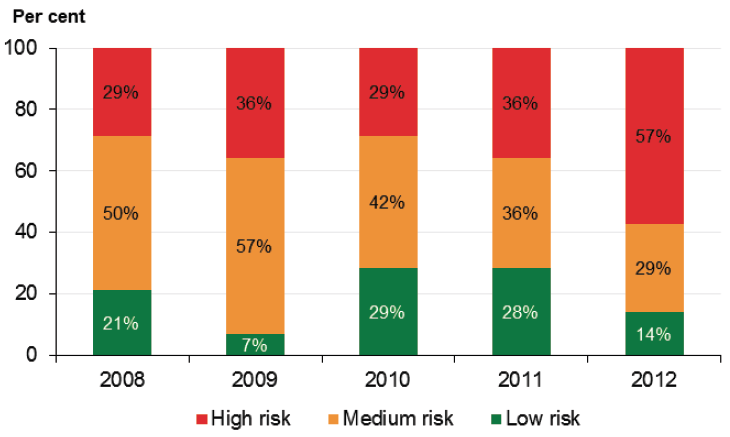
Figure 5B shows the mean sustainability risk assessments for the 14 TAFEs, over the five years from 2008 to 2012. High-risk results are shown in red, medium risk in orange, and low risk in green.
Figure 5B
Five-year mean financial sustainability risk assessment
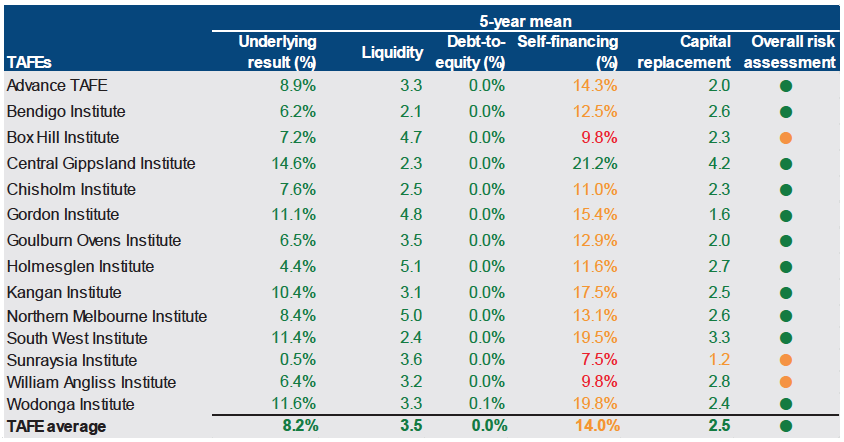
Source: Victorian Auditor-General’s Office.
The underlying result, liquidity and debt-to-equity results are positive, with all TAFEs recording risk assessments of low during the past five years.
However, deeper analysis revealed that the average underlying result for TAFEs has decreased since 2010. Nine of the 14 TAFEs recorded a lower result for this indicator in 2012 than in 2008. The decline highlights the challenge for the sector to achieve positive financial operating results following changes in the funding model.
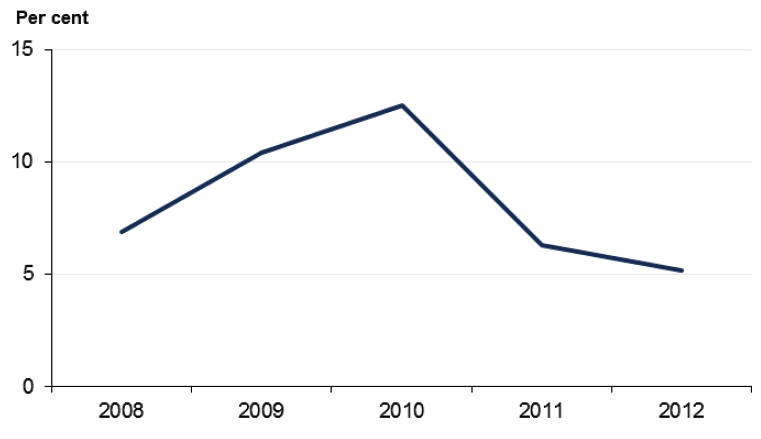
TAFEs have generally recorded poor self-financing results over the five-year period and the result has deteriorated since 2008. Cash generated from operating activities decreased 41.9 per cent from 2010 to 2012 and now represents less than 10 per cent of underlying revenue balances.
The capital replacement indicator also declined over the five-year period. This indicator compares the level of asset renewal against the depreciation expense, or the consumption of existing assets. Changes in the funding model have resulted in TAFEs cutting expenditure viewed as 'non-essential', including construction of capital assets. Payments for property, plant and equipment decreased by $53.5 million (35.6 per cent) to $96.7 million in 2012.
Impact of changes in legislation and funding model on sustainability
Changes to the legislative framework and funding model introduced in 2012 mean that TAFEs are more reliant on tuition fees for generating a major portion of their operating revenue. These tuition fees include domestic and international student fees, as well as fees for service. Consequently, there is less reliance on government grants. As a result of this changed environment, TAFEs need to proactively review their courses to focus on those that attract students in order to generate funds and be sustainable.
The changes in the operating model and cuts in funding have had a significant impact on TAFEs. As well as reducing or changing course offerings, the sector has responded by making staff redundant, closing campuses to drive down costs and attempting to sell land and buildings.
The financial impact in 2012 included:
- increased employment costs due to redundancies paid
- lower employee benefit provisions, due to fewer ongoing staff
- constraints over operating costs to reduce overheads
- downward revaluations of assets in some entities to reflect infrastructure assets no longer required or in use.
The full effect of the changes to the funding model was realised from 1 January 2013, when the cost to students undertaking vocational education and training increased. This may reduce participation.
There is a risk that if individual TAFEs do not change their operations to cut costs and increase student revenue, they may become unsustainable.
The funding model for TAFEs has not progressively funded them for the depreciation of their assets, instead allocating capital grants strategically across the sector. This means that funds for replacing assets were not provided until the government considered replacement was appropriate, given its strategic review of the sector's needs and other spending priorities.
As a result of the TAFE Reform Panel's 2013 report, A strong and sustainable Victorian TAFE sector, a number of changes have been announced. The government has reiterated its commitment to competitive neutrality in the vocational training sector and is considering more flexible financing options for TAFEs. The government stated that TAFE institutes will be required to demonstrate the capacity to operate commercially. They will also need to cover their depreciation costs through their operations.
The government will provide contestable funding of $200 million over four years to support the ongoing financial sustainability of TAFE institutes, including $100 million in infrastructure funding.
5.3 Five-year trend analysis
This section analyses and comments on the trends in the five sustainability indicators for the sector over the past five years. The indicators reflect each entity's funding and expenditure policies, and identify whether these policies are sustainable.
Financial sustainability should be viewed from both the short and long-term perspective. The shorter-term indicators—underlying result and liquidity—focus on an entity's ability to maintain positive operating cash flows and adequate cash holdings, and to generate an operating surplus over time.
The longer-term indicators—debt-to-equity, self-financing and capital replacement—identify whether adequate funding is available to repay debt, replace assets to maintain the quality of service delivery, and to meet community expectations and the demand for services.
5.3.1 Underlying result
Figure 5C shows that the average underlying result has deteriorated over the past three years.
Figure 5C
Average underlying result
Source: Victorian Auditor-General’s Office.
Ten of the 14 TAFEs generated an operating surplus in 2012 (10 in 2011). However, only four of the 10 reported an improved underlying result in 2012. The worsening position indicates that expenses are growing faster than revenue and places the long‑term financial sustainability of TAFEs at risk.
During the past five years, nine of the 14 TAFEs recorded a deficit at least once.
Figure 5D shows the number of TAFEs in the medium-risk category was consistent with 2011.
Figure 5D
Underlying result risk assessment
Source: Victorian Auditor-General’s Office.
5.3.2 Liquidity
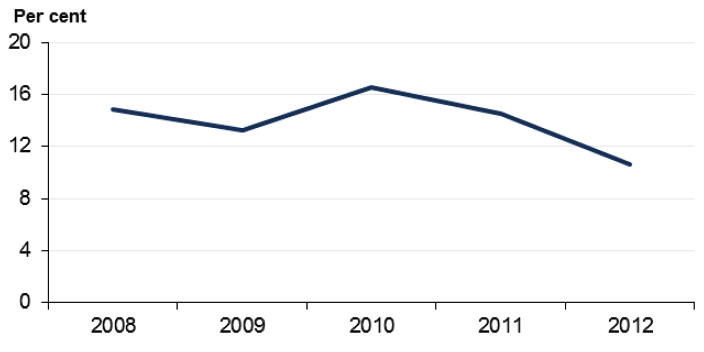
Figure 5E shows that current assets have exceeded current liabilities in each of the past five years.
Figure 5E
Average liquidity indicator
Source: Victorian Auditor-General’s Office.
All 14 TAFEs were in the low-risk category for the liquidity indicator for each of the five years. Current assets are at least three times the value of current liabilities. TAFEs have few liabilities, largely limited to payables and employee-related provisions.
5.3.3 Debt-to-equity
Figure 5F shows that all TAFEs were in the low-risk category for the debt-to-equity ratio for the past five years.
Figure 5F
Average debt-to-equity indicator
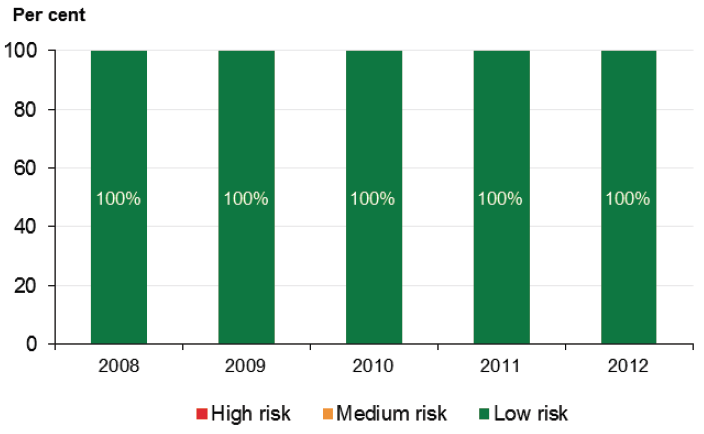
Source: Victorian Auditor-General’s Office.
5.3.4 Self-financing
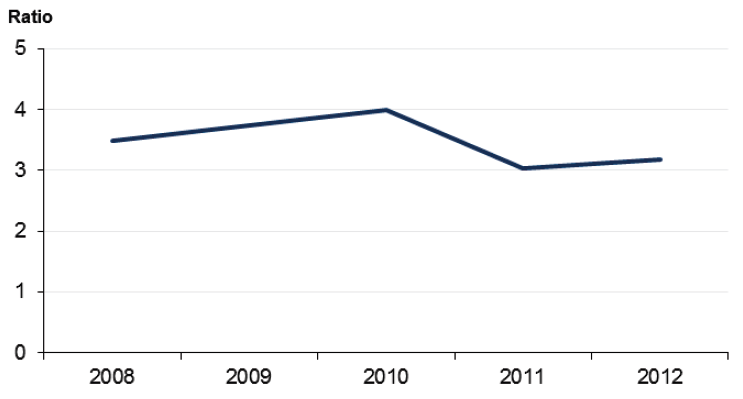
Figure 5G shows the significant decline in the TAFE sector's self-financing indicator since 2010.
Figure 5G
Average self-financing indicator
Source: Victorian Auditor-General’s Office.
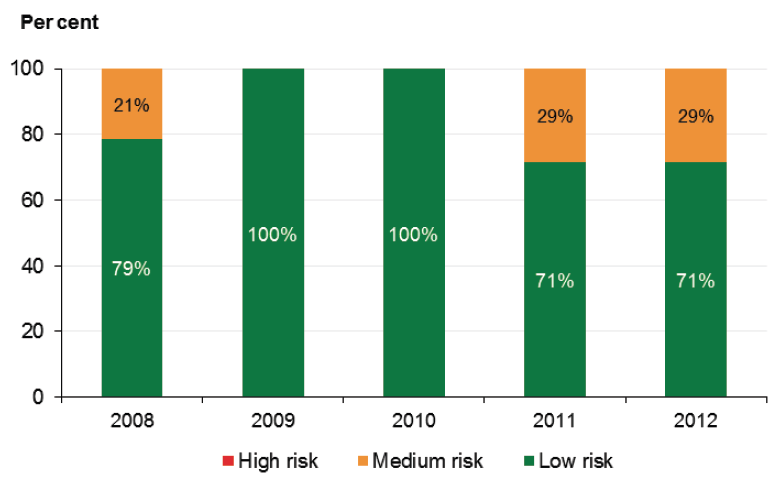
Figure 5H shows that the majority of TAFEs (eight of 14) now have a self-financing risk of high and that 86 per cent are now in the high- or medium-risk categories (72 per cent in 2011).
Figure 5H
Self-financing risk assessment
Source: Victorian Auditor-General’s Office.
Most TAFEs are not able to generate sufficient cash from their operating activities to fund asset replacement. The government's review of financing arrangements may enable TAFEs to borrow funds for asset replacement. In addition, on 7 May 2013 the government confirmed that $100 million in contestable capital funding would be provided to help meet this shortfall over the next four years.
5.3.5 Capital replacement
Figure 5I shows a significant increase in the number of entities in the high-risk category over the five-year period.
Figure 5I
Capital replacement risk assessment
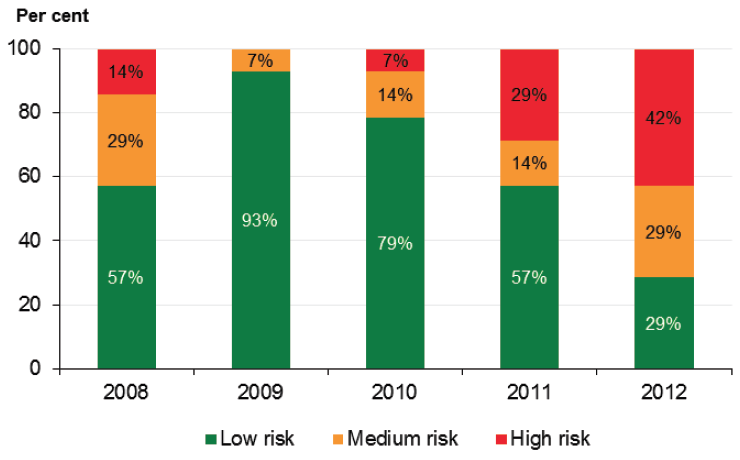
Source: Victorian Auditor-General’s Office.
Ten of the 14 TAFEs (71 per cent) are now in either the medium or high-risk category. If greater capital investment does not occur, assets will deteriorate at a greater rate than they are replaced or renewed. This presents a risk to the long-term financial sustainability of TAFEs, as buildings and other infrastructure assets will become unusable.
Capital spending has decreased over the past three years, while depreciation expenses have increased.
Government capital grants to the TAFE sector decreased by 40 per cent to $59.1 million in 2012. The decline, in conjunction with poor capital replacement indicator results, highlights the dependence of TAFEs on government funding to undertake capital programs.
6 Internal controls – TAFEs
At a glance
Background
This chapter presents the results of our assessment of general internal controls and controls over internal audit and credit cards in the technical and further education (TAFE) sector.
Conclusion
Internal controls were adequate for producing reliable, materially accurate and timely financial reports. All TAFEs had internal audit functions that reflected many of the better practice elements in the framework. Frameworks and associated controls for use of credit cards for purchasing were generally sound. Early action is needed by noncompliant TAFEs to develop policies for credit and debit card revenue, achieve compliance with the Payment Card Industry-Data Security Standard (PCI‑DSS) and actively manage the associated risks.
Findings
- Forty-six per cent of internal audit charters (six of 13) did not address the process for selecting the internal auditors, and five did not have arrangements for internal auditors to report conflicts of interest.
- Only seven of 14 TAFEs had self-assessed compliance with the PCI-DSS.
Recommendations
That TAFEs:
- revise internal audit charters to address reporting conflicts of interest of internal auditors, and to outline the selection process for internal audit providers
- obtain regular internal audit assurance over key business areas, in particular cash management and operational efficiency and effectiveness
- obtain annual certification of compliance with agreements from cardholders
- identify risks associated with using credit cards for purchasing, and mitigation strategies
- develop policies for revenue paid by credit or debit cards and achieve compliance with the Payment Card Industry-Data Security Standard, and actively manage the associated risks in order to protect the security of payers' personal information.
6.1 Introduction
Comprehensive internal controls help entities reliably and cost-effectively meet their objectives. Reliable internal controls are a prerequisite for the delivery of reliable, accurate and timely external and internal financial reports.
In our annual audits we focus on the internal controls relating to financial reporting and assess whether entities have managed the risk that the financial statements may not be complete and accurate. Poor internal controls diminish management's ability to achieve their entity's objectives and comply with relevant legislation. They also increase the risk of fraud and error.
The governing body of each technical and further education (TAFE) institute is responsible for developing and maintaining internal controls that enable:
- preparation of accurate financial reports and other supporting information
- timely and reliable external and internal reporting
- appropriate safeguarding of assets
- prevention and detection of errors and irregularities.
The Education and Training Reform Act 2006 and the Financial Management Act 1994 require management of TAFE institutes to implement effective internal control structures.
In this chapter we report on aspects of internal controls in the state's 14 TAFEs including:
- general internal controls
- internal audit
- credit card management.
6.2 General internal controls
Internal controls at the 14 TAFEs were adequate for maintaining the reliability of external financial reporting. Nevertheless, a number of control weaknesses were reported to governing bodies and management during the course of the 2012 audits.
The commonly identified areas that require improvement were:
- account reconciliations
- documentation of policies
- segregation of duties.
Weaknesses found during audits were brought to the attention of an entity's chairperson, management and audit committee by way of management letters.
6.2.1 Account reconciliations
A financial report is prepared based on information captured in an entity's general ledger. Key balances within the general ledger are often supported by information recorded in subsidiary ledgers such as accounts payable, billing, fixed assets and payroll systems. Periodic reconciliation of the general ledger with subsidiary ledger balances is vital to confirm the completeness and accuracy of data.
While TAFEs were generally preparing key account reconciliations, we identified a number of instances where improvements could be made. In some instances reconciliations had not been prepared or reviewed.
6.2.2 Documentation of policies
Documented policies provide a frame of reference for staff, and communicate management's expectations in relation to particular activities. In the absence of documented policies the opportunity for fraud increases.
TAFEs generally had policies addressing their key financial processes. However, there were several instances where policies were either deficient or non-existent. This included policies for cash collection, the use of purchasing cards and managing IT user accounts.
6.2.3 Segregation of duties
Sound financial management involves the segregation of key accounting responsibilities to maintain integrity, minimise errors and mitigate the risk of fraud. Functions such as payment of suppliers and employees, or approval of reconciliations should be performed independently by different staff.
Several TAFEs cited staff resourcing shortfalls as the reason behind a lack of segregation of duties. Management must ensure that the risk of poor segregation of duties is mitigated.
6.2.4 Status of prior year issues
Internal control weaknesses reported to management, the governing body and/or audit committee should be actioned and resolved in a timely manner. Sixteen of the 30 internal control weaknesses identified and reported to management at six TAFEs in 2011 or earlier were not resolved by management at the time of the 2012 audits.
While action to address outstanding issues was proceeding on some matters, failure to address previously identified and reported internal control weaknesses reflects poorly on the governing body and management of each of the six TAFEs.
6.3 Internal audit
Internal audit is a key mechanism available to TAFE governing boards to support the discharge of their governance and oversight responsibilities. Internal auditors can review core internal controls and identify areas of risk within an entity, providing assurance to management on the operational effectiveness of key controls. They may also identify and report on deficiencies or control weaknesses that need to be addressed.
An effective internal audit function strengthens internal controls, adding credibility to both the financial and non-financial information produced, as well as improving the efficiency of key controls and processes.
6.3.1 Internal audit framework
The key elements of an effective internal audit function are detailed in Figure 6A. The table draws on the Australian National Audit Office better practice guide Public Sector Internal Audit – an investment in assurance and business improvement, September 2012.
Figure 6A
Key elements of an effective internal audit function
|
Component |
Key elements |
|---|---|
|
Policy |
Policy established and requires an internal audit function to be in place. Internal audit charter is established and sets out:
Policy and charter reviewed by the board. |
|
Management practices |
Comprehensive audit program developed for a minimum three-year period, and directly linked to the entity’s identified risks. Internal audit program:
Reporting to the audit committee is regular and comprehensive. |
|
Governance and oversight |
Audit committee annually reviews internal audit performance and regularly monitors:
Issues register maintained, which details the:
Action taken to address identified issues is monitored by the audit committee and senior management. Internal audit performance reviewed annually by the audit committee, and action taken to address issues identified. Policy and charter reviewed periodically and approved by the board. |
Source: Victorian Auditor-General’s Office.
These elements were considered in our assessment of the internal audit function in each of the 14 TAFEs.
Conclusion
Internal audit frameworks across the TAFE sector were generally sound. All had policies in place, and internal audit reported regularly to the audit committee. All TAFEs had internal audit functions that were 'developed' or better, reflecting many of the better practice elements in the framework. Nevertheless, there are opportunities for improvement across the sector in policy content and internal audit coverage of some key business areas.
6.3.2 Policies
Each of the 14 TAFEs had an internal audit policy or charter. The charters contained the majority of better practice elements outlined in Figure 6A.
Across the sector, policies commonly incorporated the following better practice elements:
- details of roles and responsibilities
- clear reporting lines to management and audit committee
- need for operational independence.
However the following better practice elements were not addressed by a number of tertiary education bodies:
- outline of the process for selecting the internal audit service provider
- arrangements for reporting conflicts of interest of internal auditors
- requirements for periodic review.
Reporting internal audit conflict of interest
Policies at five TAFEs had no arrangements for reporting conflicts of interest of internal auditors. Independence is a central characteristic of an effective internal audit function, to maintain integrity and to avoid the appearance of bias.
All TAFE institutes use external service providers. However, it was concerning that six internal audit charters did not address the process for selecting the internal auditors. There is a risk that the internal auditors appointed may not have appropriate qualifications, experience or understanding of the entity required for a quality internal audit function.
Review of policy and charter
Thirty-six per cent of TAFE charters did not include requirements for periodic review of the policy.
6.3.3 Management practices
Management at each of the TAFEs had developed an internal audit program outlining the audit coverage to be achieved, and regularly reported to the audit committee on the status of recommendation implementation.
Internal audit program
Internal audit programs were generally for three years, and included sufficient detail of the work to be completed, costs, resources and links with relevant entity risks.
Programs had clear time lines, identifying key milestones and the reporting date for each audit.
Approval by audit committee
Audit committees at all 14 TAFEs had signed off their respective internal audit program.
6.3.4 Governance and oversight
Reporting to the audit committee
Each of the 14 TAFEs had an audit committee that regularly reviewed internal audit reports. Eleven (79 per cent) also maintained an issues register, populated by internal audit's findings and recommendations.
Follow up of implementation of recommendations
All audit committees followed up internal audit recommendations to monitor their implementation, and to hold management accountable for addressing issues raised.
Periodic review of internal audit arrangements
Only 11 of the 14 TAFEs had reviewed their internal audit arrangements within the past three years. The remaining three should conduct a review of their arrangements in a timely manner in order to identify improvements and maintain alignment with organisational objectives and risks.
6.3.5 Comprehensiveness of internal audit program
We identified seven key business activities common to the 14 TAFEs, and assessed whether they had been subjected to internal audit scrutiny over the past three years.
Twelve TAFEs achieved coverage over at least six of these activities. The remaining two TAFEs had only reviewed four of the seven activities, indicating that further attention by internal audit is required.
Figure 6B highlights the common key business activities, and the percentage of TAFEs that had addressed them through internal audits.
Figure 6B
Review of internal audit coverage in TAFEs
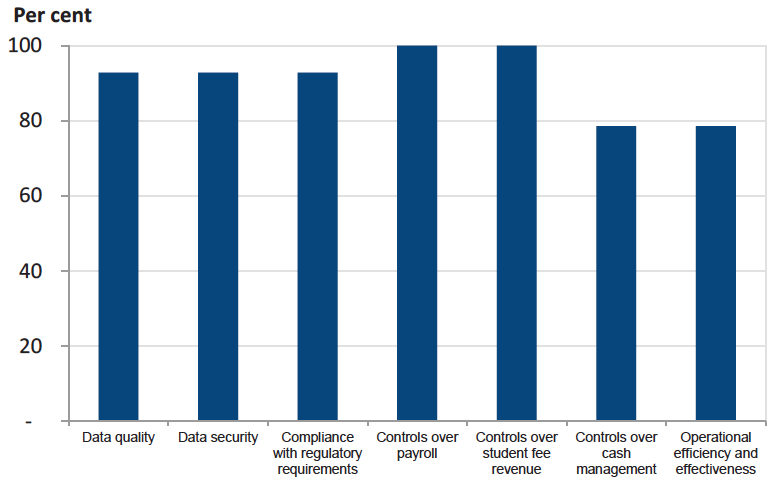
Source: Victorian Auditor-General’s Office.
Our analysis revealed opportunity for greater coverage of controls over cash management and operational efficiency and effectiveness. These functions had not been reviewed at 21 per cent of TAFEs (three of 14).
The comparatively lower coverage of cash management is concerning, as cash is an item highly susceptible to theft or misuse and is highly portable and difficult to trace. Internal audit scrutiny can help improve the controls in this area and reduce the potential for fraud.
Ineffective or inefficient processes can raise probity issues, expose an entity to reputational risk or lead to waste of public resources. In the tight economic times, internal audit reviews of efficiency and effectiveness can improve business processes and identify savings.
6.4 Purchasing by credit card
Credit cards enable entities to purchase goods and services with reduced administrative costs, greater convenience and flexibility for staff compared to using cash or cheques. However, they can expose entities to the risk of inappropriate or unauthorised expenditure, and are a high fraud risk.
Credit card expenditure for the sector was projected to be $6.2 million in 2012. Figure 6C compares the number of cards on issue across the 14 TAFEs and the expenditure incurred for the past two years.
Figure 6C
Number of credit cards and expenditure incurred, 2011 and 2012
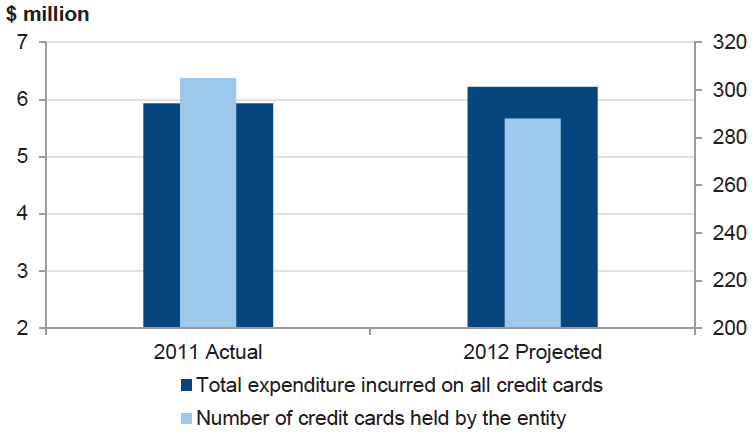
Note: 2012 projected figures were obtained during the course of the 2012 audits.
Source: Victorian Auditor-General’s Office.
The overall spend was projected to increase slightly to $6.2 million in 2012 ($5.9 million in 2011). This is consistent with entities' increasing preference for making purchases with credit cards.
However the number of credit cards at TAFEs decreased by 6 per cent in 2012. The scaling back of operations in the TAFE sector due to the changed funding model has resulted in campus closures and staff redundancies, leading to fewer cards.
6.4.1 Credit card framework
Figure 6D outlines the key components of an effective credit card management framework. It draws on the:
- Standing Directions of the Minister for Finance, ‘Purchasing Card Rules for the Use and Administration’
- New South Wales Treasury 2005 policy and guidelines paper ‘Credit Card Use Best Practice Guide’
- Victorian Auditor-General's Office 2012 performance audit report Personal Expense Reimbursement, Travel Expenses and Corporate Credit Cards.
Figure 6D
Key elements of an effective credit card framework
|
Component |
Key elements |
|---|---|
|
Policy |
Policy established and includes:
Policy consistent with Minister for Finance Standing Directions and other legislative requirements. Policy approved by the governing body. |
|
Management practices |
Delegation limits reviewed annually. Usage monitored regularly to ensure financial delegations and individual transaction limits not exceeded and expenditure types appropriate. Schedule of responsibilities issued to and signed by card holder acknowledging conditions of use (cardholder agreement). Card holders certify annually that they have complied with credit card policy. Risks related to use of credit cards identified and managed. Administration, authorisation and accounting for credit cards performed by staff other than cardholders. Documents from credit card use retained and easily accessible. Credit card transactions recorded, approved and reconciled in a timely manner. Compliance with policy monitored. Comprehensive and regular reporting to executive and board. Policies, practices and processes periodically reviewed by management. |
|
Governance and oversight |
Reports addressing usage and compliance with policy are received regularly and considered by the board. The number of credit cards issued and frequency of use periodically reviewed and addressed as necessary. Internal audit periodically engaged to review policy compliance and processes and appropriateness of use, and opportunities for improvement actioned. Risks associated with credit card usage periodically reviewed. Policy periodically reviewed and approved by the board. |
Source: Victorian Auditor-General’s Office.
These elements were considered in our assessment of credit card management in each of the 14 TAFEs.
Conclusion
None of the TAFEs recorded a 'better practice' rating for their credit card management, indicating that they had not addressed all elements in the framework. Attention should be given to risk identification, oversight and obtaining annual certification from cardholders on their compliance with entity policies and cardholder agreements.
6.4.2 Policies
Existence of credit card policies
Thirteen of the 14 TAFEs (93 per cent) had a policy addressing the use of credit cards. The remaining TAFE had not expressly considered the use of credit cards in its procurement policy, however, was in the process of drafting a related policy. Where established, credit card policies were generally based on the Standing Directions of the Minister for Finance, ‘Purchasing Card Rules for the Use and Administration’.
The following better practice elements were addressed at each of the 13 TAFEs that had a credit card policy:
- eligibility criteria for having a credit card
- scope and conditions for use
- approval process
- financial delegations
- documentation required to substantiate purchases
- security measures in the event of loss or theft of card.
There was room for improvement as 38 per cent of TAFEs (five of 13) had not addressed training requirements for new cardholders in their policy. Training is an important component of a control framework as it familiarises staff with the conditions of use and management's expectations.
Reporting requirements
Where established, policies required card misuse to be followed up by management, with 69 per cent of policies requiring this information to be reported the board or audit committee (nine of 13).
No instances of credit card fraud or misuse were reported during 2012.
6.4.3 Management practices
Certification by cardholders of cardholder agreement
All cardholders were required to sign agreements, acknowledging their responsibilities and the conditions of use, in advance of the cards being issued.
Annual certification of compliance
Better practice involves entities obtaining annual certification from all cardholders, confirming their compliance with the relevant conditions of use. This provides a level of assurance to management that cardholders have complied with the policy. Nine of the 14 TAFEs (64 per cent) did not obtain annual certification from cardholders.
Risk management
Where cardholders are also involved in an entity's accounts payable function—such as invoice processing or acquitting transactions—the opportunity for them to commit fraud increases.
Cardholders had access to the payments system or accounts payable module at five TAFEs (36 per cent).
However, management at all 14 had implemented appropriate controls and restrictions to largely mitigate the risk. This included restricting cardholders to read-only access, limiting their data input functionality or their ability to amend personal card details.
6.4.4 Governance and oversight
Reporting
Credit card activity reports were not generally reported to TAFE boards—the information was reviewed by the Chief Executive or Chief Financial Officer.
High level reports detailing the number of credit cards issued and the frequency of use was reviewed at the board level at five TAFEs. While not essential, such information enables a board to better determine the nature and impact of related risks to the TAFE. A nil-return report, for example, would provide the board with regular assurance that no instances of card misuse had been detected.
Review of arrangements and risks
All TAFEs had engaged internal audit to review their credit card arrangements during the past three years.
Boards or audit committees at 11 of the 14 TAFEs had reviewed the risks associated with credit cards within the past two years. Only nine had included risks associated with credit card use in their strategic risk register.
6.4.5 Testing of controls over credit card use
As part of our assessment of management and use of credit cards we sampled credit card transactions at each of the 14 TAFEs and tested a selection of key internal controls. The results are summarised in Figure 6E.
Figure 6E
Results of credit card controls testing
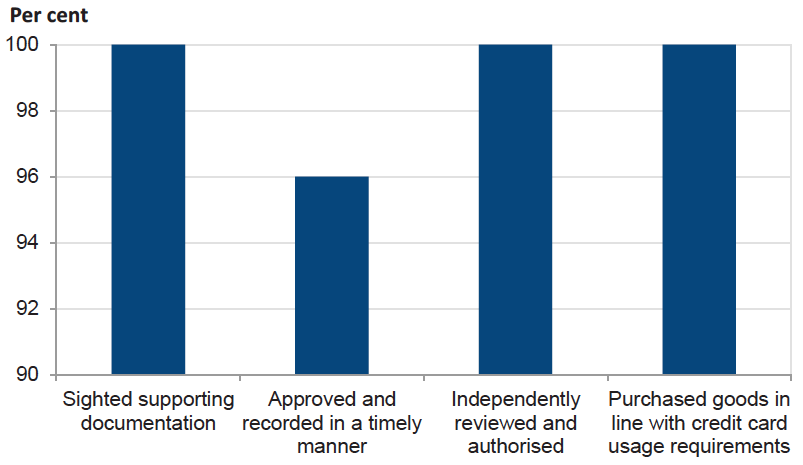
Source: Victorian Auditor-General’s Office.
The timeliness of approving transactions could be improved to enable management to identify problems early, so that appropriate corrective action can be undertaken. All other results were satisfactory.
6.5 Fee payment by credit card
Students have a range of options for paying their tuition fees, including payment by cash, cheque, Bpay, credit card and debit card.
Students can make payments using their credit/debit cards at all TAFEs.
Figure 6F shows the payment options currently used by students to pay their fees. However, as six TAFEs were unable to provide breakdowns of their receipting methods, the data relates to the eight TAFEs from which data was available.
Figure 6F
Payment options used by students to pay fees, 2012
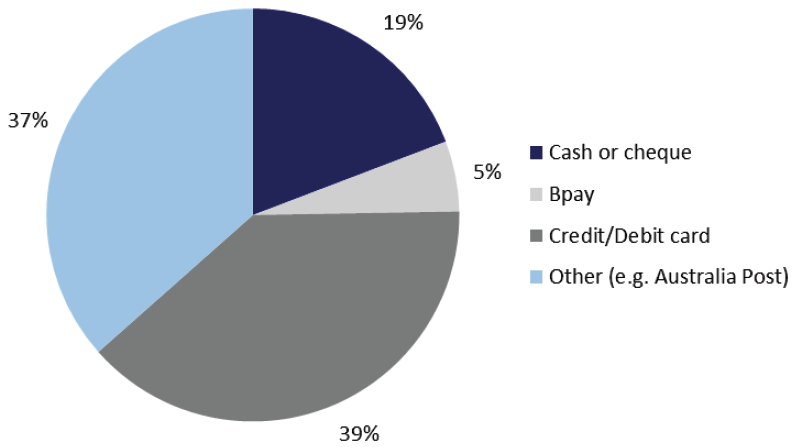
Source: Victorian Auditor-General’s Office.
Figure 6F shows that payment by credit or debit card was the preferred payment method for students in 2012. Payments through Bpay or other facilities can also involve credit or debit cards.
6.5.1 Compliance with the Payment Card Industry-Data Security Standard
Entities that receive debit and credit card payments need policies and procedures for handling customer personal information, or sufficient assurance from facilitating agencies that personal information of payers is protected and that the revenue data is accurate and complete.
The Payment Card Industry-Data Security Standard (2010) (PCI-DSS) addresses the storage and handling of customer credit and debit card information and data. It was developed by MasterCard, Visa, American Express, Discover Financial Services and JCB to establish consistent data security requirements across the globe.
PCI–DSS deals with systems, policies and procedures for:
- establishing and maintaining a secure network
- protecting cardholder data
- maintaining a vulnerability management program
- strong access controls
- regular monitoring and testing of networks
- maintaining an information security policy.
Any entity that processes, stores and transmits credit or debit card information and data should comply with the standard.
Management at seven of the 14 TAFEs had self-assessed that they were compliant with the requirements of the PCI-DSS. Of the remaining seven, five had not developed a policy in relation to handling student credit card information.
Management at 71 per cent of TAFEs (10 of 14) had not assessed the risks associated with the handling of customer credit and debit card information and data.
The results are concerning as they show a lack of understanding of the importance of this high-risk activity.
Poor security controls and noncompliance with PCI-DSS increase the risk of identity theft and fraud and expose an entity to a loss of reputational risk and financial penalties.
Early action is needed by the noncompliant TAFEs to develop policies for credit card revenue, achieve compliance with the PCI-DSS and actively manage the associated risks.
Recommendations
That TAFEs:
- revise internal audit charters to address reporting conflicts of interest of internal auditors, and to outline the selection process for internal audit providers
- obtain regular internal audit assurance over key business areas, in particular cash management and operational efficiency and effectiveness
- obtain annual certification of compliance with agreements from cardholders
- identify risks associated with using credit cards for purchasing, and mitigation strategies
- develop policies for revenue paid by credit or debit cards and achieve compliance with the Payment Card Industry-Data Security Standard, and actively manage the associated risks in order to protect the security of payers' personal information.
7 Financial results – Universities
At a glance
Background
Accrual-based financial statements enable an assessment of whether entities are generating sufficient surpluses from operations to maintain services, fund asset maintenance and retire debt. This chapter analyses the financial results of the eight universities, including the four dual-sector universities, for the year-ended 31 December 2012.
Findings
- Universities generated a combined surplus of $454.6 million in 2012, a decrease of 5.0 per cent over the 2011 result.
- Expenses grew faster than revenue, with employee benefits increasing by $308.6million and depreciation by $45.1 million from 2011.
- Total student fee revenue grew by $107.4 million or 4.3 per cent in 2012
- International student fees increased by $316.3 million to $1.35 billion in 2012.
- The revaluation of land and buildings resulted in a $1.8 billion increase in asset values, an increase of 12.3 per cent from 2011.
- Overseas university campuses examined have experienced mixed financial success, with:
- Monash South Africa recording deficits in the past two years and dependent on Monash University for financial support
- Monash Property South Africa mainly funded by loans provided by Monash University
- RMIT International University Vietnam reporting surpluses in the past two years, and with no outstanding debt.
7.1 Introduction
Accrual-based financial statements enable an assessment of whether entities are generating sufficient surpluses from operations to maintain services, fund asset maintenance and retire debt. This chapter analyses the financial results of the eight universities for the year ended 31 December 2012.
Four of the eight universities are dual-sector entities, that is, they offer vocational education and training (VET) courses similar to the technical and further education institutes as well as university courses. The financial results for the dual-sector entities are included in this chapter.
7.2 Financial results
7.2.1 Financial performance
Victoria's universities generated a net profit of $454.6 million in 2012, a decrease of $23.9 million or 5.0 per cent over the prior year. This was mainly due to:
- an increase of $308.6 million or 8.1 per cent in employee benefits
- an increase of $45.1 million or 10.6 per cent in depreciation and amortisation
- a decrease of $31.3 million or 15.9 per cent in investment revenue.
These were partially offset by an increase of $388.1 million or 9.4 per cent in government grants.
Seven of the eight universities recorded surpluses in 2012, continuing a trend from 2011. However, Victoria University reported a deficit of $6.5 million, compared with an $8.7 million surplus in 2011, mainly due to an increase in employee wage and redundancy costs.
Figure 7A provides a comparison of the total operating result for universities for 2012 and 2011.
Figure 7A
Net surplus/(deficit) by university, 2011 and 2012
|
Entity |
2012 |
2011 |
|---|---|---|
|
Deakin University |
107 388 |
75 621 |
|
La Trobe University |
34 297 |
83 785 |
|
Monash University |
77 931 |
83 328 |
|
RMIT University |
49 605 |
55 273 |
|
Swinburne University of Technology |
26 772 |
46 827 |
|
The University of Melbourne |
105 481 |
82 149 |
|
University of Ballarat |
59 643 |
42 813 |
|
Victoria University |
(6 486) |
8 727 |
|
Total |
454 631 |
478 523 |
Source: Victorian Auditor-General’s Office.
Revenue
In 2012, the eight universities generated revenue of $7.3 billion, an increase of $741.0 million from 2011. The increase was driven by higher Commonwealth Government grants and a deferred government superannuation contribution of $322.6 million. This contribution represents the future expected receivable associated with the defined benefits superannuation program, and was offset by a corresponding deferred employment liability.
The composition of operating revenue for 2012 is presented in Figure 7B.
Figure 7B
Revenue composition, 2012
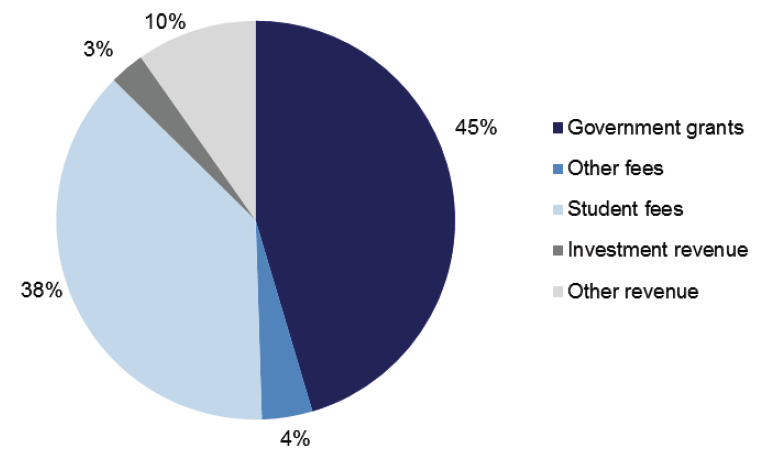
Source: Victorian Auditor-General’s Office.
Government funding remained the largest revenue component, comprising 45 per cent of total revenue in 2012. Revenue composition was consistent with the prior year.
Trends in student fee revenue
Student fees are a significant portion of self-generated revenue for universities and comprised 37.9 per cent of total revenue in 2012. This revenue includes amounts received from the Commonwealth Government in respect of the HECS-HELP and FEE-HELP programs.
Overall student fee revenue grew by $107.4 million or 4.3 per cent to $2.6 billion in 2012. Significant increases were reported at:
- The University of Melbourne—an increase of $42.6 million or 8.2 per cent
- University of Ballarat—an increase of $10.7 million or 13.1 per cent.
The remaining six universities reported growth in total student fee revenue of less than 5 per cent in 2012.
Increased student fee revenue contributed toward the operating surpluses of seven universities. However, despite a $7.7 million increase in student fee revenue, Victoria University reported a $15.2 million decrease in its operating result in 2012.
International students
International students attending Victorian universities come from more than 106 countries. The six most represented countries are China, Malaysia, India, Indonesia, Vietnam and Singapore.
There was an overall decline in international student numbers for the sector in 2012, with total enrolments down 2.3 per cent to approximately 53 900 in 2012. Despite this, new enrolments reached the highest level in five years, increasing by 11.1 per cent on 2011. The number of Indian students commencements increased by 54.1 per cent during 2012 (33.7 per cent decrease in 2011).
Figure 7C indicates the number of onshore international students commencing at universities in 2012 compared to 2011. The six most common countries of origin are shown individually while 'other' includes students from over 100 countries.
Figure 7C
Onshore international students commencing, 2011 and 2012
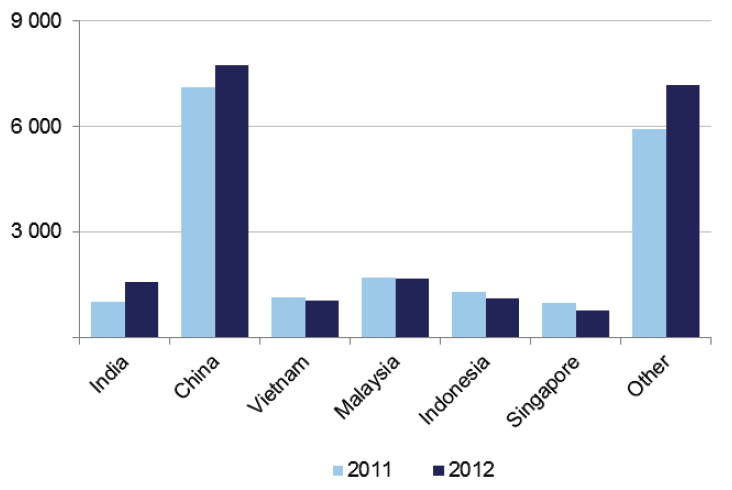
Source: Victorian Auditor-General’s Office.
The data show there was an increase in onshore Indian and Chinese and 'other' student commencements in 2012. Commencing students from the other four countries identified fell during 2012, albeit slightly in some cases.
International student fees represented 51.1 per cent of total student fee revenue for universities in 2012.
International student fee revenue has increased by $316.3 million over the past five years to $1.35 billion in 2012. This revenue growth has allowed the universities to maintain strong surpluses since 2009.
Figure 7D shows the relationship between international student fee revenue and operating surpluses of universities over the past five years. The figures include fees from both onshore and offshore international students.
Figure 7D
International student fee revenue and operating surpluses
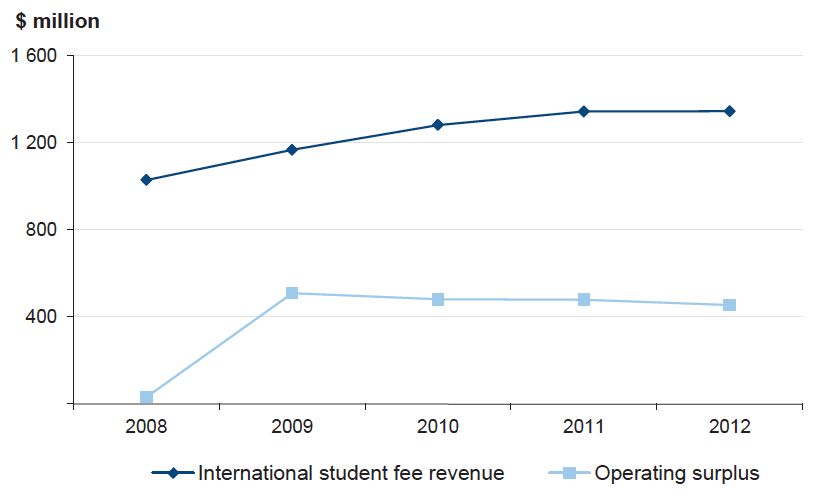
Source: Victorian Auditor-General’s Office.
Domestic students
All eight universities reported growth in revenue from domestic student fees in 2012. The increase in domestic student fees was $106.0 million or 9.0 per cent for the year.
Domestic student fees in 2012 represented 48.9 per cent of total university student fee revenue.
Expenses
In 2012 the eight universities incurred $6.8 billion in expenses, an increase of $761.0 million or 12.6 per cent from the prior year. The increase was driven by higher employee wage costs and the deferred employee benefits superannuation expense of $322.8 million ($5.4 million in 2011). This expense is offset by the deferred government superannuation contribution.
The composition of expenditure is presented in Figure 7E.
Figure 7E
Expenditure composition, 2012
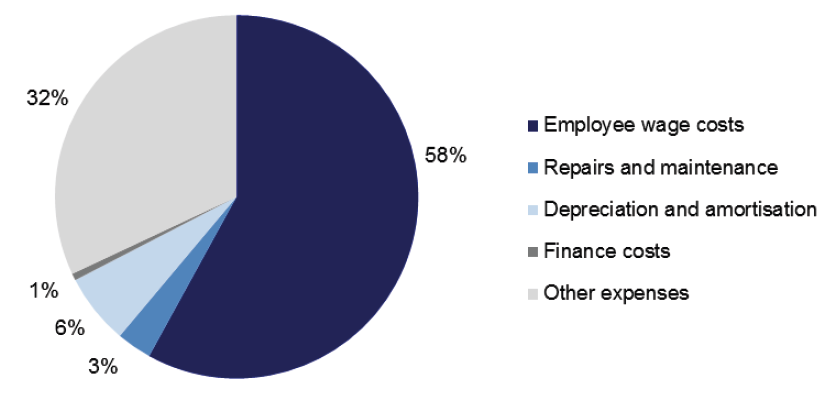
Source: Victorian Auditor-General’s Office.
Other expenses typically included:
- scholarships and prizes
- grant payments
- learning materials
- contractors and professional services.
The composition of expenditure was consistent between 2011 and 2012.
7.3 Financial position
Universities carry land and buildings of significant value on their balance sheets, representing 68 per cent of their total assets. However, their revenue base is not tied to the value of their assets and most of their assets cannot be readily sold to obtain funds.
The objective for a university should, therefore, be to maintain and improve its asset base and related service provision, while managing levels of debt.
7.3.1 Assets
During 2012 the total value of assets increased by $1.8 billion or 12.3 per cent to $16.2 billion. This was mainly due to increases of $1.3 billion or 13.3 per cent in property, plant and equipment and financial assets of $243.9 million or 15.2 per cent.
The movements were driven by the construction of new buildings, and actuarial revaluations of land and buildings. Land assets of The University of Melbourne were revalued by the Valuer-General and increased by $188.9 million or 26.5 per cent, adding to the revaluation conducted in 2011.
The composition of assets was consistent with the prior year, with property, plant and equipment continuing to represent the majority of total assets.
7.3.2 Liabilities
At 31 December 2012 the total value of liabilities was $4.4 billion—an increase of $672.1 million or 18.2 per cent from the 2011 figure.
The deferred superannuation liability grew by 27.2 per cent to $1.7 billion during 2012 and now represents 39 per cent of total liabilities (36 per cent in 2011). The liability is based on an actuarial assessment, and represents amounts expected to be paid to university employees who qualify for the defined benefits superannuation program.
Interest bearing liabilities increased by $120.0 million or 18.0 per cent during 2012, mainly due to borrowings by the RMIT and La Trobe universities. The borrowings were used to fund the construction of new and expanded building facilities.
7.4 Overseas campuses
Some Victorian universities have a vision to be global universities, to be known and respected internationally and, as a result, have established overseas campuses. The overseas campuses are either fully-fledged universities or smaller ventures or schools.
7.4.1 Overview
Overseas campuses operated by Victorian-based universities have experienced mixed financial success. Some require significant ongoing investment in the form of loans or equity contributions. In 2012 two required letters of support in order to meet the going concern test, demonstrating their financial dependence on their parent entity. One overseas campus has thrived, and generated surpluses in each of the past five years.
Monash University and RMIT University have established overseas campuses in South Africa and Vietnam. Monash University's South Africa campus is structured through two companies, with one holding the infrastructure assets and the other responsible for campus operations.
For the purposes of this report, we have limited our analysis of overseas operations to the three entities associated with these two campuses.
We have not analysed the operations of Monash University's 45 per cent partnership in Malaysia at the Monash University Sunway Campus. Monash University received $44.5 million in royalties, licence fees and course development revenue from this operation over the past five years.
7.4.2 Levels of investment and operating results
Over the past five years, Monash University and RMIT University have invested more than $41 million in equity contributions and loans to the overseas campuses. Loan repayments and interest charges paid to Monash University by its subsidiaries since 2008 have totalled $7.1 million.
Figure 7F presents the value of Monash University and RMIT University's investment in their overseas campuses and the operating results for the past two years.
Figure 7F
Operating results and investment value, 2011 and 2012
|
Overseas campus |
Investment value |
Operating result |
||
|---|---|---|---|---|
|
2012 |
2011 |
2012 |
2011 |
|
|
Monash South Africa |
0 |
0 |
(2 705) |
(4 461) |
|
Monash Property South Africa |
11 645 |
6 000 |
1 763 |
502 |
|
Total Monash University |
11 645 |
6 000 |
(942) |
(3 959) |
|
RMIT International University Vietnam |
31 208 |
31 208 |
6 169 |
2 438 |
|
Total RMIT University |
31 208 |
31 208 |
6 169 |
2 438 |
Source: Victorian Auditor-General’s Office.
Neither of the overseas campuses has paid a dividend to its parent entity during the past four years, as:
- the constitution of Monash Property South Africa (MPSA) specifically provides that no dividends can be paid
- Monash South Africa (MSA) has consistently reported operating losses
- RMIT International University Vietnam (RIUV) has reinvested the majority of its operating surpluses into its capital program.
7.4.3 Cash flows
Figure 7G shows the net cash flows from these overseas universities for the past five years.
Figure 7G
Net cash flows from overseas universities
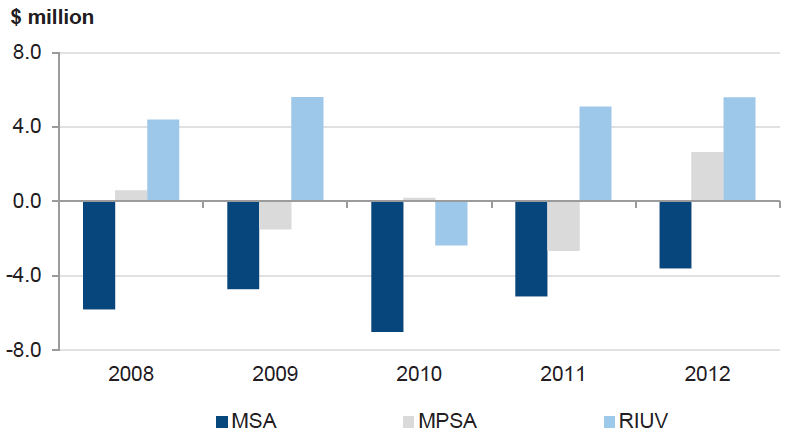
Source: Victorian Auditor-General’s Office.
The data show that Monash University has provided loan advances totalling $26.2 million to MSA during the past five years. While still heavily dependent on loans, it is positive that the advances have reduced year on year over the past three years and the operating deficit decreased between 2011 and 2012.
MPSA made a repayment of loan principal to Monash University in 2012, but required additional loan funding in 2009 and 2011 for the construction of two education buildings associated with the growth in student numbers.
Amounts paid by RIUV to RMIT University are from transactions negotiated on commercial terms. These do not amount to a return on investment for the parent university, and are instead payments for services.
7.4.4 Analysis
Monash South Africa
MSA is an Australian company and a wholly owned subsidiary of Monash University. It is registered as a private higher education institution, and operates Monash University's campus in South Africa.
The data in Figure 7F show that MSA is completely funded by debt. At 31 December, $30.4 million in unsecured, interest-free loans was outstanding to Monash University ($28.5 million in 2011). During the past five years, loans of $26.2 million have been advanced to MSA. MSA has not made any loan repayments to its parent over that period. Student numbers have increased by 48.0 per cent since 2008, to 3 065 equivalent full-time students in 2012.
MSA does not currently provide a return on investment to its parent entity. It has recorded operating deficits totalling $22.6 million since 2008. Figure 7F shows that it delivered deficits in both 2011 and 2012, which have declined from a $5.8 million deficit in 2010.
During 2012 a letter of comfort was provided by Monash University, confirming its intention to support MSA financially, and meet its debts when they fall due. Monash University has also indicated that it does not currently intend to require repayment of loans advanced to MSA.
The letter of comfort from Monash University enabled MSA to meet the going concern test. Without it the financial statements of MSA would have been qualified.
Monash Property South Africa
MPSA is a wholly owned subsidiary of Monash University, incorporated in Australia, and holds the campus infrastructure and assets of the South Africa campus on its balance sheet. The developed property is leased to MSA and generates significant rental income.
MPSA is primarily funded by loans provided by Monash University, with a total outstanding loan balance of $17.8 million at 31 December 2012 ($25.3 million in 2011). The $5.5 million decrease was mainly due to conversion of debt to equity during 2012.
During the past five years Monash University has provided $7.8 million in new loans to MPSA. MPSA has repaid a total of $1.3 million in principal during that time. Monash University also received $5.8 million in interest relating to these loans.
In 2012 MPSA reported an operating surplus after tax of $1.8 million, although 55.2 per cent of this result was due to deferred tax benefits, partly resulting from the carry forward of losses.
MPSA received a letter of support in 2012, with Monash University confirming that it would support the subsidiary company financially. This extends to meeting expenditure commitments as and when they fall due.
The letter of comfort from Monash University enabled MPSA to meet the going concern test. Without it the financial statements of MPSA would have been qualified.
RMIT International University Vietnam
RIUV did not report any movements in its issued share capital in 2012. It delivered surpluses in each of the past two years.
RMIT University has expanded its university operations to Vietnam, which it controls through RIUV. The value of RMIT University's investment in its subsidiary was $31.2 million at 31 December 2012.
RIUV reported a strong after tax operating surplus of $6.2 million in 2012, an increase of $3.7 million from 2011. The company has cash reserves of $17.6 million, although 42.1 per cent of this balance relates to course fees received in advance from students.
The only funding provided by RMIT University to its overseas subsidiary during the past five years was a one-off capital contribution of $6.95 million in 2010. RIUV does not have any outstanding borrowings.
RIUV has invested $19.2 million in capital projects over the past two years from cash generated from its operating activities.
RIUV has not paid a dividend in the past four years, with the most recent return to owners a $0.7 million dividend in 2008. RMIT University has received a total of $26.1 million from its subsidiary during the past five years. These payments are the result of projects conducted on commercial terms, and do not constitute a direct return on investment for the parent entity.
The level of capital expansion and liquid assets, when considered in the context of the limited funding provided by the parent entity, indicates that RIUV is a profitable and sustainable overseas operation.
8 Financial sustainability – Universities
At a glance
Background
To be financially sustainable, entities need to be able to meet current and future expenditure as it falls due. They also need the ability to absorb foreseeable changes and materialising risks without significantly changing their revenue and expenditure policies. This chapter provides our insight into the financial sustainability of universities based on our analysis of the trends in five key financial indicators over a five-year period.
Conclusion
Six universities were assessed as having low financial sustainability risk in 2012. Victoria University was assessed as medium risk due to its poor self-financing indicator result. Monash University was assessed as having a high risk to its financial sustainability due to low liquidity. An analysis of the trends in the financial sustainability indicators shows no significant change in the sector's position from 2008–12.
Findings
- Universities generally recorded poor self-financing indicators, suggesting that they were unable to fund asset replacement and renewal from cash generated from their operating activities.
- Capital replacement indicator results were generally strong, however, there is an increasing reliance on capital grants from government to fund these programs.
8.1 Introduction
To be financially sustainable entities need the capacity to meet their current and future expenditure as it falls due. They must also be able to absorb foreseeable changes and financial risks as they materialise.
In this chapter we provide insight into the financial sustainability of Victoria's universities through analysing the trends in each of five financial sustainability indicators over a five-year period. The five indicators are:
- underlying result
- liquidity
- debt-to-equity
- self-financing
- capital replacement.
Appendix D describes the sustainability indicators and risk assessment criteria used in this report.
To form a definitive view of any entity’s financial sustainability, a holistic analysis that moves beyond financial indicators would be required, including an assessment of the entity’s operations and the regulatory environment in which the entity operates. These additional considerations are not examined in this report.
8.2 Financial sustainability
8.2.1 Overall assessment
Six universities were rated as having low financial sustainability risk. Victoria University was assessed as medium risk due to its poor self-financing indicator, while Monash University was assessed as high risk due to its low liquidity level.
Figure 8A provides a summary of our overall financial sustainability risk assessment results for the past two years.
Figure 8A
Two-year financial sustainability risk assessment
|
Entity |
2012 |
2011 |
|---|---|---|
|
Deakin University |
Low |
Low |
|
La Trobe University |
Low |
Low |
|
The University of Melbourne |
Low |
Low |
|
Monash University |
High |
High |
|
RMIT University |
Low |
Low |
|
Swinburne University |
Low |
Low |
|
University of Ballarat |
Low |
Low |
|
Victoria University |
Medium |
Medium |
|
Total |
8 |
8 |
Source: Victorian Auditor-General’s Office.
Despite its financial sustainability risk being assessed as high, Monash University had financial assets that were 'available for sale', which would be accessible for conversion to cash if required.
8.2.2 Summary of trends in risk assessments over the five‑year period
When the sector's risk assessments for each indicator are analysed they show the following trends over the five years to 2012:
- underlying result—there are no longer any universities in the high-risk category
- liquidity—the number of universities in all categories has remained stable
- debt-to-equity—all universities remain in the low-risk category
- self-financing—the number of universities in the high‑risk category has not changed, however, the majority of universities are assessed as medium risk over the period
- capital replacement—the position has improved, with the number of universities in the medium-risk category halving over the five-year period.
In summary, the trend shows no significant change in the sector's overall financial sustainability. Universities have generally recorded poor self-financing indicators, but performance against the other indicators has improved.
8.2.3 Analysis of trends in financial sustainability indicators across the five-year period
To further understand the results we analysed the five-year data for the five indicators. The relevant data are reproduced in Appendix B.
Figure 8B shows the mean sustainability risk assessments for the eight universities, over the five years from 2008 to 2012. High risk results are shown in red, medium risk in orange, and low risk in green.
Figure 8B
Five-year mean financial sustainability risk assessments
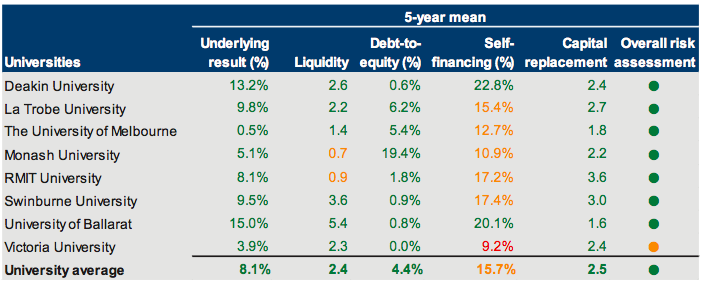
Source: Victorian Auditor-General’s Office.
All universities recorded operating surpluses and positive underlying result indicators over the past five years, with two exceptions—The University of Melbourne in 2008 and Victoria University in 2012. The magnitude of these surpluses has declined at five universities, however, the sector's position remains strong. Revenue growth has matched expenditure growth during the period, with all universities assessed as low risk on average.
Monash University and RMIT University recorded poorer liquidity indicator results than the sector average, however, the position has not changed significantly over the past five years. The other six universities have consistently maintained current assets well in excess of their short‑term liabilities.
Monash University had available for sale financial assets of $231.0 million at 31 December 2012. These assets have not been considered in the calculation of the liquidity indicator as they are classified as non-current, however, they are available for conversion to cash if required.
Debt-to-equity indicator results are not a concern for the sector. Debt levels are generally low, and as a result the risk for each university has consistently been rated as low for this indicator over the past five years.
With the exception of Deakin University, each university has recorded a poor self‑financing ratio over the past five years. Net cash inflows from operating activities have generally been less than 20 per cent of underlying revenue balances. While they generally have positive results for their capital replacement indicator, the poor self‑financing results for universities suggests they will not be able to fund asset replacement from cash generated from operating activities. This position has not changed significantly in the past five years.
8.3 Five-year trend analysis
This section provides analysis and commentary on each indicator's trend for the past five years.
8.3.1 Underlying result
Figure 8C shows that the average underlying result has deteriorated slightly in the past two years.
Figure 8C
Average underlying result
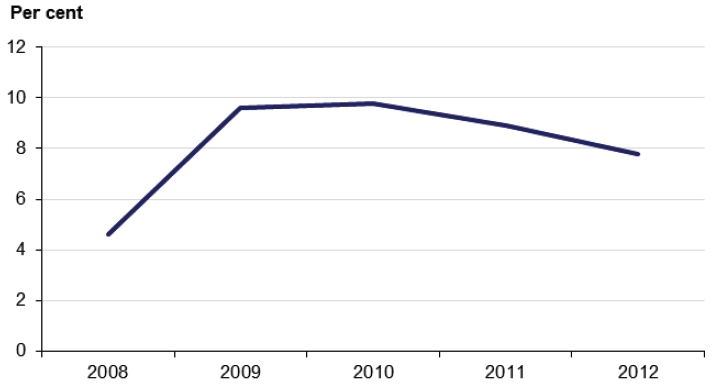
Source: Victorian Auditor-General's Office.
Seven universities generated an operating surplus in 2012 (eight in 2011), with Victoria University assessed as medium risk for the first time in the past five years. Its 2012 operating deficit was modest, although it has generated surpluses previously. The remaining universities were assessed as low risk, having generated surpluses in each of the past four years.
8.3.2 Liquidity
Figure 8D shows that the results of risk assessments of liquidity have been consistent over the past three years.
Figure 8D
Liquidity risk assessment
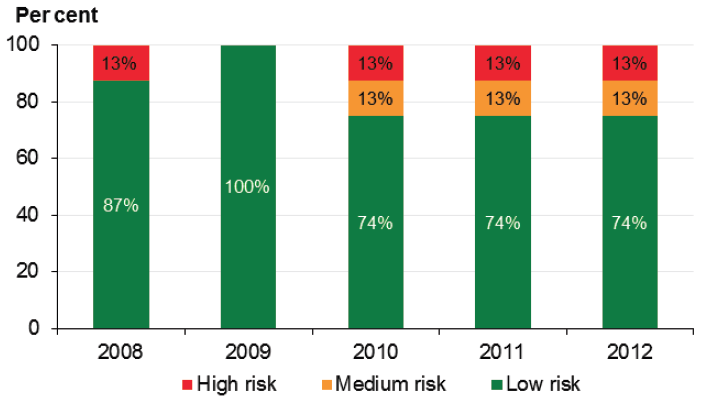
Source: Victorian Auditor-General’s Office.
Six universities were assessed as having a low liquidity risk for the five years. Monash University and RMIT University recorded slightly improved results in 2012, however, remain high and medium risk, respectively. Monash University had available for sale financial assets, which are accessible if required.
8.3.3 Debt-to-equity
Figure 8E shows that universities have maintained low levels of debt over the five years.
Figure 8E
Average debt-to-equity indicator
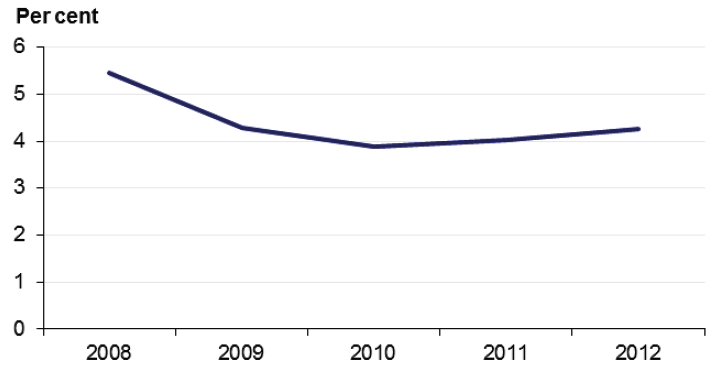
Source: Victorian Auditor-General’s Office.
All universities were assessed as low risk, indicating that they can comfortably meet their debt repayment obligations.
8.3.4 Self-financing
Figure 8F shows that the self-financing risk of the majority of universities has been assessed as medium over the past five years.
Figure 8F
Self-financing risk assessment
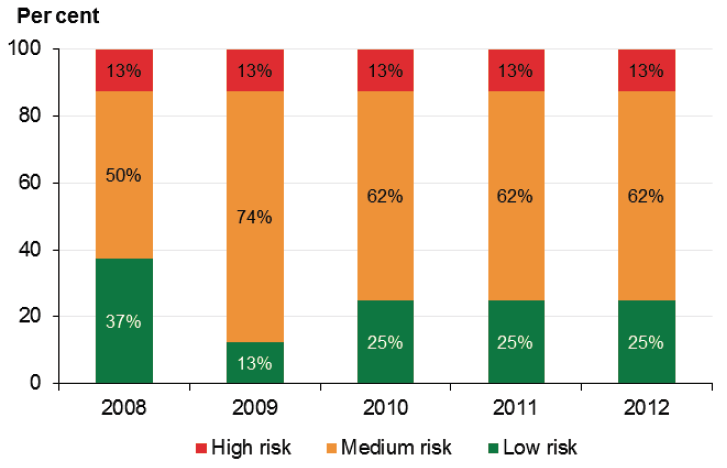
Source: Victorian Auditor-General’s Office.
University self-financing risk assessments have not changed significantly during the past five years, and have been stable over the past three. Six of the eight universities (75 per cent) were assessed as having a self-financing risk of high or medium in 2012, meaning that they are unable to fund asset replacement from cash generated from their operations.
Capital grants received from government increased by $29.6 million or 17.6 per cent in 2012. If these trends continue, universities may place greater reliance on government funding for asset renewal and replacement.
8.3.5 Capital replacement
Figure 8G shows that seven universities were assessed as having a low capital replacement risk in 2012.
Figure 8G
Capital replacement risk assessment – universities
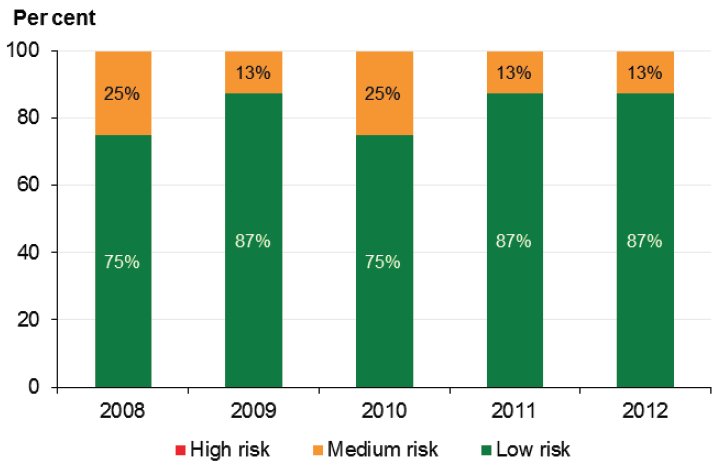
Source: Victorian Auditor-General’s Office.
Capital spending has exceeded the aggregate depreciation expense over the five-year period. This suggests that asset-related expenditure is outstripping asset consumption.
Total expenditure on university capital programs in 2012 increased by $123.5 million or 13.2 per cent, while depreciation increased by $46.3 million or 10.9 per cent. The majority of this expenditure related to new asset construction, however, with the true level of spending on asset renewal substantially less than indicated.
Although Swinburne University of Technology was assessed as medium risk in 2012, capital expenditure still exceeded depreciation. This was the first year since 2007 that the university was not assessed as low risk.
9 Internal controls – Universities
At a glance
Background
This chapter presents the results of our assessment of general internal controls and controls over internal audit and credit cards.
Conclusion
Internal controls were adequate for producing reliable, materially accurate and timely financial reports.
Nevertheless, a number of areas for improvement were identified.
Findings
- All universities had well-developed internal audit functions, however, four did not have arrangements for reporting on conflicts of interest of internal auditors.
- Three of the eight universities had not assessed themselves as being compliant with the requirements of the Payment Card Industry-Data Security Standard, potentially exposing student credit card information to risks of identity theft or fraud.
Recommendations
That universities:
- obtain regular internal audit assurance over key business areas
- obtain annual certification of compliance with agreements from cardholders
- identify risks associated with using credit cards for purchasing, and mitigation strategies
- develop policies for revenue paid by credit or debit cards and achieve compliance with the Payment Card Industry-Data Security Standard, and actively manage the associated risks in order to protect the security of payers' personal information.
9.1 Introduction
Effective internal controls help entities reliably and cost-effectively meet their objectives. Reliable internal controls are a prerequisite for the delivery of reliable, accurate and timely external and internal financial reports.
The enabling legislation for each of the eight universities requires management to implement effective internal control structures.
In this chapter we report on aspects of internal controls in the state's eight universities including:
- general internal controls
- internal audit
- credit card management.
9.2 General internal controls
Each of Victoria's eight universities had adequate internal controls to produce reliable internal and external financial reports. We identified a number of control weaknesses during the course of our 2012 audits, and reported these to management and governing bodies.
Commonly identified areas that required attention were:
- information technology (IT) and security
- independent review of key accounting functions.
9.2.1 Information technology controls and security
Information technology controls protect computer applications, infrastructure and information assets from a wide range of security and access threats. They help to minimise business risk, reduce the risk of fraud and error, and help meet business objectives. IT security can be physical, including restricting access to buildings and equipment, and at the application level, such as password restrictions and data encryption.
Information held by universities about employees, customers and suppliers, and the financial and operational aspects of the business can be highly sensitive. It needs to be protected from unauthorised access, theft or manipulation.
We identified a number of instances where IT controls and physical security could be improved, including:
- physical access to employee personal information
- unauthorised access to payroll database
- physical access to finance and cash management areas
- maintenance of old system user accounts.
9.2.2 Independent review of key accounting functions
Review of key accounting functions, including data entry and account reconciliations, is an important component of effective internal controls. The independent review can minimise input errors, mitigate the risk of fraud and provide assurance that processes are being completed correctly.
There were a number of instances where review of key accounting functions was either non-existent or poor. In particular, weaknesses identified related to the maintenance of vendor masterfiles, payroll processing and preparation of clearing account reconciliations.
9.2.3 Status of prior year issues
Internal control weaknesses reported to management, the governing body and/or audit committee should be actioned and resolved in a timely manner. Twelve of the 26 internal control weaknesses identified and reported to management at three universities in 2011 or earlier were not resolved by management at the time of the 2012 audits.
Management at the three universities had undertaken corrective action on a number of these matters. However failure to resolve previously identified and reported internal control weaknesses reflects poorly on management and the governing body of these universities. It suggests that they are not effectively managing the risk of error within the financial report.
9.3 Internal audit
An effective internal audit function strengthens internal controls, adding credibility to both the financial and non-financial information produced, as well as improving the efficiency of key controls and processes.
9.3.1 Internal audit framework
The key elements of an effective internal audit function are detailed in Figure 6A of this report. The elements were considered in our assessment of the internal audit function in each of the eight universities.
Conclusion
The internal audit frameworks of all universities were generally sound, with governance arrangements and internal audit plans reflecting a majority of the better practice elements.
9.3.2 Policies
Each of the eight universities had an internal audit policy or charter. They contained the majority of better practice elements outlined in the framework.
Across the sector the following better practice elements were consistently addressed:
- details of roles and responsibilities
- clear reporting lines to management and audit committee
- need for operational independence.
However, the following better practice elements were not addressed by a number of universities:
- arrangements for reporting of conflicts of interest of internal auditors
- requirements for periodic review of the internal audit charter.
Four universities had no arrangements for reporting on conflicts of interest of internal auditors. This can compromise the integrity of the internal audit function.
Review of internal audit charter
Four of the eight universities had not reviewed their internal audit charters within the past three years. Of these four, the policies of three did not require periodic review.
Internal audit policies should be periodically reviewed by the audit committee to maintain alignment with the university's risk register and to reflect the better practice framework.
9.3.3 Management practices
Management at each university had developed an internal audit program outlining its scheduled internal audit coverage, and regularly reported to the audit committee on the status of recommendation implementation.
Audit program
All internal audit programs were aligned with, and addressed, key risks within risk registers.
Programs generally covered three years and included sufficient detail of the intended work. Improvements could be made to expected costs and time frames for completion of activities, which were not addressed in the internal audit programs of two universities.
Approval by audit committee
Audit committees at all eight universities had signed off their respective internal audit program.
9.3.4 Governance and oversight
Audit committee
All audit committees regularly reviewed internal audit reports. They maintained issues registers populated with internal audit findings, and regularly followed up on the status of recommended corrective action. Management responses to internal audit reports were provided to audit committees at most universities.
However the quality of information provided to the audit committees could be improved. Details of a number of key operational aspects of internal audit were not presented regularly, at a significant number of universities:
- variations in planned cost—not provided in 63 per cent of cases
- scope of planned internal audits—not provided in 25 per cent of cases
- changes to the internal audit program—not provided in 25 per cent of cases.
Failure to report on these areas can result in time and budget overruns, reduced transparency to the committee and expectation gaps.
The application of such information by audit committees to the scrutiny of future audits would improve the ability to develop accurate, effective and comprehensive internal audit plans.
9.3.5 Comprehensiveness of internal audit program
We identified seven key business activities common to the eight universities, and assessed whether they had been subjected to internal audit scrutiny over the past three years.
Six universities achieved coverage over at least six of these activities. The remaining two had only reviewed four or five of the seven activities, indicating that further attention by internal audit is required.
Figure 9A highlights the common key business areas, and the percentage of universities that had addressed them through internal audits.
Figure 9A
Review of internal audit coverage in universities
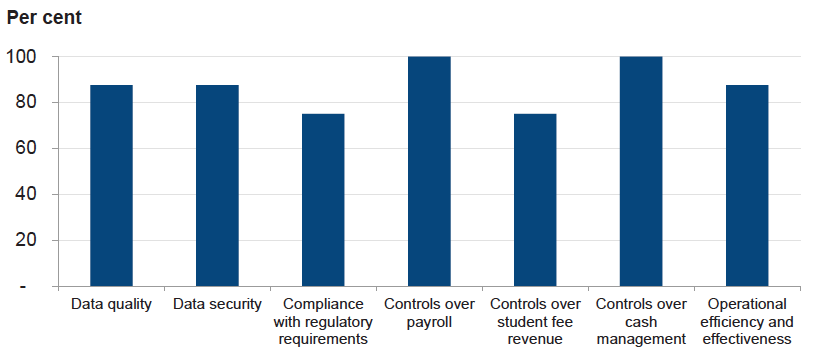
Source: Victorian Auditor-General’s Office.
All universities had reviewed payroll and cash management during the past three years. Areas that were less commonly reviewed included controls over student fee revenue and compliance with regulatory requirements.
Student fee revenue comprises a significant portion of a university's self-generated income, and involves a high number of transactions. The loss of sensitive data and failure to comply with regulatory requirements can expose a university to reputational risk and financial penalties.
9.4 Purchasing by credit card
9.4.1 Use of credit cards
Each university had on average 990 credit cards in use in 2012. This was due to large and often multiple campuses, and independent faculties or schools within each. Credit cards facilitate decentralised processing and procurement arrangements, but also present risks to the sector. The overall spend using credit cards was projected to be $127.3 million, or 6.2 per cent of operating expenditure in 2012.
Figure 9B highlights the increase in both card numbers and spending on them in 2011 and 2012.
Figure 9B
Credit cards and expenditure incurred
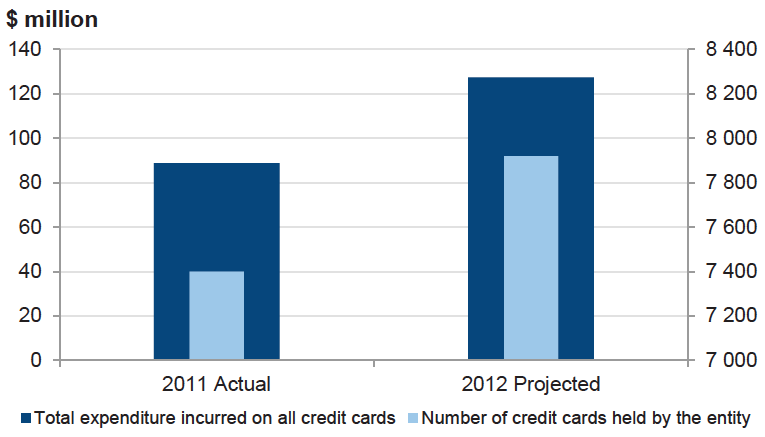
Note: Projected figures were obtained during the course of the 2012 audits.
Source: Victorian Auditor-General’s Office.
The number of credit cards at universities increased by 7.0 per cent in 2012, as some universities streamlined their purchasing processes and pushed procurement responsibilities out to individual faculties or schools.
9.4.2 Credit card management framework
The key elements of an effective credit card management framework are set out in Figure 6D of this report.
These elements were considered in our assessment of credit card management in each of the eight universities.
Conclusion
Credit card management frameworks were generally underpinned by comprehensive policies and sound controls. There is room for improvement in training for new cardholders and governance arrangements.
9.4.3 Policies
Existence of credit card policies
Seven of the eight universities had a policy on the use of credit cards. The remaining university had addressed some aspects of the better practice framework in its standard procurement policy and was drafting a credit card-specific policy.
Across the sector we noted that the following better practice elements were generally addressed:
- financial delegations
- scope and conditions for use
- application process
- approval process
- compliance monitoring arrangements.
The following elements were not incorporated into credit card policies at a number of universities:
- training requirements for new cardholders
- eligibility criteria for having a credit card.
Without identified eligibility criteria, credit cards may be issued without appropriate consideration of risk, increasing the opportunity for misuse or fraud. Training is an important component of an effective framework, as it familiarises all cardholders with the associated expectations and responsibilities.
9.4.4 Management practices
Certification and monitoring
All universities required cardholders to sign agreements at the time a card was issued, acknowledging the conditions of use. However, seven did not obtain annual certification from cardholders to confirm their compliance with the conditions of use.
Card use was reviewed monthly by all universities. Transaction approval was monitored at the data input level, with financial purchase limits reviewed annually. There were also strong controls around credit card account settlements.
Instances of misuse or noncompliance with the credit card policy were followed up by management, with the information reported to the audit committee or board at 75 per cent of universities.
Policy breaches were detected at four universities during 2012, and the matters were addressed and dealt with by management.
Control environment
There were strong controls associated with credit card use at each university, with the following areas commonly addressed:
- retention of documentation relating to transactions
- recording, approval and reconciliation of transactions in a timely manner
- regular reporting to executive
- restricting cardholder access to the payments system
- independent review of credit card account settlements.
Segregation of duties is important in credit card processing and acquittal, as it reduces the risk of error or fraud. At three universities some cardholders had access to the accounts payable system. However, in each instance, the risk was mitigated by additional monitoring controls.
9.4.5 Governance and oversight
Chief financial officers generally received reports on credit card usage and policy compliance, with matters of significance reported to the audit committee.
Risk assessment
Three universities had not addressed risks associated with credit card use in the risk register, indicating that they did not assign appropriate importance to this high-risk activity.
Use of internal audit
Six universities had engaged their internal auditors to review their credit card arrangements during the past three years. Of the remaining two, only one planned to review credit card use through their internal audit program. Given the prevalence of card use throughout the sector, all universities should have their arrangements subject to internal audit review periodically.
9.4.6 Testing of controls over credit card use
As part of our assessment of management and use of credit cards we sampled credit cards transactions at each of the eight universities and tested a selection of key internal controls.
The results are summarised in Figure 9C.
Figure 9C
Results of credit card controls testing
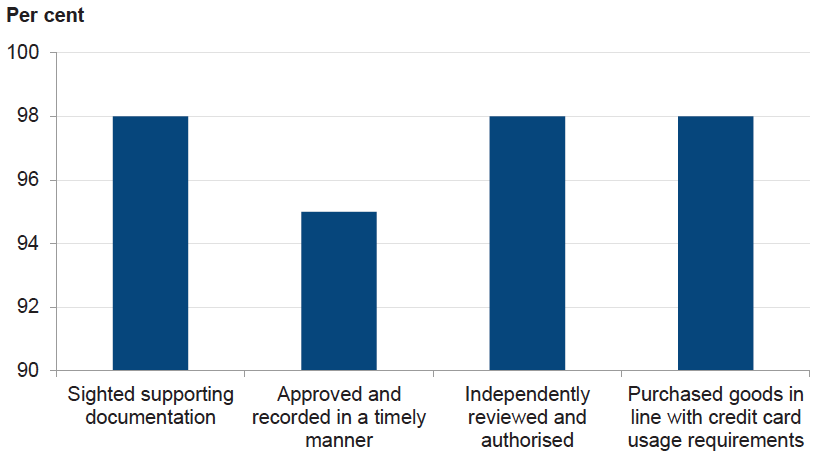
Source: Victorian Auditor-General’s Office.
The tested controls were operational and effective across the sector and there was a high level of compliance. A cardholder agreement had been signed and appropriately filed for each credit card we reviewed. Each control test recorded a positive result of at least 95 per cent, but there was opportunity for improvement as no test resulted in a 100 per cent result.
9.5 Fee payment by credit card
Students have a range of options for paying their tuition fees, including payment by cash, cheque, Bpay, credit card and debit card. Students can make payments using their credit/debit cards at all universities.
Figure 9D shows the payment options currently used by students to pay fees. However, as one university was unable to provide a breakdown of its receipting methods, the data relate to the seven universities for which data was available.
Figure 9D
Payment options used to pay fees, 2012
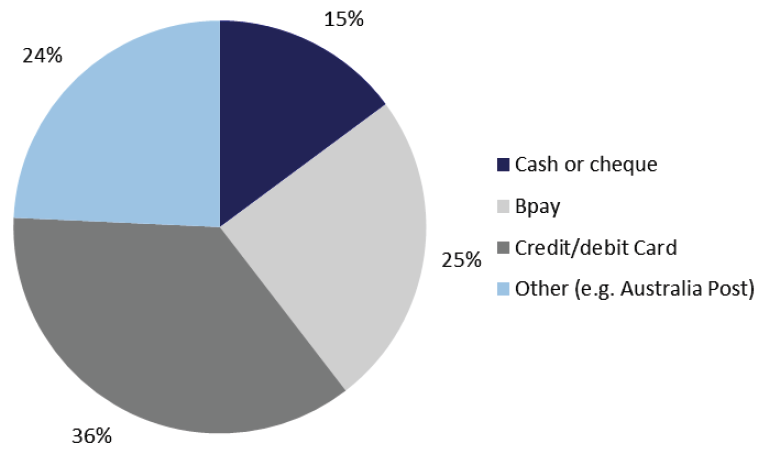
Source: Victorian Auditor-General’s Office.
The analysis shows that credit and debit card payments were the preferred method for payment in 2012. Payments through Bpay or other facilities can also involve credit or debit cards.
9.5.1 Compliance with the Payment Card Industry-Data Security Standard
The Payment Card Industry-Data Security Standard (PCI-DSS) is an industry‑developed standard that addresses the storage and handling of customer credit and debit card information and data. All universities should conduct a self‑assessment of compliance with the standard regularly.
Only five of the eight universities had determined that they were compliant with the requirements of the PCI-DSS. Two of the remaining three had developed strategies to achieve compliance, and were progressing toward a positive assessment.
The remaining university had not assessed whether it was PCI-DSS compliant, however, it had undertaken its own internal information and card security assessments. Nevertheless, it should assess its practices against the PCI-DSS.
Six of the eight universities did not have a policy relating to handling customer credit card/debit card information, and only five of the eight had assessed the associated risks. The results are concerning as they show a lack of understanding of the importance of this high-risk activity.
Poor security controls and noncompliance with PCI-DSS increase the risk of identity theft and fraud, and expose an entity to a loss of reputational risk and financial penalties. Early action is needed by universities to develop policies for credit card revenue, achieve compliance with the PCI-DSS and actively manage the associated risks.
Recommendations
That universities:
- obtain regular internal audit assurance over key business areas
- obtain annual certification of compliance with agreements from cardholders
- identify risks associated with using credit cards for purchasing, and mitigation strategies
- develop policies for revenue paid by credit or debit cards and achieve compliance with the Payment Card Industry-Data Security Standard, and actively manage the associated risks in order to protect the security of payers' personal information.
10 Part E: Alpine resorts
10. Financial results – Alpine resorts
At a glance
Background
Accrual-based financial statements enable an assessment of whether entities are generating sufficient surpluses from operations to maintain services, fund asset maintenance and retire debt.
This chapter analyses the financial results of the five Alpine Resort Management Boards for the year ended 31 October 2012.
Findings
- Alpine resorts collectively recorded an operating deficit of $1.7 million in 2011–12 ($5.2 million surplus in 2010–11).
- Mt Buller and Mt Stirling, Mt Hotham and Falls Creek all generated surpluses for 2011–12.
- Mt Baw Baw and Lake Mountain recorded deficits of $2.4 million and $0.6 million respectively. The deficits would have been greater had they not received government support to meet their operating cash shortfalls.
- Mt Baw Baw and Lake Mountain do not generate sufficient revenue to meet their short-term expenditure commitments. They rely on letters of support from the Department of Environment and Primary Industries to continue to meet debts as they fall due.
Recommendations
- That Lake Mountain and Mt Baw Baw Alpine Resort Management Boards should continue to develop strategies to attract greater visitor numbers
- That Mt Baw Baw Alpine Resort Management Board should identify the reasons leading to shorter length of stay by visitors and develop strategies to address this.
10.1 Introduction
Accrual-based financial statements enable an assessment of whether alpine resorts are generating sufficient surpluses from operations to maintain services, fund asset maintenance and retire debt.
An entity's financial performance is measured by its net operating result—the difference between its revenues and expenses. An entity's financial position is generally measured by reference to its net assets—the difference between its total assets and total liabilities.
10.2 Financial results
Victoria's alpine resorts located at Mt Buller, Mt Stirling, Falls Creek, Mt Hotham, Mt Baw Baw and Lake Mountain are almost entirely dependent on the winter season and the level of snowfalls to deliver surpluses and to sustain their operations.
10.2.1 Financial performance
Collectively, the alpine resorts delivered a deficit of $1.7 million for 2011–12, a decrease from a surplus of $5.2 million in 2010–11.
Three of the five alpine resort management boards (ARMB)—Mt Buller and Mt Stirling, Mt Hotham and Falls Creek—recorded modest operating surpluses in 2011–12. All five recorded operating surpluses in 2010–11.
Mt Baw Baw and Lake Mountain recorded deficits of $2.4 million and $0.6 million respectively in 2011–12. The deficits would have been greater if the two entities had not received government support to address their operating cash shortfalls.
Figure 10A shows the total operating results for ARMBs for 2010–11 and 2011–12. It also shows that had government support funding, insurance recoveries and bushfire relief not been received, the results would have been deficits in both years.
Figure 10A
Alpine resort sector operating result, 2010–11 to 2011–12
|
2010–11 |
2011–12 |
Movement |
||
|---|---|---|---|---|
|
$'000 |
$'000 |
$'000 |
(%) |
|
|
Operating result |
5 162 |
(1 688) |
(6 850) |
(132.7) |
|
less Government support payments |
8 164 |
3 168 |
(4 996) |
(61.2) |
|
less Insurance and bushfire recoveries |
1 912 |
0 |
(1 912) |
(100.0) |
|
Operating result excluding additional revenue |
(4 914) |
(4 856) |
58 |
1.2 |
Source: Victorian Auditor-General’s Office.
Revenue
During 2011–12 ARMBs generated revenue of $43.8 million, a decrease of $3.0 million (6.4 per cent) from the $46.8 million for 2010–11.
Revenue from government grants in 2011–12, including support funding, was 52.7 per cent or $5.7 million less than in 2010–11. However, government grants received in 2010–11 were higher than the norm as they included $3.2 million of 2011‑12 grants received in advance by Lake Mountain and Mt Baw Baw.
Figure 10B shows that the composition of operating revenue has varied over the past five years. However, site and service fees charged to on-site private operators, such as cafes and lodging, remain the highest revenue component.
Figure 10B
Revenue composition
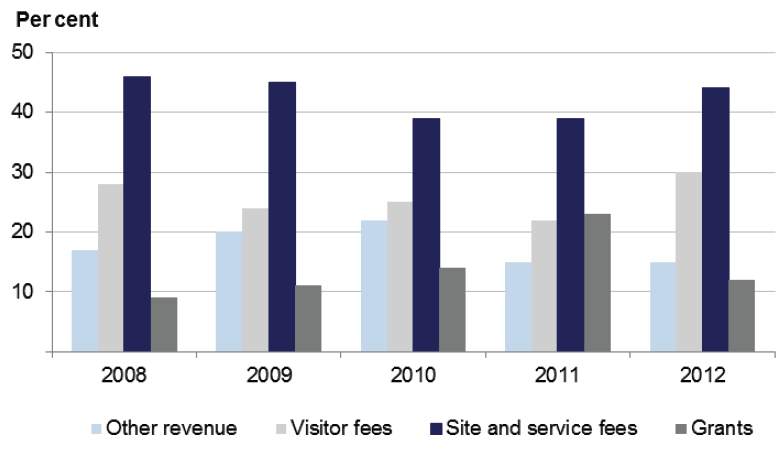
Source: Victorian Auditor-General’s Office.
Visitor fees increased by $2.8 million in 2011–12 due to the longer snow season.
Expenditure
In 2011–12, total operating expenditure of the five ARMBs increased by 9.4 per cent or $3.9 million to $45.5 million, predominantly due to:
- an increase of 7.9 per cent or $1.2 million in employee benefits due in part to the longer snow season
- an increase of 28 per cent or $1.5 million in depreciation following the upward revaluation of assets during 2011.
Figure 10C shows that the composition of operating expenditure has remained relatively consistent over the past five years.
Figure 10C
Expenditure composition
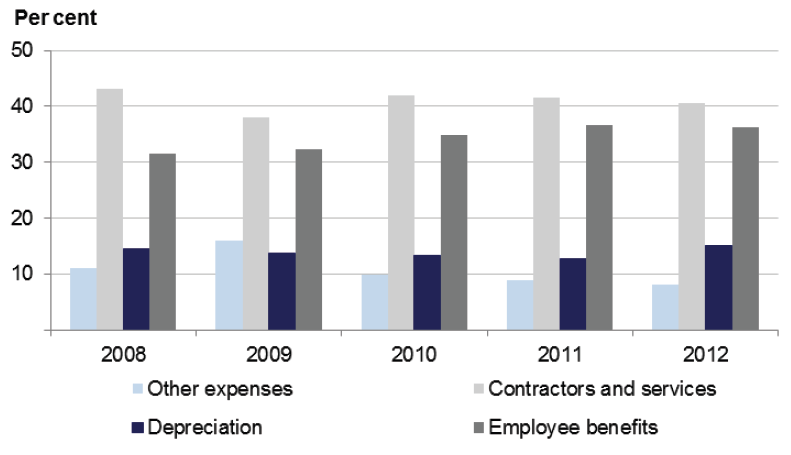
Source: Victorian Auditor-General’s Office.
10.2.2 Further analysis of financial performance
When analysing the financial performance of the ARMBs, it is important to consider their capacity to meet their short-term operating expenditure commitments with revenue from operating activities. As part of our analysis of the challenges facing the sector, we analysed the cost incurred by each ARMB per visitor day, the length of stay of those visitors, and the capacity of the entities to meet their operating expenditure commitments.
Cost per winter day
Figure 10D shows the expense incurred by each ARMB for each visitor day for the winter season, for the five years to 2012.
The analysis compares total expenses incurred by these ARMBs for the full year against winter visitor days. While some ARMBs have some revenue-generating activities during the green season, the associated expenditure is negligible in the context of winter operations. The inclusion of full-year data would not materially distort the analysis.
Figure 10D
Cost per winter visitor day
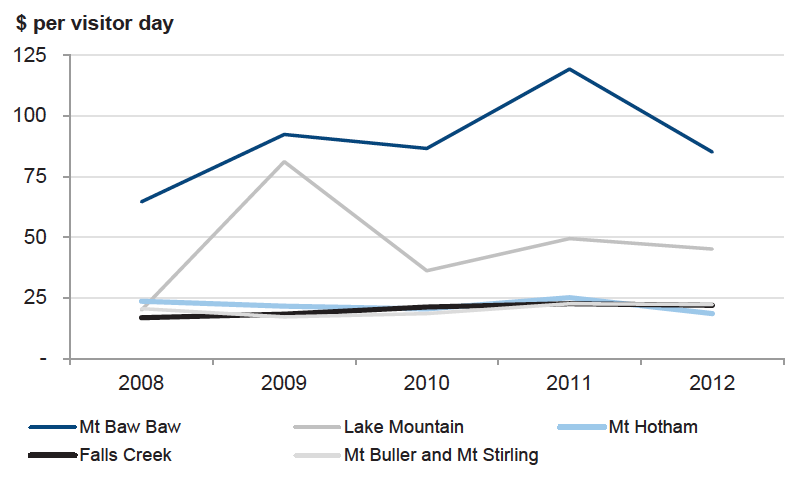
Source: Alpine Resort Co-ordinating Council visitor data and Victorian Auditor-General's Office.
Mt Buller and Mt Stirling, Mt Hotham and Falls Creek incurred an expense per winter visitor day of around $20 for each winter period between 2008 and 2012. However, Mt Baw Baw and Lake Mountain incurred significantly greater expense per winter visitor day than the larger resorts. Notably:
- Mt Baw Baw incurred around $85 per winter visitor day in 2011–12.The resort operates ski lifts and provides accommodation, food and beverage services— activities that are mainly delivered by private operators at the larger resorts. This contributes to the relatively higher costs incurred by Mt Baw Baw.
- Lake Mountain incurred costs of around $48 per winter visitor day. This is largely due to its limited capacity for additional revenue generating activities, as it has no overnight accommodation facilities.
Visitor numbers and length of stay
Figure 10E highlights the total visitor days recorded, and the average length of stay for the four resorts with accommodation over the five-year period.
Figure 10E
Total visitor days compared to average stay
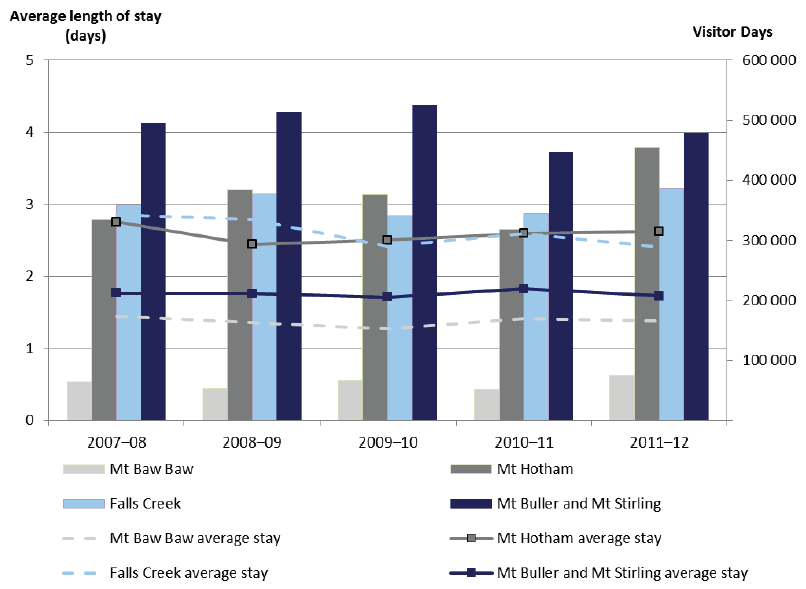
Source: Victorian Auditor-General’s Office.
It shows that Mt Buller and Mt Stirling has continued to attract the largest number of visitor days throughout the five-year period. However in in 2011–12, Mt Hotham and Falls Creek showed marked increases. Mt Baw Baw recorded less than 35 per cent of the number of visitors of the larger resorts over the five-year period. In addition to a shorter length of stay on average, Mt Baw Baw reported the lowest number of visitor days. This is not surprising given its smaller size, although the number of visitors to Mt Baw Baw has increased by 22 per cent since 2008.
While not displayed in the data in Figure 10E, Lake Mountain also recorded fewer visitor days over the five-year period. Visitor days increased to over 105 000 in 2012, with a five‑year average of 100 000 visitor days. These were impacted by the 2009 bushfires and reflect the lack of accommodation options at Lake Mountain.
In the past three years, visitors to Mt Hotham have stayed longer than visitors to any of the other three resorts, closely followed by Falls Creek, and then Mt Buller and Mt Stirling.
Figure 10E shows that the average length of stay at Mt Baw Baw is significantly shorter than that of the other three resorts. However, it is of concern that despite its lower visitor numbers and their shorter length of stay, Mt Baw Baw's expenditure excluding depreciation in 2011–12 was $6.4 million or 75 per cent of the expenditure incurred by the larger ARMBs ($6.2 million in 2010–11). This is mainly due to the resort incurring additional expenditure associated with the operation of ski lifts and the provision of accommodation, food and beverage services. Notwithstanding these additional costs, the disparity in results warrants further scrutiny by Mt Baw Baw ARMB and the Alpine Resorts Co-ordinating Council.
Capacity to meet short-term operating expenditure commitments from revenue from operating activities
In undertaking an analysis of the ability of the ARMBs to meet short-term operating expenditure commitments from revenue from operating activities we recognised that:
- Mt Baw Baw and Lake Mountain, the two smaller ARMBs, receive significant government support funding which effectively enables them to continue to operate
- depreciation is a 'non-cash' adjustment representing the consumption of assets over a long period of time—it is not indicative of the capacity of an entity to meet its short- to medium-term operating commitments from its operations.
Figure 10F sets out the operating results of each of the five ARMBs for 2011–12 and the operating result excluding government support funding and depreciation. The cash operating surplus shows whether each ARMB has the capacity to meet its short-term operating expenditure commitments from its revenue from operating activities. This consideration is important in assessing the underlying health of an entity's operations.
Figure 10F
Cash operating surplus, 2011–12
|
Mt Baw Baw |
Lake Mountain |
Falls Creek |
Mt Hotham |
Mt Buller and Mt Stirling |
Total |
|
|---|---|---|---|---|---|---|
|
$'000 |
$'000 |
$'000 |
$'000 |
$'000 |
$'000 |
|
|
Operating result |
(2 357) |
(611) |
745 |
455 |
81 |
(1 687) |
|
Less government support funding |
(1 370) |
(1 798) |
0 |
0 |
0 |
(3 168) |
|
Add depreciation |
1 124 |
1 308 |
1 545 |
1 355 |
1 502 |
6 834 |
|
Cash operating surplus |
(2 603) |
(1 101) |
2 290 |
1 810 |
1 583 |
1 979 |
Source: Victorian Auditor-General’s Office.
The data show that Falls Creek, Mt Hotham, and Mt Buller and Mt Stirling generated sufficient revenue to meet their short-term operating expenditure commitments in 2011‑12, enabling them to fund asset replacement or upgrades, or repay debt. However, Mt Baw Baw and Lake Mountain did not generate sufficient revenue to meet their short-term expenditure commitments. Their cash shortfalls were $2.6 million and $1.1 million respectively.
Figure 10G shows the capacity of the five ARMBs to meet their short-term operating expenditure commitments over the past five years.
Figure 10G
Five-year trend of cash operating surpluses
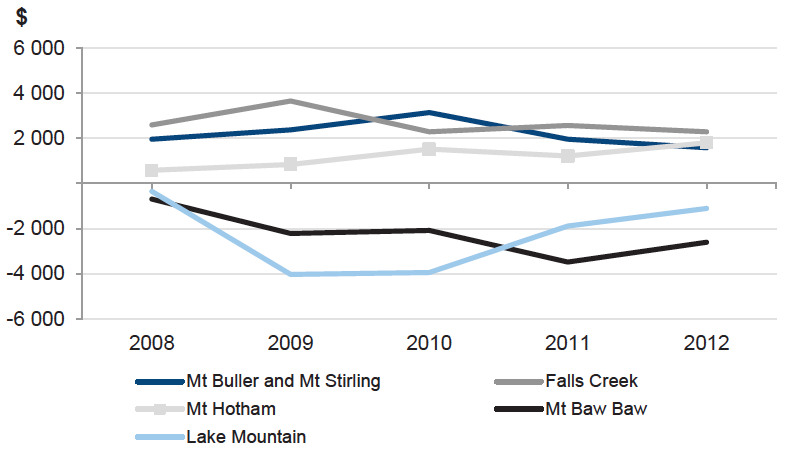
Source: Victorian Auditor-General’s Office.
It shows that neither Mt Baw Baw nor Lake Mountain has generated a cash surplus from operating activities during the five-year period. It also shows that Lake Mountain's results have improved since replacing its destroyed building assets after the 2009 bushfires.
The remaining three ARMBs have consistently generated cash operating surpluses over the five years, and generate sufficient cash to fund asset replacement and repay debt.
The 2003 Alpine Resorts Reform package required all ARMBs to establish:
- a snow drought reserve to maintain cash flow during poor snow seasons
- a capital improvement fund to finance asset maintenance and replacement.
All ARMBs subsequently established these funds, with Mt Baw Baw and Lake Mountain being the last to do so in 2007.
Over a number of years the operating shortfalls of Mt Baw Baw and Lake Mountain were partially funded by their cash reserves and by ongoing support from government. As at 31 October 2012 the reserves of these two ARMBs had been depleted.
10.3 Financial position
The financial objective for ARMBs should be to generate sufficient surpluses from operations to meet their financial obligations, and to fund asset replacement and acquire new assets. However, their revenue is generally not tied to the value of their asset base as they cannot obtain funds by selling them. The ability of ARMBs to achieve surpluses and be sustainable therefore depends largely on the funding policies established by the Department of Environment and Primary Industries (formerly Department of Sustainability and Environment) and how well the ARMBs manage their operations.
The objective of an ARMB should therefore be to maintain the condition of its infrastructure, while managing levels of debt.
10.3.1 Assets
During 2011–12 the total assets of ARMBs decreased by $6.1 million to $388.5 million (decrease of $30.6 million in 2010–11).
Figure 10H shows the shift in composition of property, plant and equipment values over the past five years.
Figure 10H
Property, plant and equipment composition
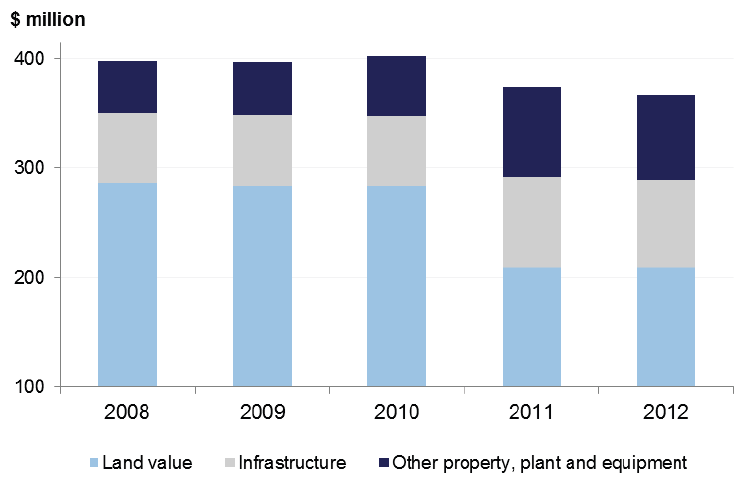
Source: Victorian Auditor-General’s Office.
Independent valuations in 2010–11 caused movements in these asset categories. Valuations were not required to be completed in 2011–12, and asset composition remained similar to the prior year.
Property, plant and equipment continues to make up more than 95 per cent of the total asset base of ARMBs.
10.3.2 Liabilities
Liabilities decreased by $0.2 million or 1.4 per cent, to $11.9 million during 2011–12, notwithstanding a $0.8 million or 17.4 per cent decrease in interest bearing liabilities. Four ARMBs had outstanding loans which were partly repaid during the year. Lake Mountain reported the highest level of repayments at $0.5 million or 40.1 per cent of the total loan balance.
Liabilities primarily consist of payables—employee benefits provisions and interest bearing liabilities making up 38 per cent, 22 per cent and 20 per cent respectively.
Recommendations
- That Lake Mountain and Mt Baw Baw Alpine Resort Management Boards should continue to develop strategies to attract greater visitor numbers.
- That Mt Baw Baw Alpine Resort Management Board should identify the reasons leading to shorter length of stay by visitors and develop strategies to address this.
11 Financial sustainability – Alpine resorts
At a glance
Background
To be financially sustainable, entities need to be able to meet current and future expenditure as it falls due. They also need the ability to absorb foreseeable changes and materialising risks without significantly changing their revenue and expenditure policies.
This chapter assesses the financial sustainability of the five Alpine Resort Management Boards using five indicators over a five-year period.
Findings
- The financial sustainability risk for the alpine resort sector is low.
- The financial sustainability risk for both Mt Baw Baw and Lake Mountain is high, due to poor underlying result indicators.
- These risk assessments illustrate these resorts' limited capacity to continue as a going concern
Recommendation
- The Alpine Resorts Co-ordinating Council together with Lake Mountain and Mt Baw Baw Alpine Resort Management Boards should implement revised operating arrangements to improve their financial viability.
11.1 Introduction
To be financially sustainable, entities need the capacity to meet their current and future expenditure as it falls due. They must also be able to absorb foreseeable changes and financial risks as they materialise.
In this chapter we provide insight into the financial sustainability of the five Alpine Resort Management Boards (ARMB) through analysing the trends in each of five financial sustainability indicators over a five-year period. The five indicators analysed are:
- underlying result
- liquidity
- debt-to-equity
- self-financing
- capital replacement.
Appendix D describes the sustainability indicators and risk-assessment criteria used in this report.
To form a definitive view of any entity’s financial sustainability, a holistic analysis that moves beyond financial indicators would be required, including an assessment of the entity’s operations and the regulatory environment in which the entity operates. These additional considerations are not examined in this report.
11.2 Financial sustainability
11.2.1 Overall assessment
The sector’s overall financial sustainability risk is assessed as low. However, the financial sustainability risk for both Lake Mountain and Mt Baw Baw is high.
Figure 11A summarises our financial sustainability risk assessment results for the past two years.
Figure 11A
Two-year financial sustainability risk assessment
|
Entity |
2011–12 |
2010–11 |
|---|---|---|
|
Mt Baw Baw |
High |
Medium |
|
Lake Mountain |
High |
High |
|
Falls Creek |
Low |
Low |
|
Mt Hotham |
Medium |
Low |
|
Mt Buller and Mt Stirling |
Low |
Low |
|
Total |
5 |
5 |
Source: Victorian Auditor-General’s Office.
The data show that the financial sustainability risk for Mt Baw Baw and Mt Hotham increased in 2012, and the risk for Lake Mountain stayed high.
Mt Hotham was assessed as having medium financial sustainability risk in 2011–12 as a result of its poor capital replacement indicator.
Figure 11B shows that the five-year sustainability assessment for ARMBs since 2007–08 has deteriorated. In 2011–12 two ARMBs were assessed as having a high sustainability risk compared to one in 2007–08.
Figure 11B
Five-year financial sustainability risk assessment
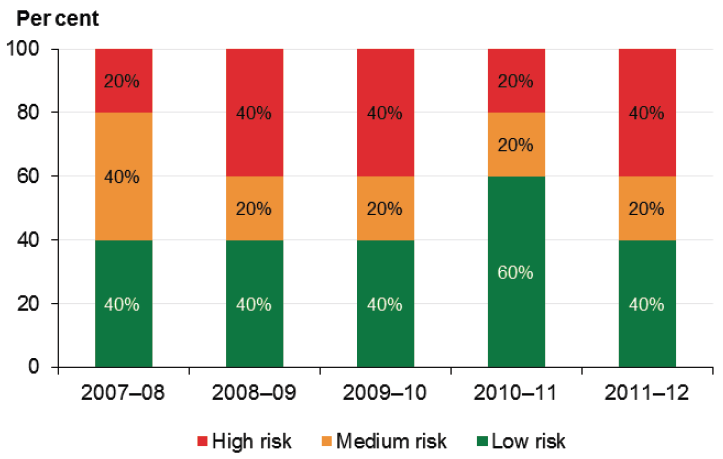
Source: Victorian Auditor-General’s Office.
11.2.2 Summary of trends in risk assessments over the five‑year period
When the risk assessments for each indicator are analysed individually over the five years to 2011–12, they show the following trends:
- underlying result—the number of ARMBs in the high-risk category has doubled
- liquidity—the number of ARMBs in the low-risk category has remained stable, however, one entity has moved into the high-risk category (none in 2007–08)
- debt-to-equity—the number of ARMBs in the low-risk category has remained stable
- self-financing—the number of ARMBs in the high-risk category has decreased from three to one, although three are now in the medium-risk category (none in 2007–08)
- capital replacement—the number of ARMBs in the high-risk category has increased from two to three.
In summary, the trend shows that the overall financial sustainability position of the ARMB sector has deteriorated over the past five years. Poor operating results have led to a decrease in capital investment, and self-financing is becoming a problem for more entities in the sector.
11.2.3 Analysis of trends in sustainability indicators across the five-year period
To further understand the results we analysed the five-year data for the five indicators for each of the ARMBs. The relevant data are reproduced in Appendix D.
Figure 11C shows the mean sustainability risk assessments for the five ARMBs, over the five years from 2007–08 to 2011–12. High-risk results are shown in red, medium risk in orange, and low risk in green.
Figure 11C
Five-year mean financial sustainability risk assessment, 2007–08 to 2011–12
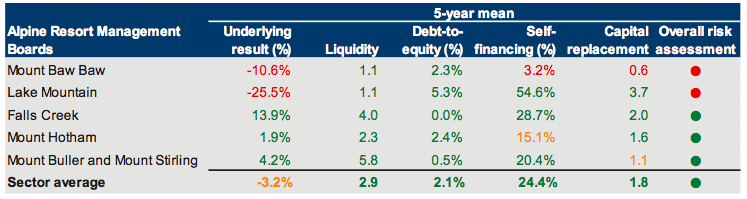
Source: Victorian Auditor-General’s Office.
Over the five years Mt Baw Baw and Lake Mountain have both averaged low liquidity levels and operating deficits. The overall financial sustainability risk assessment for both is high.
The results illustrate the limited capacity of Mt Baw Baw and Lake Mountain to continue as a going concern without operational support funding from government.
Mt Baw Baw
The overall sustainability risk assessment for Mt Baw Baw increased from medium to high in 2011–12. This was mainly due to a 74 per cent reduction in government support funding, due to significant financial support in 2010–11. During the five-year period its expenditure increased by 56.1 per cent, while its revenue grew by 12.5 per cent.
Its assets are depreciating at a greater rate than they are being replaced, as shown by the capital replacement indicator.
Lake Mountain
In 2011–12 Lake Mountain's own-source revenue increased by $1.2 million (66 per cent), essentially due to the longer snow season and improved facilities following rebuilding after the 2009 bushfires. The resort also managed to contain its labour costs, despite the additional labour requirements of the extended snow season.
However, over the five years, Lake Mountain averaged a deficit of 25.5 per cent. Its financial sustainability worsened in 2011–12, mainly due to a deteriorating underlying result caused by reduced government support funding.
11.2.4 Revised funding and operating arrangements
Under the Alpine Resorts (Management) Act 1997 the ARMBs are fully accountable for their financial management and performance. However, the Department of Environment and Primary Industries (DEPI)—formerly Department of Sustainability and Environment—has committed to provide further operational funding to Mt Baw Baw and Lake Mountain. Both ARMBs received a letter of support during 2012, which indicated that DEPI would meet the operational expenditure commitments of the two ARMBs for 2013. The provision of funding support by DEPI blurs the accountability of the individual ARMBs for their financial performance.
Notwithstanding this, as part of a strategy to investigate and assess possible alternative operating models, in late 2012 Lake Mountain ARMB resolved to outsource its operations for 12 months. An external contractor has been appointed to deliver services and products at the resort during 2013. We will review and report on the outcome of this arrangement in future reports.
11.3 Five-year trend analysis
This section provides an analysis and commentary on the trends for each indicator for the past five years. The indicators reflect each entity’s funding and expenditure policies, and identify whether these policies are sustainable.
Financial sustainability should be viewed from both a short- and long-term perspective. The shorter-term indicators—the underlying result and liquidity—focus on an entity’s ability to maintain a positive operating cash flow and adequate cash holdings, and to generate an operating surplus over time.
The longer-term indicators—debt-to-equity, self-financing and capital replacement—identify whether adequate funding is available to repay debt, replace assets to maintain the quality of service delivery, and to meet community expectations and the demand for services.
11.3.1 Underlying result
Two of the five ARMBs recorded an operating deficit in 2011–12, after all five recorded surpluses in the prior year.
Figure 11D
Underlying result risk assessment
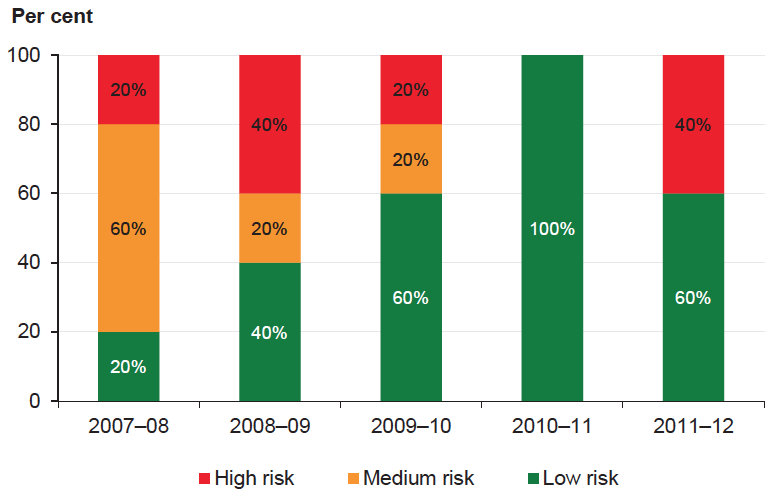
Source: Victorian Auditor-General’s Office.
Under the funding model, both of the smaller ARMBs will continue to operate with minimal cash as DEPI meets their operational expenditure commitments as needed. Should the deficits continue, however, spending on capital required to generate additional income may be deferred or abandoned, and enhance concerns about the long-term viability of Lake Mountain and Mt Baw Baw.
11.3.2 Liquidity
The overall ability of ARMBs to repay short-term liabilities remained stable from 2008‑09 to 2010–11. However, the liquidity assessment for both Lake Mountain and Mt Baw Baw changed during 2011–12 from high to medium risk, and from low to high risk, respectively.
Lake Mountain's liquidity ratio improved slightly in 2011–12, due to the repayment of finance leases held in respect of vehicles.
Figure 11E
Liquidity risk assessment
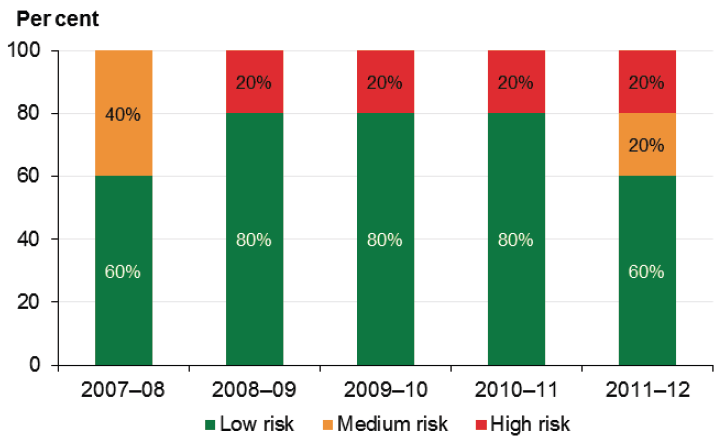
Source: Victorian Auditor-General’s Office.
Lake Mountain and Mt Baw Baw, having depleted their cash reserves as at 31 October 2012, have limited current assets to meet their expenditure and liability commitments, and are reliant on DEPI to do so.
11.3.3 Debt-to-equity
Overall debt for ARMBs decreased by $0.8 million (17.4 per cent) during 2011–12 to $3.8 million. The sector generally has a low level of debt, with all ARMBs in the low-risk category for the debt-to-equity indicator for the past five years.
A low debt-to-equity indicator shows that an entity is able to comfortably meet its repayment obligations from own-source revenues.
As Lake Mountain and Mt Baw Baw rely on support funding from government to meet their expenditure commitments, their ability to repay debt is also dependent on this funding.
Figure 11F shows that the average debt-to-equity indicator for all ARMBs reduced between 2007–08 and 2011–12. The risk remains low for the sector as a whole.
Figure 11F
Average debt-to-equity indicator
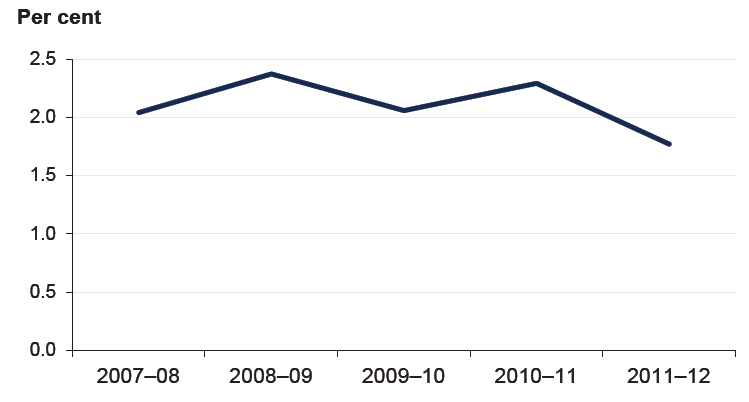
Source: Victorian Auditor-General’s Office.
11.3.4 Self-financing
Mt Baw Baw recorded a high self-financing risk for 2011–12. Only Mt Hotham was assessed as low risk.
Figure 11G
Self-financing risk assessment
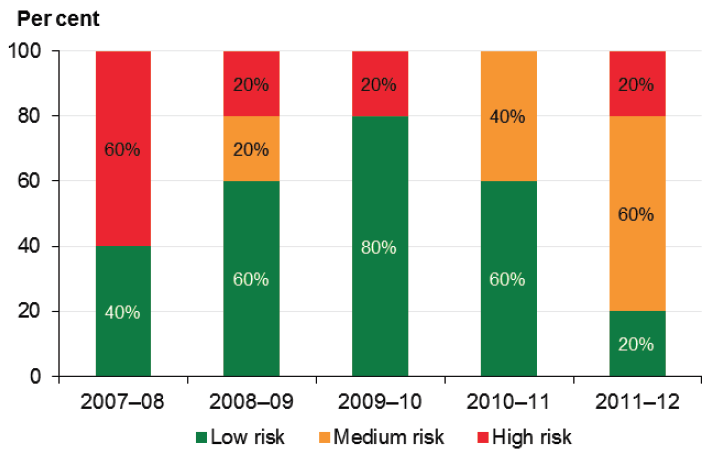
Source: Victorian Auditor-General’s Office.
A low self-financing risk indicates than an entity can replace its assets over the long term using cash generated from its own operations. High risk suggests that an entity's capacity to fund its capital program is limited, and raises long-term financial sustainability issues as assets may not be able to be replaced as required.
The deterioration in this indicator across the sector since 2009–10 suggests action is needed to address the capacity of ARMBs to generate greater revenue.
11.3.5 Capital replacement
Figure 11H shows that the capital replacement risk result for ARMBs deteriorated significantly in 2011–12, with only one ARMB retaining a low-risk rating.
Alpine resort activities and services are capital intensive and heavily reliant on infrastructure to generate revenue. The capital replacement indicator is a long-term measure of a resort’s ability to replace these assets.
Figure 11H
Capital replacement risk assessment
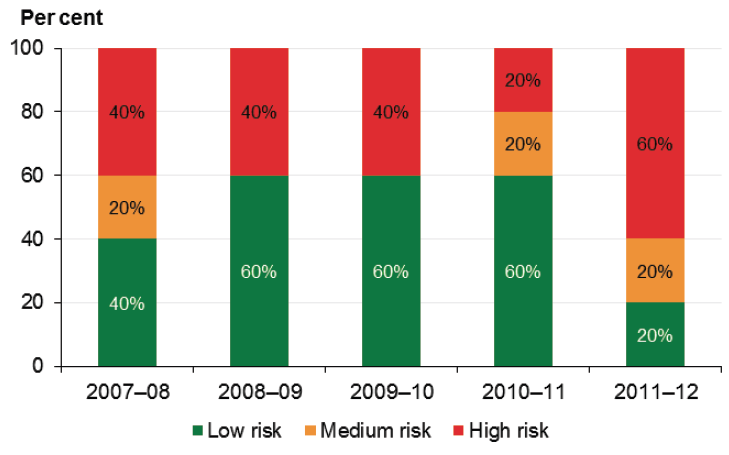
Source: Victorian Auditor-General’s Office.
The 2011–12 assessment reflects the reduction in capital spending across the sector during the year. However, as the indicator is a long-term indicator of an entity's financial sustainability, a low level of capital investment in any particular year is not concerning.
Nevertheless, when considered in light of the poor self-financing indicators, it raises concerns about the sector's ability to generate sufficient cash from operations over the long term, to replace assets as required. This applies particularly to Mt Baw Baw and Lake Mountain.
Caution is required when interpreting these results, as annual spending on assets includes new and expanded facilities, in addition to existing facilities. As a result, the true level of spending on asset renewal is usually less than indicated.
Recommendation
- The Alpine Resorts Co-ordinating Council together with Lake Mountain and Mt Baw Baw Alpine Resort Management Boards should implement revised operating arrangements to improve their financial viability.
Appendix A. Audit status
Tertiary education
Entity |
Audit type |
Financial statements |
Timeliness of financial statements completion |
||||||
|---|---|---|---|---|---|---|---|---|---|
FMA |
Non-FMA |
Clear opinion |
Opinion date |
Up to 12 weeks |
12 to 18 weeks |
More than 18 weeks |
|||
COMPLETED AUDITS – 31 DECEMBER 2012 BALANCE DATE |
|||||||||
UNIVERSITIES |
|||||||||
Deakin University |
Yes |
No |
18-Mar-13 |
Yes |
|||||
Reason for qualification: Grant income recognised as liability rather than as income as required by AASB 1004 Contributions. |
|
|
|
||||||
Callista Software Services Pty Ltd |
Yes |
Yes |
06-Feb-13 |
Yes |
|||||
Deakin Residential Services Pty Ltd |
Yes |
Yes |
25-Feb-13 |
Yes |
|||||
Unilink Limited |
Yes |
Yes |
25-Feb-13 |
Yes |
|||||
La Trobe University |
Yes |
Yes |
15-Mar-13 |
Yes |
|||||
La Trobe International Pty Ltd |
Yes |
Yes |
22-Mar-13 |
Yes |
|||||
Medical Centre Development Pty Ltd |
Yes |
Yes |
22-Mar-13 |
Yes |
|||||
Monash University |
Yes |
Yes |
21-Mar-13 |
Yes |
|||||
Monash Accommodation Services Pty Ltd |
Yes |
Yes |
27-Feb-13 |
Yes |
|||||
Monash College Pty Ltd |
Yes |
Yes |
18-Feb-13 |
Yes |
|||||
Monash Commercial Pty Ltd |
Yes |
Yes |
01-Mar-13 |
Yes |
|||||
Monash Educational Enterprises |
Yes |
Yes |
28-Feb-13 |
Yes |
|||||
Monash Health Research Precinct Pty Ltd |
Yes |
Yes |
01-Mar-13 |
Yes |
|||||
Monash Investment Holdings Pty Ltd |
Yes |
Yes |
26-Feb-13 |
Yes |
|||||
Monash Investment Trust |
Yes |
Yes |
26-Feb-13 |
Yes |
|||||
Monash Property South Africa Pty Ltd |
Yes |
Yes |
15-Mar-13 |
Yes |
|
||||
Monash South Africa Ltd |
Yes |
Yes |
15-Mar-13 |
Yes |
|||||
Monash University Foundation |
Yes |
Yes |
04-Mar-13 |
Yes |
|||||
Monash University Foundation Pty Ltd |
Yes |
Yes |
04-Mar-13 |
Yes |
|||||
Royal Melbourne Institute of Technology University |
Yes |
Yes |
07-Mar-13 |
Yes |
|||||
RMIT Foundation |
Yes |
Yes |
11-Feb-13 |
Yes |
|||||
RMIT International University Vietnam |
Yes |
Yes |
04-Mar-13 |
Yes |
|||||
RMIT Training Pty Ltd |
Yes |
Yes |
18-Feb-13 |
Yes |
|||||
RMIT Vietnam Holdings Pty Ltd |
Yes |
Yes |
26-Feb-13 |
Yes |
|||||
Spatial Vision Innovations Pty Ltd |
Yes |
Yes |
21-Feb-13 |
Yes |
|||||
RMIT Link |
Yes |
Yes |
18-Feb-13 |
Yes |
|||||
Swinburne University of Technology |
Yes |
Yes |
07-Mar-13 |
Yes |
|||||
National Institute of Circus Arts Limited |
Yes |
Yes |
25-Feb-13 |
Yes |
|||||
Swinburne College Pty Ltd |
Yes |
Yes |
25-Feb-13 |
Yes |
|||||
Swinburne Intellectual Property Trust |
Yes |
Yes |
05-Mar-13 |
Yes |
|||||
Swinburne Ltd |
Yes |
Yes |
05-Mar-13 |
Yes |
|||||
Swinburne Student Amenities Association Ltd |
Yes |
Yes |
25-Feb-13 |
Yes |
|||||
Swinburne Ventures Limited |
|
Yes |
Yes |
05-Mar-13 |
Yes |
||||
The University of Melbourne |
Yes |
No |
21-Mar-13 |
Yes |
|||||
Reason for qualification: Grant income recognised as liability rather than as income as required by AASB 1004 Contributions. |
|
|
|
||||||
Nossal Institute Ltd |
Yes |
Yes |
18-Mar-13 |
Yes |
|||||
Australian Music Examinations Board (Vic) Ltd |
Yes |
Yes |
18-Mar-13 |
Yes |
|||||
Australian National Academy of Music Foundation Ltd |
Yes |
Yes |
21-Mar-13 |
Yes |
|||||
Australian National Academy of Music Ltd |
Yes |
Yes |
21-Mar-13 |
Yes |
|||||
Melbourne Business School Foundation Trust |
Yes |
Yes |
13-Mar-13 |
Yes |
|||||
Melbourne Business School Foundation Ltd |
Yes |
Yes |
13-Mar-13 |
Yes |
|
||||
Melbourne Business School Ltd |
Yes |
Yes |
13-Mar-13 |
Yes |
|||||
Melbourne University Publishing Ltd |
Yes |
Yes |
28-Mar-13 |
Yes |
|||||
Mount Eliza Graduate School of Business and Government Limited |
Yes |
Yes |
13-Mar-13 |
Yes |
|
||||
MU Student Union Ltd |
|
Yes |
Yes |
21-Mar-13 |
Yes |
||||
UM Commercialisation Pty Ltd |
Yes |
Yes |
18-Mar-13 |
Yes |
|||||
UoM Commercial Ltd |
Yes |
Yes |
22-Mar-13 |
Yes |
|||||
UM Commercialisation Trust |
Yes |
Yes |
18-Mar-13 |
Yes |
|||||
University of Ballarat |
Yes |
Yes |
22-Feb-13 |
Yes |
|||||
Datascreen Pty Ltd |
Yes |
Yes |
21-Mar-13 |
Yes |
|||||
Inskill Pty Ltd |
Yes |
Yes |
21-Mar-13 |
Yes |
|||||
The School of Mines and Industries Ballarat Limited |
Yes |
Yes |
21-Mar-13 |
Yes |
|||||
UB Housing Pty Ltd |
Yes |
Yes |
21-Mar-13 |
Yes |
|||||
Victoria University |
Yes |
Yes |
19-Mar-13 |
Yes |
|||||
Victoria University Enterprises Pty Ltd |
Yes |
Yes |
19-Mar-13 |
Yes |
|||||
Victoria University Foundation |
Yes |
Yes |
19-Mar-13 |
Yes |
|||||
Victoria University Foundation Ltd |
Yes |
Yes |
19-Mar-13 |
Yes |
|||||
Victoria University International Pty Ltd |
Yes |
Yes |
19-Mar-13 |
Yes |
|||||
Victoria University of Technology (Singapore) Pty Ltd |
Yes |
Yes |
19-Mar-13 |
Yes |
|||||
TAFE INSTITUTES |
|||||||||
Advance Institute of Technical and Further Education |
Yes |
Yes |
14-Mar-13 |
Yes |
|||||
Bendigo Regional Institute of Technical and Further Education |
Yes |
Yes |
01-Mar-13 |
Yes |
|||||
Box Hill Institute of Technical and Further Education |
Yes |
Yes |
05-Mar-13 |
Yes |
|||||
Box Hill Enterprises Ltd |
Yes |
Yes |
05-Mar-13 |
Yes |
|||||
Box Hill Singapore Pte Limited |
Yes |
Yes |
26-Mar-13 |
|
Yes |
||||
Central Gippsland Institute of Technical and Further Education |
Yes |
Yes |
01-Mar-13 |
Yes |
|
||||
Chisholm Institute of Technical and Further Education |
Yes |
Yes |
06-Mar-13 |
Yes |
|||||
Caroline Chisholm Education Foundation |
Yes |
Yes |
06-Mar-13 |
Yes |
|
||||
Gordon Institute of Technical and Further Education |
Yes |
Yes |
15-Mar-13 |
Yes |
|||||
GOTEC Limited |
Yes |
Yes |
15-Mar-13 |
Yes |
|||||
Goulburn Ovens Institute of Technical and Further Education |
Yes |
Yes |
22-Mar-13 |
Yes |
|||||
Holmesglen Institute of Technical and Further Education |
Yes |
Yes |
15-Mar-13 |
Yes |
|||||
Holmesglen Foundation |
Yes |
Yes |
22-Mar-13 |
Yes |
|||||
Holmesglen International Training Services Pty Ltd |
Yes |
Yes |
22-Mar-13 |
Yes |
|
||||
Kangan Institute of Technical and Further Education |
Yes |
Yes |
21-Mar-13 |
Yes |
|||||
John Batman Consultancy & Training Pty Ltd |
Yes |
Yes |
21-Mar-13 |
Yes |
|||||
Northern Melbourne Institute of Technical and Further Education |
Yes |
Yes |
28-Feb-13 |
Yes |
|||||
South West Institute of Technical and Further Education |
Yes |
Yes |
22-Mar-13 |
Yes |
|||||
Sunraysia Institute of Technical and Further Education |
Yes |
Yes |
15-Mar-13 |
Yes |
|||||
TAFE Kids Incorporated |
Yes |
Yes |
22-Mar-13 |
Yes |
|||||
William Angliss Institute of Technical and Further Education |
Yes |
Yes |
06-Mar-13 |
Yes |
|||||
Angliss Consulting Pty Ltd |
Yes |
Yes |
06-Mar-13 |
Yes |
|||||
William Angliss Institute Foundation |
Yes |
Yes |
06-Mar-13 |
Yes |
|
||||
William Angliss Pte Limited |
Yes |
Yes |
05-Mar-13 |
Yes |
|||||
Angliss Multimedia Pty Ltd |
Yes |
Yes |
06-Mar-13 |
Yes |
|||||
Angliss Solutions Pty Ltd |
Yes |
Yes |
06-Mar-13 |
Yes |
|||||
Wodonga Institute of Technical and Further Education |
Yes |
Yes |
13-Mar-13 |
Yes |
|||||
Training Entities |
|||||||||
Adult Multicultural Education Services |
Yes |
Yes |
26-Feb-13 |
Yes |
|||||
Centre for Adult Education(a) |
Yes |
Yes |
05-Mar-13 |
Yes |
|||||
Driver Education Centre of Australia Ltd |
Yes |
Yes |
25-Mar-13 |
Yes |
|||||
International Fibre Centre Limited |
Yes |
Yes |
19-Mar-13 |
Yes |
|||||
Audit report contained an ‘emphasis of matter’: Attention drawn to uncertainty surrounding the continued existence of the company beyond 2013. |
|
|
|
||||||
VET Development Centre Ltd |
Yes |
Yes |
22-Mar-13 |
Yes |
|
||||
Telematics Course Development Fund |
Yes |
Yes |
24-Apr-13 |
Yes |
|||||
VERNet Pty Ltd |
Yes |
Yes |
19-Mar-13 |
Yes |
|
||||
COMPLETED AUDITS – 26 MARCH 2012 BALANCES DATE |
|||||||||
Swinburne Holdings(b) |
Yes |
Yes |
07-Dec-12 |
Yes |
|||||
COMPLETED AUDITS – 11 APRIL 2012 BALANCE DATE |
|||||||||
RMIT Drug Discovery Technologies Pty Ltd(b) |
Yes |
Yes |
21-Dec-12 |
Yes |
|
||||
COMPLETED AUDITS – 5 OCTOBER 2012 BALANCE DATE |
|||||||||
Meltech Services Limited(b) |
Yes |
Yes |
20-Dec-12 |
Yes |
|||||
2012 Total |
26 |
69 |
|
93 |
2 |
0 |
|||
95 |
|
|
95 |
||||||
2011 Total |
26 |
68 |
|
|
86 |
7 |
1 |
||
94 |
|
|
Yes |
||||||
INCOMPLETE AUDITS – 7 MAY 2013 |
|||||||||
Australian Regenerative Medicine Institute Joint Venture |
Yes |
|
Audited financial statements yet to be finalised |
||||||
Monash Custodians Pty Ltd |
Yes |
|
Audited financial statements yet to be finalised |
||||||
2012 Total |
0 |
2 |
|
|
|||||
2 |
|
|
|||||||
2011 Total |
0 |
4 |
|
|
|||||
4 |
|
|
|||||||
Alpine resorts
Entity |
Audit type |
Financial statements |
Timeliness of financial statements completion |
||||
|---|---|---|---|---|---|---|---|
FMA |
Non-FMA |
Clear opinion |
Opinion date |
Up to 12 weeks |
12 to 18 weeks |
More than 18 weeks |
|
COMPLETED AUDITS – 31 OCTOBER 2012 BALANCE DATE |
|||||||
Falls Creek Alpine Resort Management Board |
Yes |
|
Yes |
21-Dec-12 |
Yes |
|
|
Lake Mountain Alpine Resort Management Board |
Yes |
|
Yes |
21-Dec-12 |
Yes |
|
|
Mount Baw Baw Alpine Resort Management Board |
Yes |
|
Yes |
21-Dec-12 |
Yes |
|
|
Mount Buller and Mount Stirling Alpine Resort Management Board |
Yes |
|
Yes |
17-Dec-12 |
Yes |
|
|
Mount Hotham Alpine Resort Management Board |
Yes |
|
Yes |
11-Dec-12 |
Yes |
|
|
2012 Total |
5 |
0 |
|
5 |
0 |
0 |
|
|
5 |
|
|
|
5 |
||
2011 Total |
5 |
0 |
|
5 |
0 |
0 |
|
|
5 |
|
|
|
5 |
||
Other entities
Entity |
Audit type |
Financial statements |
Timeliness of financial statements completion |
|||||
|---|---|---|---|---|---|---|---|---|
FMA |
Non-FMA |
Clear opinion |
Opinion date |
Up to 12 weeks |
12 to 18 weeks |
More than 18 weeks |
||
COMPLETED AUDITS – 30 SEPTEMBER 2012 BALANCE DATE |
||||||||
MAPS Group Limited |
Yes |
Yes |
19-Dec-12 |
Yes |
||||
COMPLETED AUDITS – 31 DECEMBER 2012 BALANCE DATE | ||||||||
Anti-Cancer Council of Victoria |
Yes |
|
No |
16-Apr-13 |
|
Yes |
|
|
Reason for qualification: Unable to assess the completeness of cash donations as inherent risk in collecting this type of revenue cannot be mitigated by further internal controls. |
|
|
|
|
|
|
||
Victorian Skills Commission |
Yes |
|
Yes |
30-Apr-13 |
|
Yes |
|
|
2012 Total |
2 |
1 |
|
1 |
2 |
1 |
||
|
3 |
|
|
|
3 |
|||
2011 Total |
1 |
1 |
|
1 |
0 |
1 |
||
|
|
2 |
|
|
|
2 |
||
NOT COMMENCED AUDITS – 31 MARCH 2013 BALANCE DATES |
||||||||
Melbourne Cricket Ground Trust |
|
Yes |
|
Audited financial statements yet to be finalised |
||||
Source: Victorian Auditor-General’s Office.
(a) Centre for Adult Education is a subsidiary of Box Hill Institute of TAFE.
(b) The entity ceased operations during 2012.
Appendix B. Reports on the results of the 2011–12 financial audits
Reports
Figure B1
VAGO reports on the results of the 2011–12 financial audits
Report |
Description |
|---|---|
Auditor-General’s Report on the Annual Financial Report of the State of Victoria, 2011–12 |
The report provided the result of the audit of the state’s annual financial report. It addressed the quality and timeliness of financial reporting, explained significant financial results for the state and financial implications of significant projects and developments that occurred during 2011–12 and subsequent to year end. Tabled in Parliament on 14 November 2012. |
Public Hospitals: Results of the 2011–12 Audits |
The report provided the results of the audits of approximately 110 entities, addressed the timeliness of their financial reporting, their financial sustainability, reviewed the operations of their audit committees, aspects of how they managed capital projects and analysed self-generated hospital revenue. Tabled in Parliament on 14 November 2012. |
Water Entities: Results of the 2011–12 Audits |
The report provided the results of the audits of 20 entities and addresses the timeliness of their financial and performance reporting, their financial sustainability, aspects of how they manage risks and an analysis of water tariff revenue. Tabled in Parliament on 14 November 2012. |
Portfolio Departments and Associated Entities: Results of the 2011–12 Audits |
The report provided the results of the annual financial statement audits of approximately 210 entities. The report comments on the timeliness of their financial reporting, financial sustainability and reporting developments, and aspects of how the departments manage risks, appropriations and trust funds. Tabled in Parliament on 28 November 2012. |
Local Government: Results of the 2011–12 Audits |
This report provides the results of the audits of approximately 100 entities in the local government sector. The report addresses the timeliness of their financial and performance reporting, their financial sustainability, and aspects of how they manage their budget processes and outsourced arrangements. Tabled in Parliament on 28 November 2012. |
Tertiary Education and Other Entities: Results of the 2012 Audits |
The report provides the results of the annual financial audits of approximately 120 entities with a financial year other than 30 June 2012. The report addresses the timeliness of their financial and performance reporting, their financial sustainability, a review of their utilisation of internal audit, and credit card security controls and usage. Tabled in Parliament on 29 May 2013. |
Source: Victorian Auditor-General’s Office.
Appendix C. Frameworks
Financial audit framework
The financial audit framework applied in the conduct of the 2012 audits covered by this report is set out in Figure C1.
Figure C1
Financial audit framework
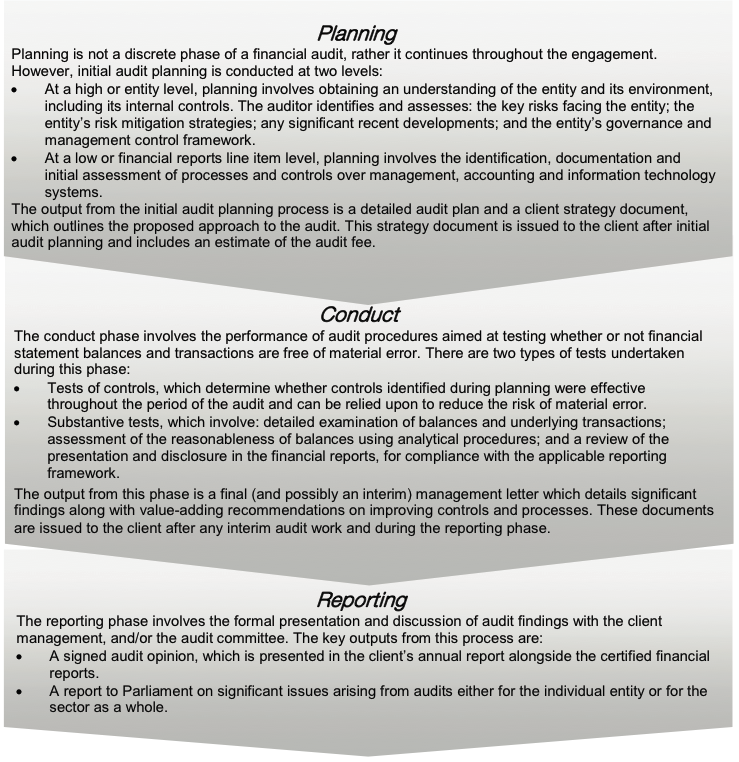
Source: Victorian Auditor-General's Office.
Internal control framework
Figure C2 identifies the main components of an effective internal control framework.
Figure C2
Internal control framework
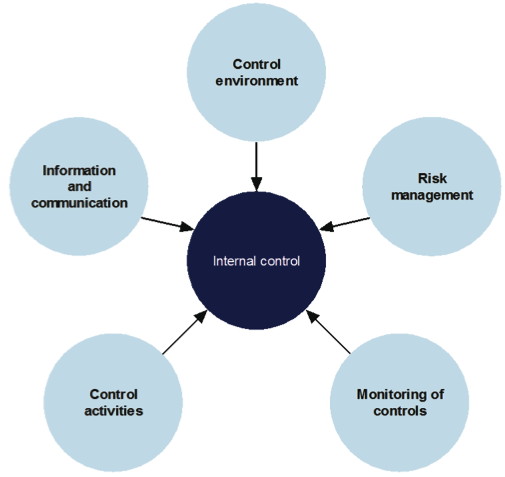
Source: Victorian Auditor-General’s Office.
Financial report preparation
Our assessment of financial reporting performance against better practice was also based on criteria outlined in Figure C3.
Figure C3
Financial report preparation better practice
|
Key area |
Better practice |
|---|---|
|
Financial report preparation plan |
Establish a plan that outlines the processes, resources, milestones, oversight and quality assurance practices required in preparing the financial report. |
|
Preparation of shell statements |
Prepare a shell financial report and provide it early to the auditors to enable early identification of amendments, minimising the need for significant disclosure changes at year end. |
|
Materiality assessment |
Assess materiality, including quantitative and qualitative thresholds, at the planning phase in consultation with the audit committee. The assessment assists preparers to identify potential errors in the financial report. |
|
Monthly financial reporting |
Adopt full accrual monthly reporting to assist in preparing the annual financial report. This allows for the year-end process to be an extension of the month-end process. |
|
Rigorous quality control and assurance procedures |
Require review of the supporting documentation, data and the financial report itself by an appropriately experienced and independent officer prior to providing to the auditors. |
|
Supporting documentation |
Prepare high-standard documentation to support and validate the financial report, and provide a management trail. |
|
Rigorous analytical reviews |
Undertake rigorous and objective analytical review during the financial report preparation process to help improve the accuracy of the report. |
|
Reviews of controls/ self-assessment |
Establish sufficiently robust quality control and assurance processes to provide assurance to the audit committee on the accuracy and completeness of the financial report. |
|
Competency of staff |
Require that preparers of the financial report have a good understanding of, and experience in applying, relevant accounting standards and legislation. Require that they also have project management and interpersonal skills. |
|
Financial compliance reviews |
Undertake periodic compliance reviews to identify areas of noncompliance or changes to legislation that impact the financial report. |
|
Adequate security |
Protect and safeguard sensitive information throughout the process to prevent inappropriate public disclosure. |
Source: Victorian Auditor-General’s Office.
Appendix D. Financial sustainability indicators and criteria
Indicators of financial sustainability
Figure D1
Financial sustainability indicators
|
Indicator |
Formula |
Description |
|---|---|---|
|
Underlying result (%) |
Adjusted net surplus / Total underlying revenue |
A positive result indicates a surplus, and the larger the percentage, the stronger the result. A negative result indicates a deficit. Operating deficits cannot be sustained in the long term. Underlying revenue does not take into account one-off or non-recurring transactions. Net result and total underlying revenue is obtained from the comprehensive operating statement and is adjusted to take into account large one-off (non-recurring) transactions. |
|
Liquidity (ratio) |
Current assets / Current liabilities |
This measures the ability to pay existing liabilities in the next 12 months. A ratio of one or more means there are more cash and liquid assets than short-term liabilities. Current liabilities exclude long-term employee provisions and revenue in advance. |
|
Debt-to-equity (%) |
Debt / Equity |
This is a longer-term measure that compares all current and non-current interest bearing liabilities to equity. It complements the liquidity ratio which is a short-term measure. A low ratio indicates less reliance on debt to finance the capital structure of an organisation. |
|
Self-financing (%) |
Net operating cash flows / Underlying revenue |
Measures the ability to replace assets using cash generated by the entity’s operations. The higher the percentage the more effectively this can be done. Net operating cash flows are obtained from the cash flow statement. |
|
Capital replacement (ratio) |
Cash outflows for property, plant and equipment / Depreciation |
Comparison of the rate of spending on infrastructure with its depreciation. Ratios higher than 1:1 indicate that spending is faster than the depreciating rate. This is a long-term indicator, as capital expenditure can be deferred in the short term if there are insufficient funds available from operations, and borrowing is not an option. Cash outflows for infrastructure are taken from the cash flow statement. Depreciation is taken from the comprehensive operating statement. |
Source: Victorian Auditor-General’s Office.
These indicators should be considered collectively, and are more useful when assessed over time as part of a trend analysis. These indicators have been applied to the published financial information of universities, technical and further education (TAFE) institutes and alpine resort management boards (ARMBs) for the period from 2008 to 2012.
The analysis of financial sustainability in this report reflects on the position of each individual entity, and for the university sector, TAFE sector, and alpine resort sector, respectively. The financial sustainability indicators used in this report are consistent with those used in previous reports to Parliament, and are indicative of the financial sustainability of universities, TAFEs and ARMBs.
Financial sustainability risk assessment criteria
The financial sustainability of each university, TAFE and ARMB has been assessed using the risk criteria outlined in Figure D2.
Figure D2
Financial sustainability indicators – risk assessment criteria
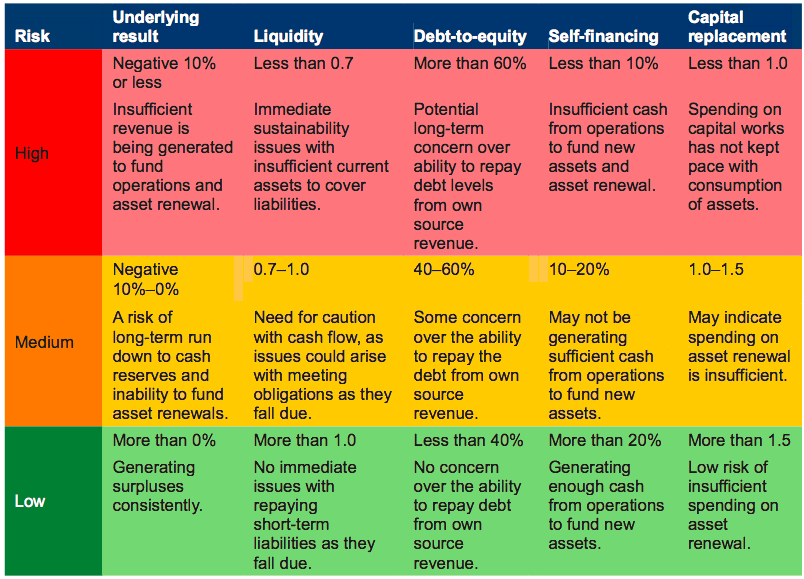
Source: Victorian Auditor-General’s Office.
The overall financial sustainability risk assessment has been calculated using the ratings determined for each indicator as outlined in Figure D3.
Figure D3
Overall financial sustainability risk assessment
|
Risk rating |
Risk indicators |
|---|---|
|
|
High risk of short-term and immediate sustainability concerns indicated by:
|
|
|
Medium risk of long-term sustainability concerns indicated by either:
|
|
|
Low risk of financial sustainability concerns—there are no high-risk indicators |


Source: Victorian Auditor-General’s Office.
Financial sustainability trend key:
 = Improving trend
 = Deteriorating trend
 = No substantial trend identified.
Universities
Underlying result
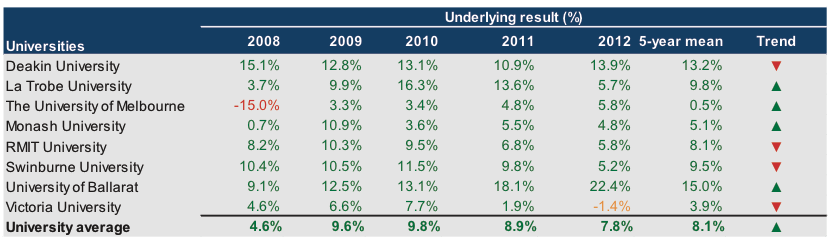
Source: Victorian Auditor-General’s Office.
Liquidity
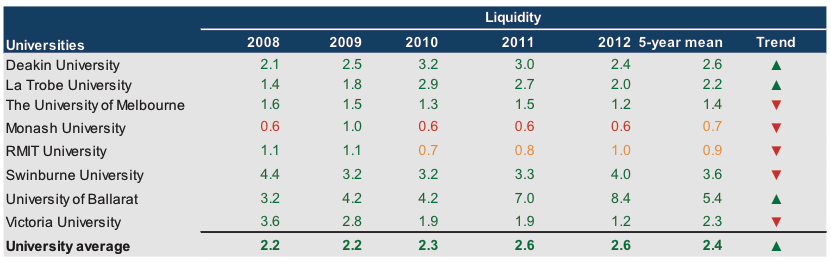
Source: Victorian Auditor-General’s Office.
Debt-to-equity
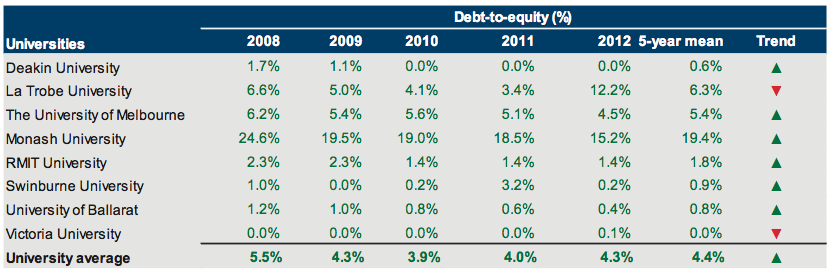
Source: Victorian Auditor-General’s Office.
Self-financing
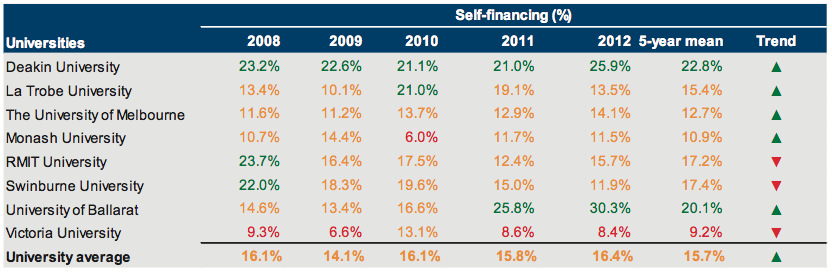
Source: Victorian Auditor-General’s Office.
Capital replacement
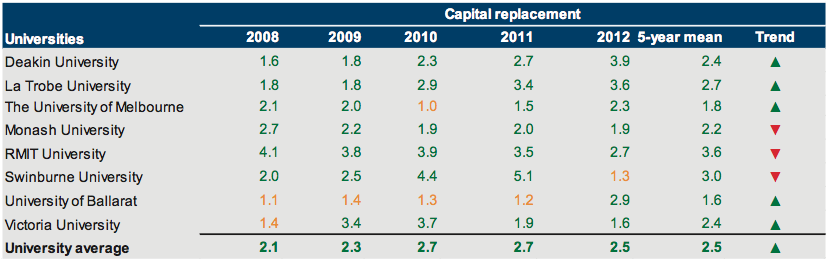
Source: Victorian Auditor-General’s Office.
TAFEs
Underlying result
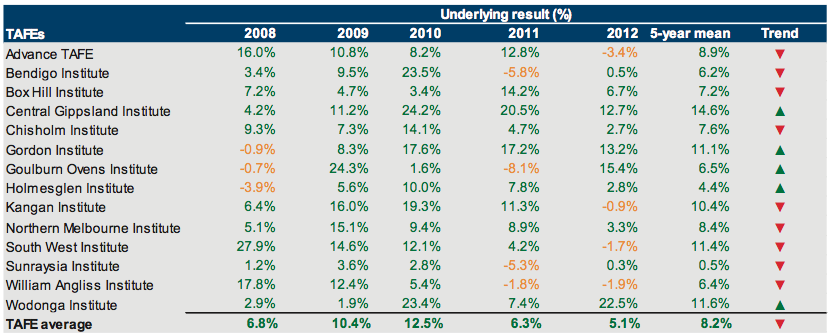
Source: Victorian Auditor-General’s Office.
Liquidity
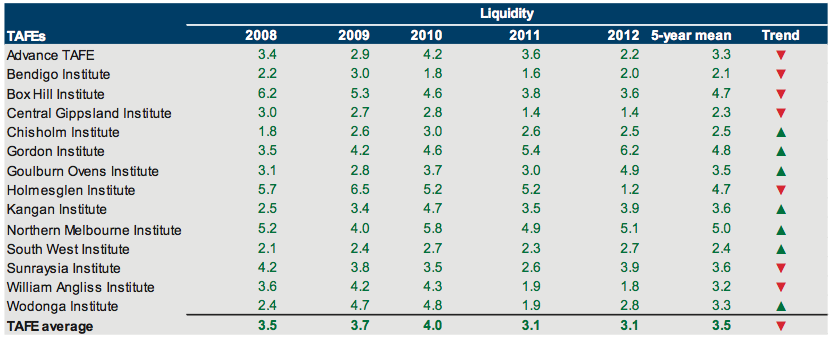
Source: Victorian Auditor-General’s Office.
Debt-to-equity
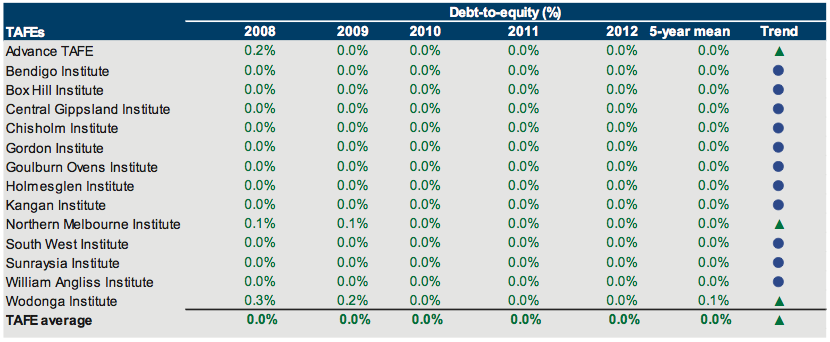
Source: Victorian Auditor-General’s Office.
Self-financing
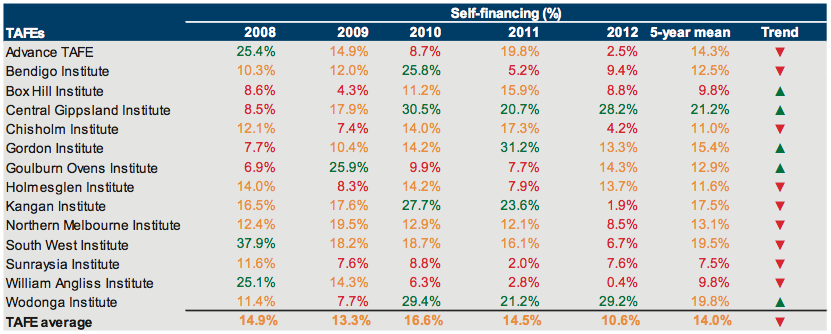
Source: Victorian Auditor-General’s Office.
Capital replacement
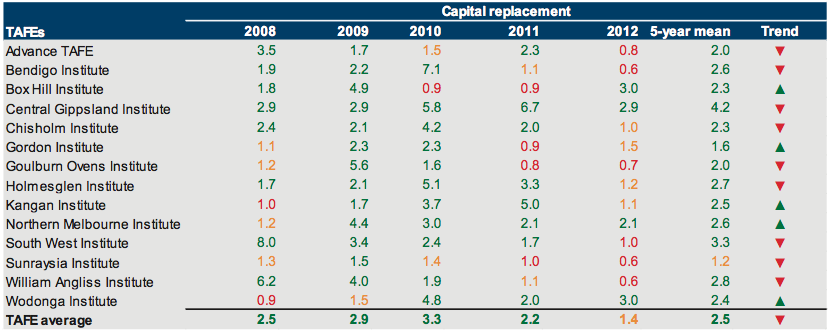
Source: Victorian Auditor-General’s Office.
Alpine resorts
Underlying result
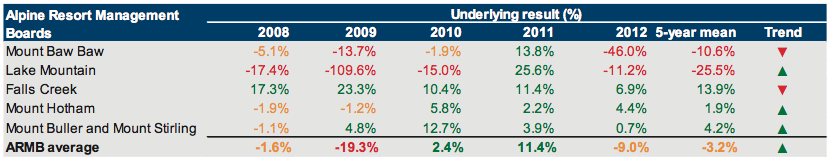
Source: Victorian Auditor-General’s Office.
Liquidity
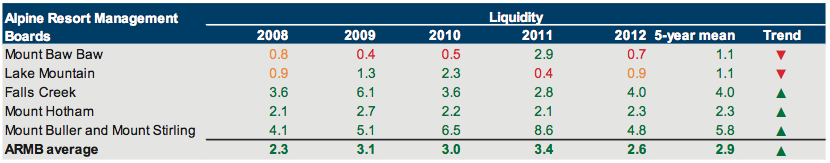
Source: Victorian Auditor-General’s Office.
Debt-to-equity
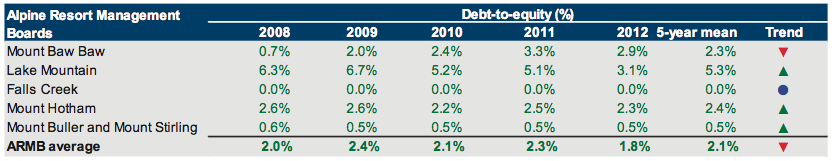
Source: Victorian Auditor-General’s Office.
Self-financing
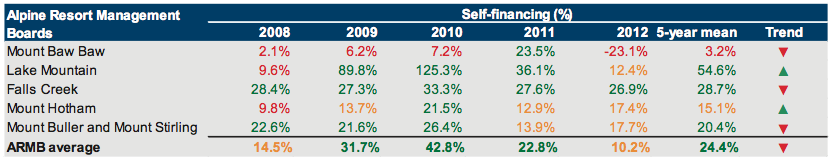
Source: Victorian Auditor-General’s Office.
Capital replacement
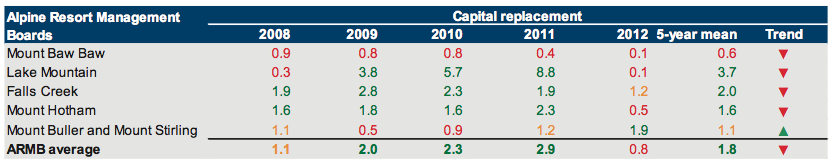
Source: Victorian Auditor-General’s Office.
Appendix E. Acronyms and glossary
Appendix E. Acronyms and glossary
Acronyms
| AASB | Australian Accounting Standards Board |
| ARCC | Alpine Resorts Co-ordinating Council |
| ARMB | Alpine Resort Management Board |
| DEECD | Department of Education and Early Childhood Development |
| PCI | -DSS Payment Card Industry—Data Security Standard |
| DSE | Department of Sustainability and Environment |
| DTF | Department of Treasury and Finance |
| EOM | Emphasis of matter |
| FMA | Financial Management Act 1994 |
| FRD | Financial Reporting Direction |
| FTE | Full-time Equivalent |
| IT | Information Technology |
| KPI | Key Performance Indicator |
| TAFE | Technical and Further Education |
| VAGO | Victorian Auditor-General's Office |
| VET | Vocational Education and Training |
Glossary
Accountability
Responsibility on public sector entities to achieve their objectives, with regard to reliability of financial reporting, effectiveness and efficiency of operations, compliance with applicable laws, and reporting to interested parties.
Amortisation
The systematic allocation of the depreciable amount of an intangible asset over its expected useful life.
Asset
A resource controlled by an entity as a result of past events, and from which future economic benefits are expected to flow to the entity.
Asset useful life
An asset’s useful life is the period over which it is expected to provide the entity with economic benefits. Depending on the nature of the asset, the useful life can be expressed in terms of time or output.
Audit Act 1994
The Audit Act 1994 establishes the operating powers and responsibilities of the Auditor-General. This includes the operations of his office—the Victorian Auditor‑General's Office (VAGO) as well as the nature and scope of audits conducted by VAGO.
Auditor’s opinion
Written expression within a specified framework indicating the auditor's overall conclusion on the financial (and performance) reports based on audit evidence obtained.
Capital expenditure
Amount capitalised to the balance sheet for contributions by a public sector entity to major assets owned by the entity, including expenditure on:
- capital renewal of existing assets that returns the service potential or the life of these assets
- expenditure on new assets, including buildings, infrastructure, plant and equipment
Clear audit opinion – financial report
A positive written expression provided when the financial report has been prepared and presents fairly the transactions and balances for the reporting period in accordance with the requirements of the relevant legislation and Australian Accounting Standards.
Also referred to as an unqualified audit opinion.
Clear audit opinion – performance statement
A positive written expression provided when the performance statement has been prepared and presents fairly the performance indicators and results of performance for the reporting period in accordance with the requirements of the relevant legislation.
Also referred to as an unqualified audit opinion.
Competitive neutrality
Competitive neutrality is about ensuring that the significant business activities of publicly owned entities compete fairly in the market when it is in the public interest for them to do so.
Corporations Act 2001
The Corporations Act 2001 is an act of the Commonwealth of Australia that sets out the laws dealing with business entities in Australia at federal and state levels. It focuses primarily on companies, although it also covers some laws relating to other entities such as partnerships and managed investment schemes.
Depreciation
The systematic allocation of the value of an asset over its expected useful life.
Employee benefits provision
The liability recognised for employees accrued service entitlements, including all accrued costs related to employment comprising of wages and salaries, leave entitlements, redundancy payments and superannuation contributions.
Emphasis of matter
An auditor's report can include an emphasis of matter paragraph that draws attention to a disclosure or item in the financial report that is relevant to the users of the auditor's report but is not of such nature that it affects the auditor's opinion (i.e. the auditor's opinion remains unmodified).
Entity
Is a body whether corporate or unincorporated that has a public function to exercise on behalf of the state or is wholly owned by the state, including departments, statutory authorities, statutory corporations and government business enterprises.
Equity or net assets
Residual interest in the assets of an entity after deduction of its liabilities.
Expense
Outflows or other depletions of economic benefits in the form of incurrence of liabilities or depletion of assets of the entity.
Fair value
The amount for which a financial or non-financial asset could be exchanged between knowledgeable and willing parties in an arm’s-length transaction.
Financial delegation
A schedule that specifies the level or approval required for each transaction category to facilitate the execution of functions necessary for the efficient operation of the entity.
Financial reporting direction
Financial reports are prepared in accordance with Australian Accounting Standards and Interpretations as issued by the Australian Accounting Standards Board (AASB). When an AASB standard provides accounting treatment options, the Minister for Finance issues financial reporting directions to ensure consistent application of accounting treatment across the Victorian public sector in compliance with that particular standard.
Financial sustainability
An entity’s ability to manage financial resources so it can meet spending commitments, both at present and into the future.
Financial year
A period of 12 months for which a financial report (and performance report) is prepared.
Going concern
An entity which is expected to be able to pay its debts as and when they fall due, and continue in operation without any intention or necessity to liquidate or otherwise wind up its operations.
Internal audit
A function of an entity's governance framework that examines and reports to management on the effectiveness of risk management, control and governance processes.
Internal control
Internal control is a means by which an entity’s resources are directed, monitored and measured. It plays an important role in preventing and detecting error and fraud and protecting the entity’s resources.
Liability
A present obligation of the entity arising from past events, the settlement of which is expected to result in an outflow from the entity of resources embodying economic benefits.
Masterfile
A database of records pertaining to one of the main subjects of an information system, such as customers, employees and vendors. Masterfiles contain descriptive data that does not often change, such as name, address and bank account details.
Materiality
Information is material if its omission or misstatement could influence the economic decisions of users taken on the basis of the financial report. Materiality depends on the size or nature of the item or error judged in the particular circumstances of its omission or misstatement.
Net result
The net result is calculated by subtracting an entity’s total expenses from the total revenue, to show what the entity has earned or lost in a given period of time.
Non-reciprocal
Transfers in which an entity receives assets without directly giving equal value in exchange to the other party to the transfer.
Performance statement
A statement containing predetermined performance indicators and targets and actual results against these for that financial year, with an explanation for any significant variance between the results and the targets.
Qualified audit opinion – financial report
A qualification is issued when the auditor concludes that an unqualified opinion cannot be expressed due to one of the following reasons:
- disagreement with those charged with governance
- conflict between applicable financial reporting frameworks
- limitation of scope.
A qualified opinion shall be expressed as being except for the effects of the matter to which the qualification relates.
Relevant
Measures or indicators used by an entity are relevant if they have a logical and consistent relationship to an entity's objectives and are linked to the outcomes to be achieved.
Revaluation
Recognising a reassessment of values for non-current assets at a particular point in time.
Revenue
Inflows of funds or other enhancements or savings in outflows of service potential, or future economic benefits in the form of increases in assets or reductions in liabilities of the entity, other than those relating to contributions by owners which result in an increase in equity during the reporting period.
Risk
The chance of a negative impact on the objectives, outputs or outcomes of the entity.
Tertiary education sector
Tertiary education sector refers to the eight universities and 14 technical and further education (TAFE) institutes.
Appendix F. Audit Act 1994 section 16—submissions and comments
In accordance with section 16(3) of the Audit Act 1994 relevant extracts from the report were provided to all universities, TAFEs, alpine resort management boards, the Department of Treasury and Finance, the Department of Education and Early Childhood Development and the Department of Environment and Primary Industries with a request for submissions or comments.
The submission and comments provided are not subject to audit nor the evidentiary standards required to reach an audit conclusion. Responsibility for the accuracy, fairness and balance of those comments rests solely with the agency head.
Responses were received as follows:
- Department of Education and Early Childhood Development
- Department of Environment and Primary Industries
- Mt Baw Baw Alpine Resort Management Board
Further audit comment:
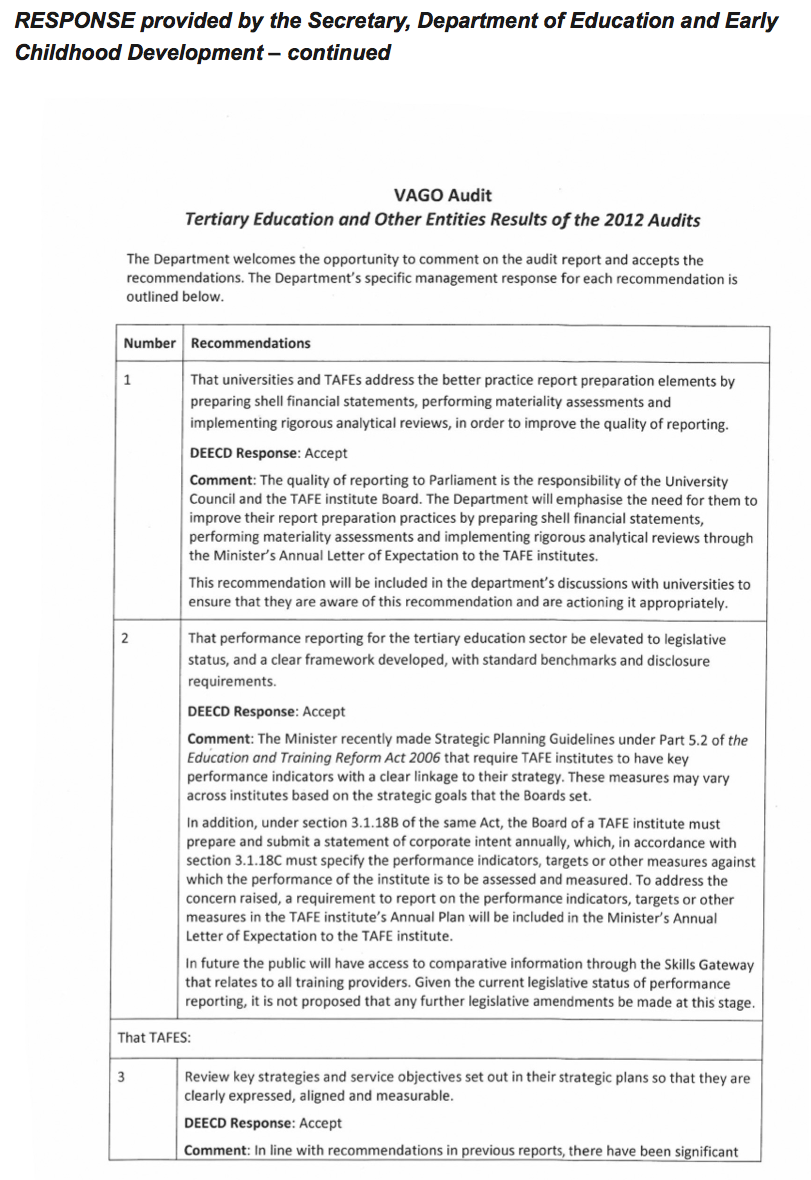
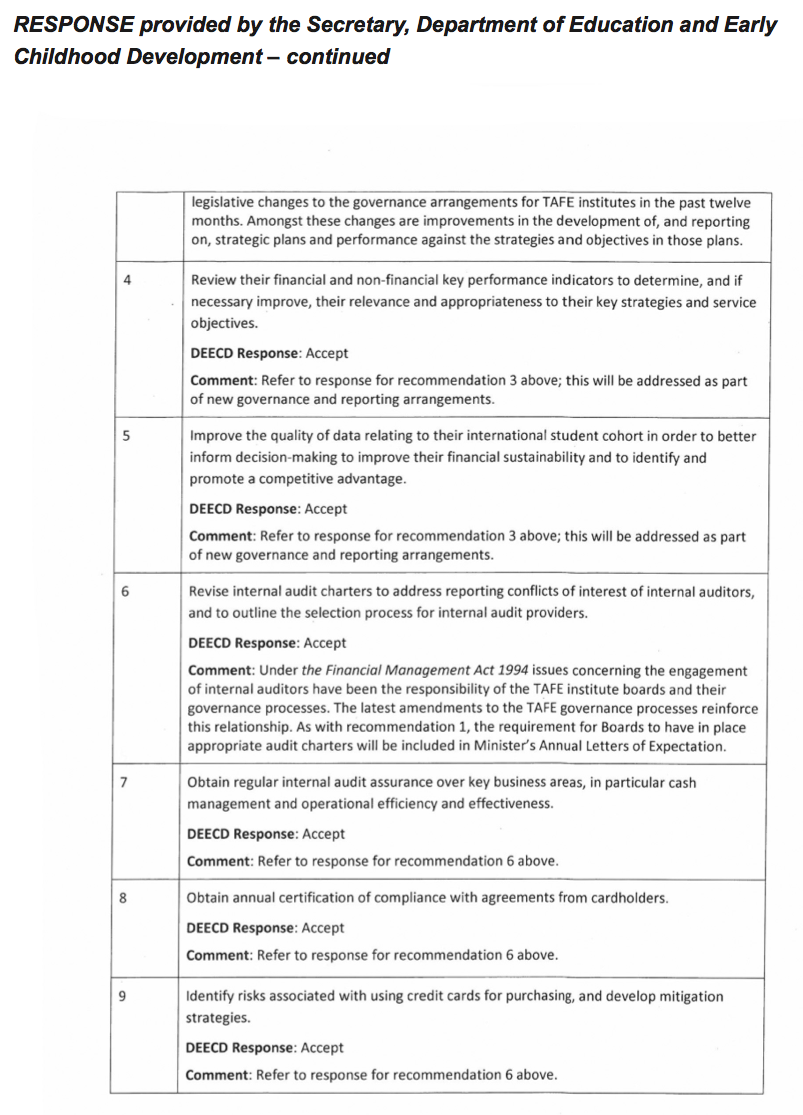
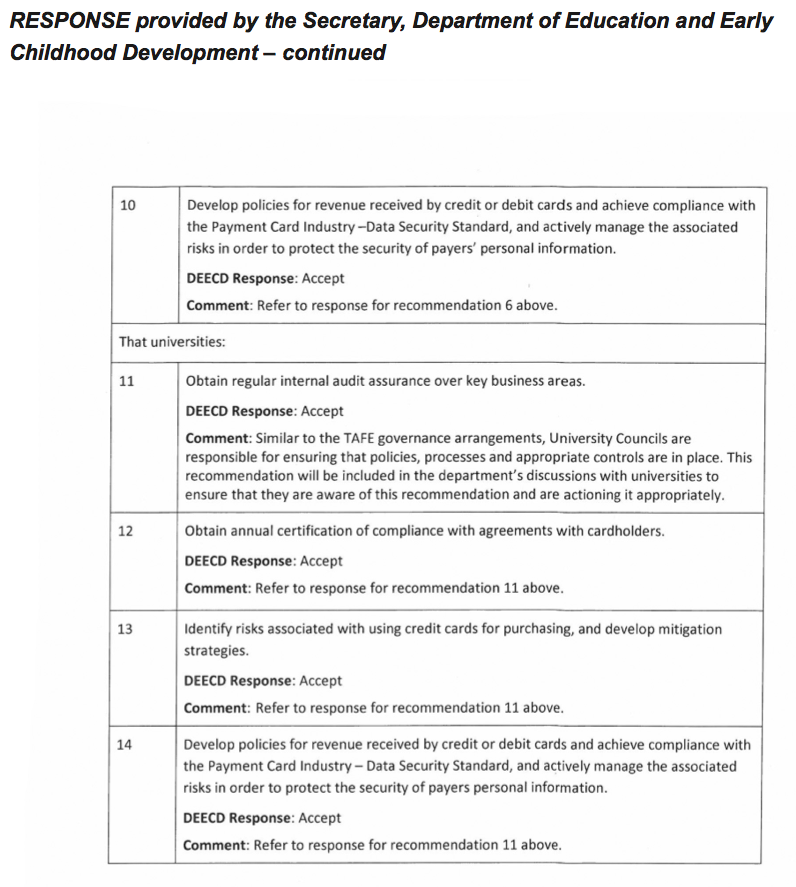
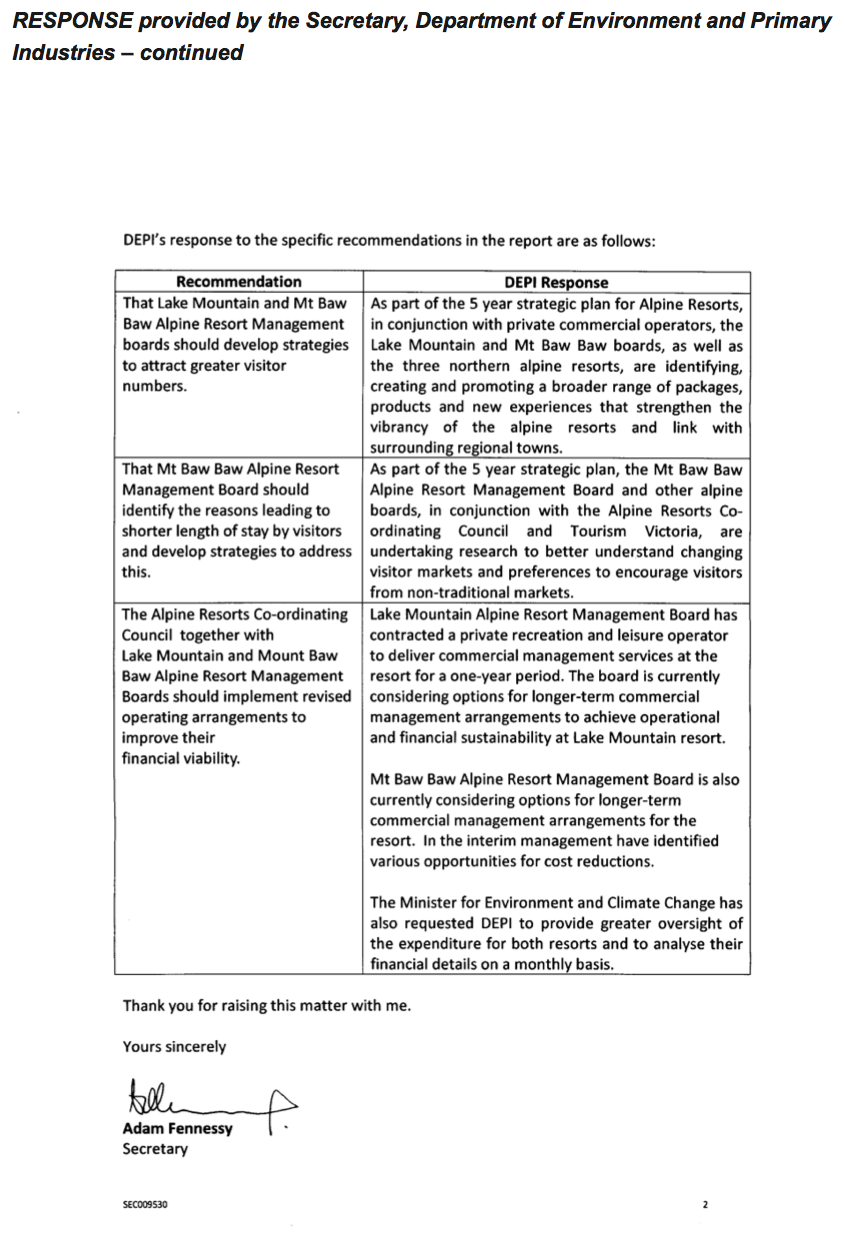
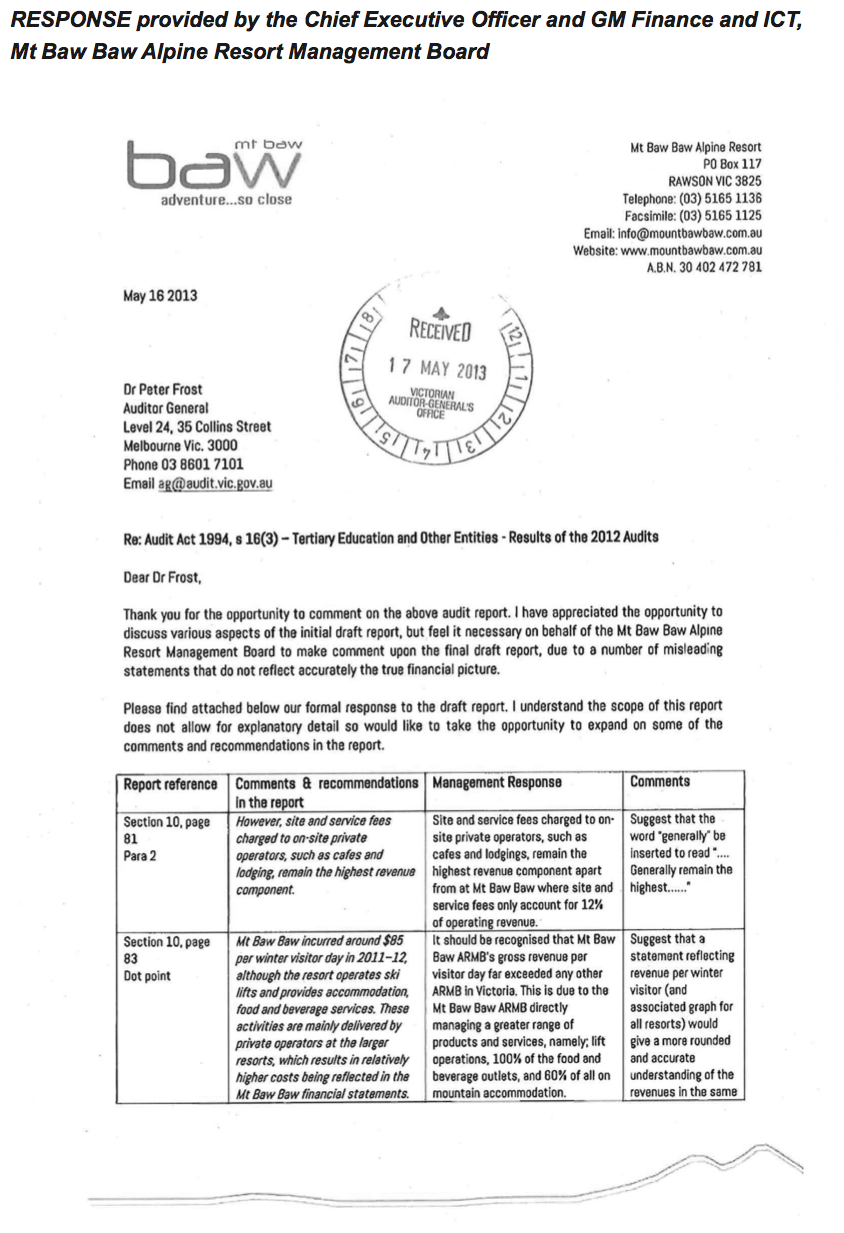
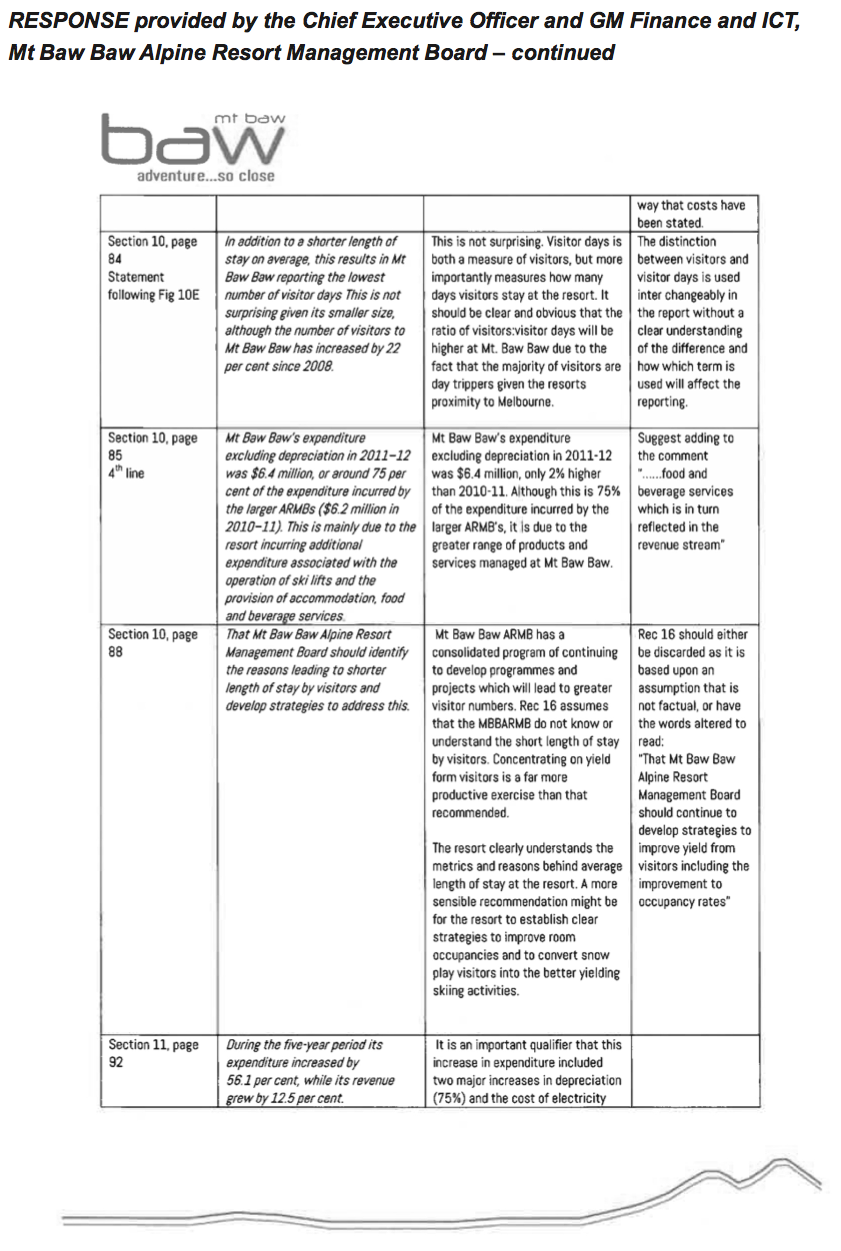
Auditor-General's response to Mt Baw Baw Alpine Resort Management Board
Increase in expenditure
Since 2008 Mt Baw Baw's expenditure has increased by $2.7 million or 56.1 per cent. However this increase was only partly due to higher depreciation and electricity costs. These costs increased by $1.0 million over the past five years, contributing 37 per cent of the total increase in expenditure. Increases in other operating costs have been disproportionate to revenue growth.