Annual Report 2023–24
Auditor-General’s foreword
Auditor-General’s foreword
I was honoured to be reappointed by the Governor for a second term as Auditor-General of Victoria in September 2023. I am proud of the work we delivered over my first term and I start my second term with renewed energy and a strong desire to continue to ‘raise the bar’ – both for my office and for the public sector.
A primary focus will be to adapt to rapidly changing technology by investing in the capability of our people and the audit tools and methods we use to deliver our work program. This investment requires significant capital and we will now we embark on a 3-year period using the financial reserves we have accumulated in my first term to ‘future proof’ our office.
This year we used these reserves to deliver a number of significant transformation projects:
- the rollout of Empower 2.0, an upgraded version of our in-house financial data analytics platform that serves to makes the audit process more efficient for both our clients and our staff
- a new strategic planning framework for determining our performance audit work program that we will ensure that we continue to deliver credible and authoritative reports that are relevant, timely and informative
- the evolution of our quality control framework into our system of quality management enhancing the robustness of our approach to audit quality.
We also worked on:
- replacing our legacy audit toolsets, and are well progressed in this regard for our financial audits
- a comprehensive review and refresh of our performance engagement methodology and supporting guidance, anticipating the proposed changes to the assurance standard to come into effect next year.
Pleasingly we have been able to effectively balance our transformational agenda with our core purpose – our audits, producing more reports to Parliament than in previous years and increasing our financial audit production effort by 13 per cent compared with last year.
Realising our strategic intent relies on an engaged and capable workforce, we have continued to invest in our goal of an enriched experience for our people with the launch of new capability frameworks for our financial and performance auditors. These frameworks position us well to further enhance the professional development and career growth for our people.
In closing, I acknowledge and thank all my staff for their professionalism, dedication and commitment to upholding our core values and delivering on our mission.
Andrew Greaves
Auditor-General
1. Our role and approach
Our unique position and access to information enables us to identify common issues and provide useful insights for members of Parliament (MPs), the public and the agencies we audit.
About VAGO
VAGO’s role
The Auditor-General is an independent officer of the Victorian Parliament. They are appointed on behalf of Victorians to scrutinise how well the government spends public money.
The Audit Act 1994 establishes the Auditor-General’s mandate and the Victorian Auditor-General’s Office (VAGO). It provides the legal basis for our powers and identifies our responsibilities.
The Constitution Act 1975 establishes the Auditor-General’s role. It gives the Auditor-General complete discretion in how they perform and exercise their functions and powers.
Our services to Parliament and Victorians
We audit public sector agencies’ financial reports and provide opinions on their performance statements.
The agencies we audit include government departments, statutory bodies, educational institutions, public hospitals, water corporations, insurers and local government councils.
We also do performance engagements that assess the effectiveness, efficiency, economy and compliance of government agencies, programs and services.
With our follow-the-dollar powers, we can audit non-government organisations that provide services under government contracts.
Our role in Victoria’s integrity system
We are part of Victoria’s integrity system alongside the Independent Broad-based Anti-corruption Commission (IBAC), the Victorian Ombudsman and the Victorian Inspectorate (VI).
We protect the public interest by helping to hold the government accountable. We achieve this by doing financial and performance audits of public sector agencies and reporting the results to Parliament.
Our unique position and access to information across the entire Victorian public sector allow us to identify common issues and provide useful insights to the agencies we audit.
We make recommendations for agencies to improve their services and function more efficiently and effectively. We also give agencies collated information through our data analytics dashboards.
Our governance arrangements
Our governance arrangements promote effective and accountable strategic and operational oversight of our work.
Our structure
Our office is structured across 4 business units:
- The office of the Auditor-General (OAG), which is led by the Auditor-General, is responsible for overseeing and delivering audit quality, strategy, governance and risk.
- Corporate services (CS), which is led by the Deputy Auditor-General, is responsible for delivering data analytics and systems assurance, finance, human resources and information technology services.
- Financial audit (FA), which is led by the Assistant Auditor-General financial audit, delivers our attest services program.
- Parliamentary reports and services (PRS), which is led by the Assistant Auditor-General parliamentary reports and services, delivers our performance audit and assurance review program.
Figure 1: Our leadership structure
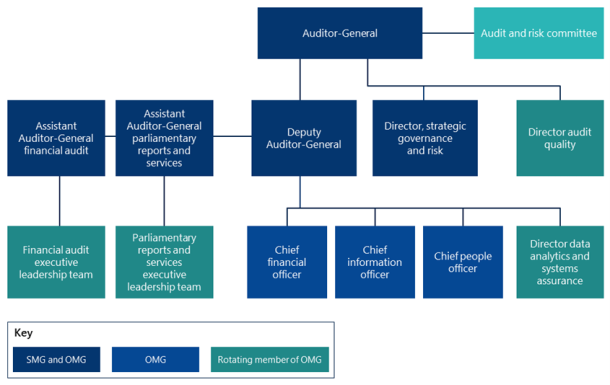
Note: SMG stands for strategic management group. OMG stands for operational management group.
Governance groups and committees
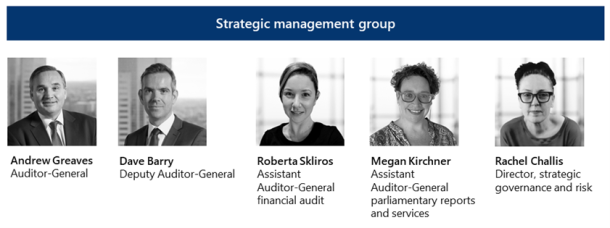
Our strategic management group (SMG) is collectively responsible for setting and monitoring VAGO’s strategy, overseeing good cultural governance, performance from an outcomes and sustainability perspective and ensuring we have strong executive leadership.
Figure 2: Our SMG
Our operational management group (OMG) oversees and enhances the efficiency, effectiveness, and integrity of our operations.
OMG is responsible for monitoring performance, managing risks, ensuring compliance with policies and regulations and driving continuous improvement in operational practices. The committee supports strategic workforce management, technology and infrastructure development and crisis response, while fostering a culture of accountability, innovation, and collaboration.
Our audit and risk committee (ARC) reports to the Auditor-General and independently reviews and assesses the effectiveness of our systems and controls for financial management, performance and sustainability and risk management.
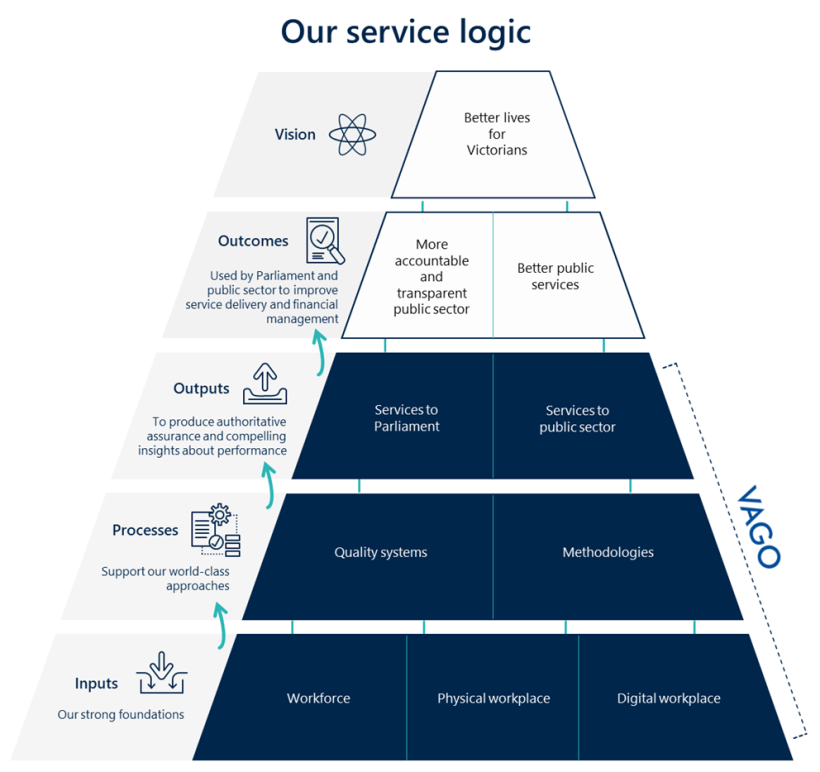
Vision, goals and values
Our vision is better lives for Victorians.
Our goals are a more accountable and transparent public sector and better public services.
We work to achieve our goals and vision by using our legislated powers, systems and resources as well as the skills, knowledge and experience of our people.
This is reflected in our service logic.
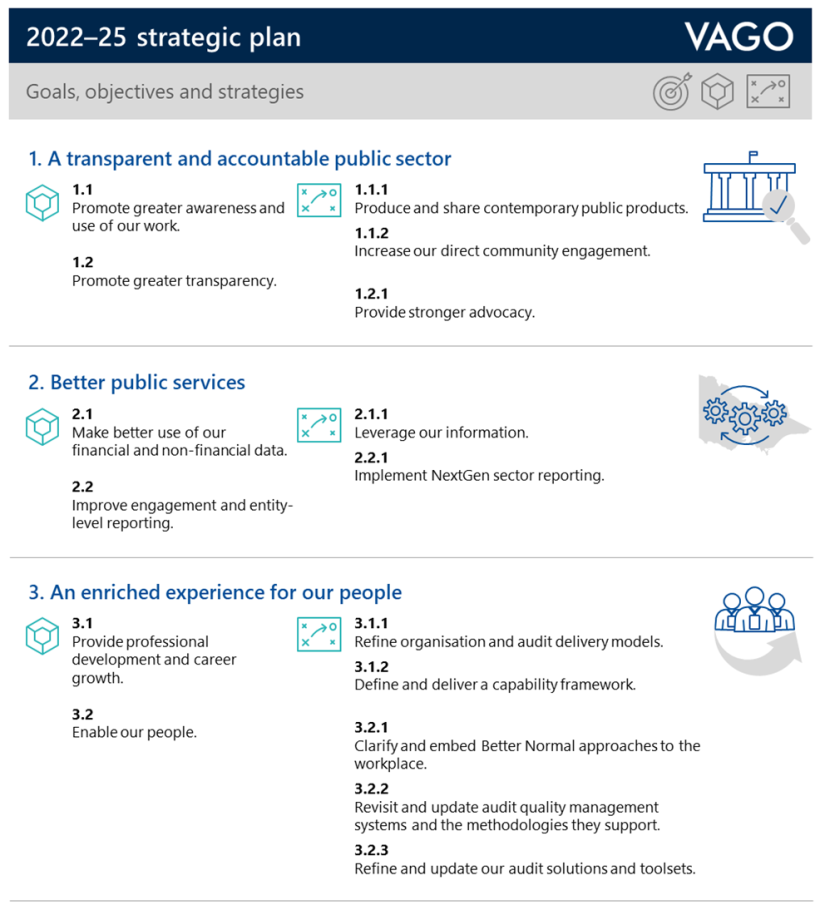
Our Strategic Plan 2022–2025
Our Strategic Plan 2022–2025 builds on the work from our Strategic Plan 2017–2021, which we did not fully realise due the COVID-19 pandemic.
While our strategic direction and initiatives from the 2017–21 plan served us well, we continue to look forward. We know we can achieve more and we will adapt to ensure our work remains relevant and effective.
How we are accountable
Accountability to Parliament and Victorians
We are accountable to Parliament and all Victorians for how efficiently and effectively we perform our auditing services and how economically we use public resources.
We maintain our accountability through:
- oversight by the Public Accounts and Estimates Committee (PAEC), including consulting with it on our budget, annual plans and audit specifications
- regular external audits by independent auditors that PAEC selects. This includes annual audits of our financial and performance statements and a performance audit every 4 years, which examines and reports on the quality of our financial and performance reporting and resource management
- responding to and reporting on progress against recommendations made by PAEC-appointed external financial and performance auditors
- publishing our performance measures and targets in Budget Paper 3: Service Delivery
- oversight by the VI, including providing an attestation every 6 months on how we have used our coercive powers
- monitoring and publishing gifts and benefits and the Auditor-General’s expenses
- voluntarily publishing a transparency report.
The Audit Act 1994 requires us to be independently audited at least once every 4 years to determine if the Auditor-General and VAGO are achieving their objectives effectively, economically and efficiently and in compliance with relevant Acts.
2019–20 external audit
In 2019–20 PAEC appointed Allen and Clark Consulting to audit us. Allen and Clark Consulting tabled its report in Parliament on 4 August 2020. The report concluded that:
‘The Auditor-General and VAGO are operating in compliance with all relevant Acts of Parliament. Moreover, the Auditor-General and VAGO are, in all material respects, operating effectively, economically and efficiently and achieving their objectives in compliance under the Act’.
The report made 31 recommendations. We monitor our progress in implementing these recommendations by providing:
- periodic updates to our OMG and ARC
- updates to PAEC twice a year.
| Of the 31 recommendations, we … | At 30 June 2024 we have … |
|---|---|
accepted:
|
|
| did not accept one recommendation. |
2023–24 external audit
In October 2023 PAEC appointed MartinJenkins to audit us. MartinJenkins tabled its report in Parliament on 30 July 2024. The report identified several strengths, including our:
- policies and processes for defining and ensuring independence
- contribution to an effective and efficient public service
- staff’s professionalism
- contemporary methodology, tools and techniques
- focus on quality and continuous improvement
- focus on staff wellbeing and development
The report also made 19 recommendations for us to:
- resolve issues affecting people, culture and organisational development
- improve the efficiency and effectiveness of our performance audits
- improve the value and impact of our audits
- realise opportunities for improving our organisational efficiency and effectiveness.
Figure 3: Our response to the 2024 performance audit recommendations
| Accepted in full | Accepted in part | Accepted in principle | Did not accept |
|---|---|---|---|
| 10 recommendations | 2 recommendations | 7 recommendations | 0 recommendations |
Source: Parliament of Victoria.
See our website for a copy of the performance audit report: https://www.audit.vic.gov.au/how-we-are-accountable.
Reporting on our performance
Every year we report on performance measures and targets in Budget Paper 3: Service Delivery. We set these measures and targets with the Assistant Treasurer.
We include our 2023–24 performance results against these measures in the following sections of this report:
- Section 3: A transparent and accountable public sector
- Section 4: Better public services
- Section 6: Performance statement
Note on our performance statement
Consistent with previous years, Section 6 of this report includes our independently audited performance statement.
While we are not required to have this statement audited, we believe it is necessary to promote transparency and better practice in the public sector. It assures readers that our non-financial performance information is reliable in the same way the independent external audit opinion on our financial report provides assurance.
Oversight by the VI
The VI is an oversight body within Victoria’s integrity system.
The VI receives and assesses complaints made about us and examines our use of coercive powers. It also monitors our compliance with the Audit Act 1994.
We previously worked with the VI to develop a self-reporting tool on using our coercive powers. We did not exercise these powers in 2023–24.
The VI advised us that it received a mandatory notification from the Victorian Ombudsman under section 16F of the Ombudsman Act 1973. The VI confirmed that the complaint was closed with no further action because it was outside the VI’s jurisdiction.
Monitoring and publishing our expenses
The Standing Directions 2018 under the Financial Management Act 1994 require us to publish our gifts, benefits and hospitality policy and register on our website.
Our ARC monitors the Auditor-General’s expenses. We voluntarily publish this information on our website to further promote transparency and accountability.
Transparency report
In March 2024 we published our Transparency Report 2023. This is our fourth annual transparency report.
We are not required by law to produce transparency reports. However, we choose to adopt the requirements of the Corporations Act 2001 (to the extent they are relevant and appropriate) and further expand on our annual report disclosures.
Our Transparency Report 2023 details:
- the transition from our quality control framework to our system of quality management
- our investment in audit quality
- our legal structure, governance and finances
- our internal system of quality management and how it aligns with the Australian Auditing and Assurance Standards Board (AUASB), relevant ethical requirements and the applicable legal and regulatory requirements
- external reviews and audits of our office.
Our transparency report is available at https://www.audit.vic.gov.au/transparency-report.
2. What we do and how we work
Our purpose is to inform Parliament and Victorians about the public sector’s performance and how to improve public services.
Our legislative function
Our legislated function is to undertake and report on reasonable and limited assurance engagements.
Within this defined scope, we do:
- performance engagements (audits and reviews) of public sector entities for and on behalf of Parliament
- attest engagements for public sector agencies on the financial and non-financial reports they prepare.

Performance engagements
What we assess
Parliament funds us to determine if public sector bodies are complying with legislation while effectively, economically and efficiently:
- achieving their objectives
- providing their services
- performing their activities.
Our follow-the-dollar powers
We can use our follow-the-dollar powers during our performance engagements, which allow us to audit:
- community sector and for-profit organisations contracted to provide government services
- how government grant recipients use their funds.
What we choose to audit
VAGO delivers around 20 performance engagements each year. This number depends on a range of factors, including:
- the complexity and/or breadth of each proposed engagement
- if auditees have data and information available to provide in a timely way
- our internal resources.
We can select engagement topics from a breadth of areas. This year we created a new strategic planning framework that we will use to create our forward work program for the foreseeable future.
Our strategic planning framework has 5 levels that we use to gradually narrow down our focus from all public sector activities to a list of standalone engagement topics. Data plays a pivotal role in identifying topics and in planning and undertaking engagements.
Our objective is to design a program that delivers credible and authoritative reports that are relevant, timely and informative for both Parliament and the community.
Our new strategic planning framework is detailed in the infographic below.

Level of assurance
The level of assurance refers to the measure of the confidence we have in our conclusions.
This confidence depends on the source, quality and quantity of evidence we obtain.

While a performance audit engagement gives the highest level of assurance, a limited assurance review (where we obtain a lower standard of evidence from agencies) can help us examine and report relatively quickly and cost effectively.
Section 20 of the Audit Act 1994 gives us the power to undertake limited assurance reviews. We generally use these reviews to focus on waste, probity and compliance. We can also use them to assess economy, efficiency and effectiveness.
A limited assurance review often has a narrower scope and looks at:
- a specific activity or set of transactions
- a single issue of significant public interest.
We design our work program with MPs’ information needs in mind. We also consider the nature of an issue and required level of assurance.
Parliamentary reports and services
Overview of parliamentary reports and services program delivery
| As outlined in our Annual Plan 2023–24, we planned to deliver … | And we delivered ... |
|---|---|
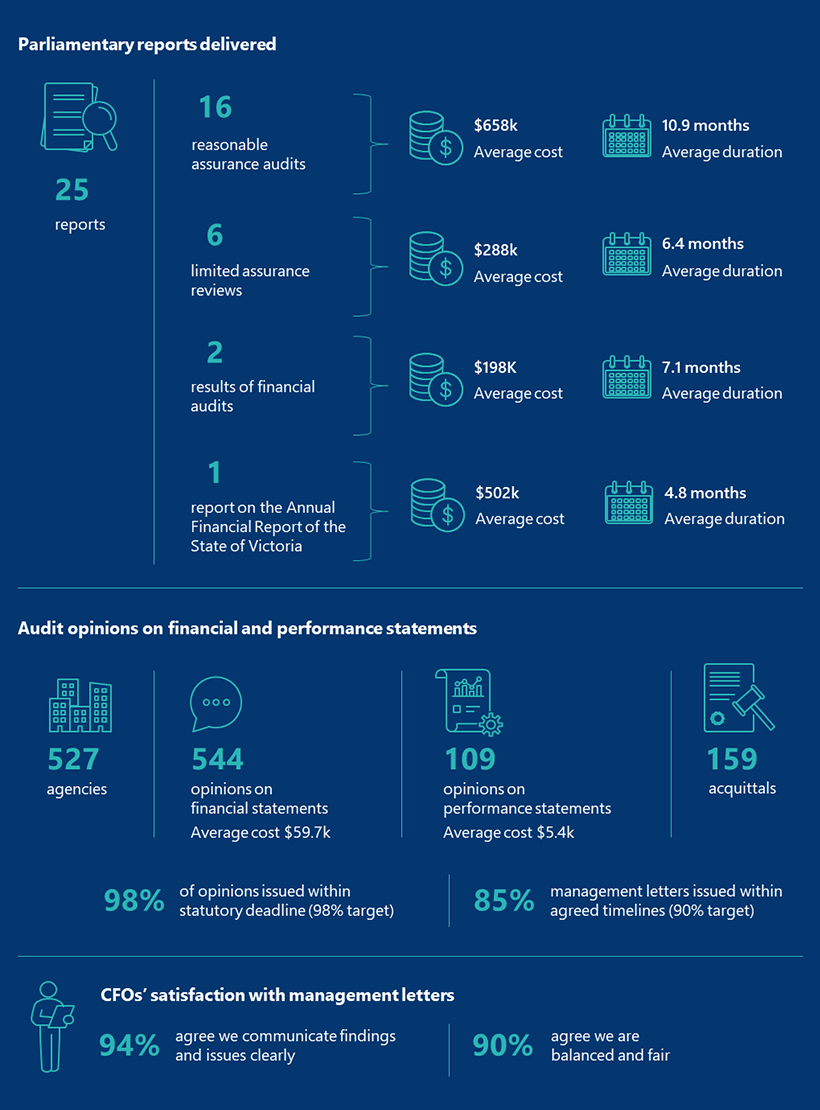
| 26 reports to Parliament | 25 reports. |
| 17 reasonable assurance audit reports | 16 reports, including:
|
| 5 limited assurance review reports | 6 reports, including:
|
| 4 results of financial audits reports |
|
At 30 June 2024 there were 8 reports to Parliament that were still in progress, including:
- 6 reasonable assurance audit reports
- one limited assurance review report
- one results of financial audits report.
One of these reports was carried over from 2022–23.
Appendix A contains a detailed reconciliation of our 2023–24 parliamentary report program.
Average cost of parliamentary reports
In 2023–24 the average cost of the 25 parliamentary reports we tabled was $525,778. This is within 5 per cent of our target of $552,000.
Figure 4: Average cost of parliamentary reports from 2019–20 to 2023–24

Source: VAGO.
When evaluating the average cost of parliamentary reports, it is important to note that 4 different types of parliamentary reports are delivered, with significant variations in the scope, complexity and cost of each type of engagement and consequently each report.
Figure 5: Cost of different types of parliamentary reports in 2023–24
| Type of report | Number tabled | Lowest cost | Highest cost | Average cost |
|---|---|---|---|---|
| Reasonable assurance audit report | 16 | $290,000 | $1,170,000 | $657,528 |
| Limited assurance review report | 6 | $112,000 | $610,000 | $287,666 |
| Results of audits | 2 | $160,000 | $236,000 | $198,000 |
| Annual financial report of the state | 1 | $502,000 | ||
| Overall result | 25 | $525,778 |
Source: VAGO.
Average time taken to produce performance audit parliamentary reports
In 2023–24 it took us an average of 10.9 months to produce our performance audit reports. This is above our target of 9 months.
Despite this, our average duration compares favourably to our peers in other Australasian Council of Auditors-General (ACAG) jurisdictions over the last 2 years, as Figure 6 shows.
Figure 6: Average duration in months of VAGO performance audits compared to ACAG average from 2019–20 to 2023–24

Source: VAGO
Similar to the average cost, the average duration varies for different types of engagements. When we include both audits (reasonable assurance) and reviews (limited assurance), we are much closer to our target of 9 months, as Figure 7 shows.
Figure 7: Duration of different types of parliamentary reports in 2023–24
| Type of audit report | Number tabled | Shortest duration | Longest duration | Average duration |
|---|---|---|---|---|
| Performance audit report | 16 | 7.4 months | 15.7 months | 10.9 months |
| Limited assurance review report | 6 | 4.1 months | 12.9 months | 6.4 months |
| Performance engagements overall | 22 | 9.7 months |
Source: VAGO.
Figure 8: Average duration in months of all performance engagements from 2019–20 to 2023–24

Source: VAGO.
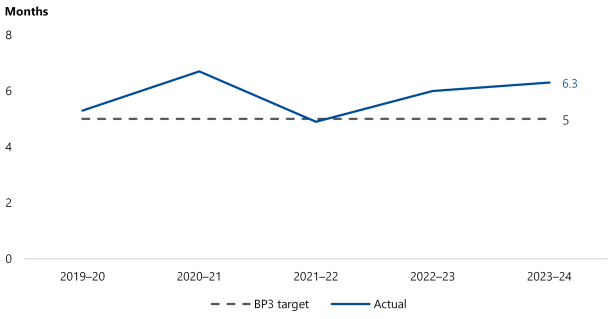
Average time taken to produce financial audit parliamentary reports
In 2023–24 it took us an average of 6.3 months from the relevant balance date to produce our financial audit parliamentary reports. This is above our target of 5 months.
Figure 9: Average duration in months to produce financial audit reports from 2019–20 to 2023–24
Source: VAGO.
What our clients have told us
After we table a performance engagement report in Parliament, we ask our auditees a series of questions about how satisfied they were with the:
- process
- value
- final report.
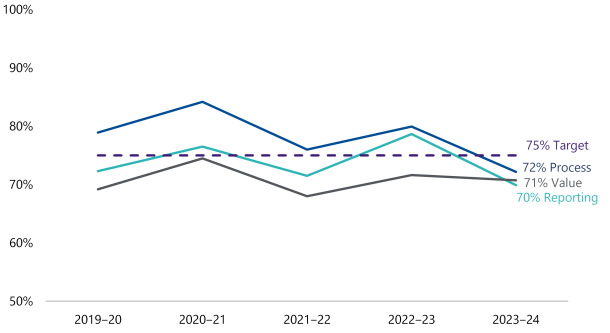
Our overall target is 75 per cent satisfaction.
Our performance improvement committee uses these results to identify opportunities to refine our audit program and approach.
In 2023–24 we surveyed a number of stakeholders involved in 20 different engagements. As Figure 10 shows, the results varied significantly across different dimensions and engagements.
Figure 10: Agency satisfaction results by dimension for 2023–24
| Dimension | Least satisfied | Most satisfied | Average satisfaction |
|---|---|---|---|
| Process | 52.1% | 87.5% | 72.2% |
| Reporting | 41.7% | 87.5% | 69.9% |
| Value | 37.5% | 100.0% | 70.7% |
| Overall | 43.8% | 91.7% | 70.9% |
Source: VAGO.
Figure 11: Performance engagement client average level of satisfaction with our process, value and reporting from 2019–20 to 2023–24
Source: VAGO.
Attest services
How we are engaged
As detailed in our Annual Plan 2023–24, our program of delivering attest services to the public sector agencies is mandated under the Audit Act 1994. We:
- express an audit opinion on all state and local government entities’ financial and performance reports
- review the general government sector’s estimated financial report for the 2024–25 budget
- express an audit opinion on the Annual Financial Report of the State of Victoria (AFR)
- review grant acquittal certifications (and natural disaster control acquittals for 2021–22).
Level of assurance
The cost and practicality of achieving absolute assurance is not feasible.
The level of assurance we are able to provide, which is a measure of the confidence we have in our conclusions, depends on the source, quality and quantity of evidence we obtain.
We design our work programs with the information needs of our report users in mind. We consider if we need to provide them with reasonable assurance or if a lower level of assurance may be appropriate, based on:
- reliability
- relevance
- fair presentation
- compliance with the Australian Accounting Standards and relevant legislation.
Financial reports
When we audit an entity’s financial report we assess if it fairly presents the entity’s financial results in line with relevant standards and legislation.
We then provide an independent opinion on the financial report that confirms the reliability of the published financial information.
Performance statements
We also audit entities’ performance statements and provide an audit opinion on their reliability and completeness.
We audit performance statements for entities in the following sectors:
- local government
- TAFE
- water.
Performance statements contain an entity’s target and actual results against mandatory performance indicators. Entities establish these indicators through the relevant minister’s direction.
Our assurance confirms the reliability of each entity’s published performance information.
Annual Financial Report of the State of Victoria
The Auditor-General’s audit opinion on the AFR is a significant piece of assurance we provide Parliament and the Victorian community.
The AFR consolidated over 280 state-controlled entities’ financial results. While we audit and provide opinions on these entities’ individual financial reports, we also audit and provide an opinion on the consolidated AFR.
Our opinion on the AFR provides assurance that the State of Victoria’s published financial outcomes, and the general government sector within it, are reliable. This means users can confidently rely on the information to inform decisions.
Review opinion of the State Budget
Each year, the government prepares estimated financial statements as part of its budget as required by the Financial Management Act 1994. This is often referred to as the State Budget.
The purpose of these statements is to set out the projected financial results for the general government sector based on the government’s stated and expected financial policies and assumptions.
Under the Audit Act 1994, we review the estimated financial statements to confirm they have been prepared consistently with relevant accounting policies, targets and policy strategies and objectives.
Our opinion is included in Chapter 1 of Budget Paper No. 5: Statement of Finances.
Grant acquittals
Some public sector entities are given grants to provide specific services to the community. Entities must use these funds appropriately and meet the terms and conditions of the grant agreement.
Part of our work is understanding and testing the use of grants to provide confidence that public funds are used as agreed.
Audit opinions delivered in 2023–24
In 2023–24 we issued 544 audit opinions on financial reports prepared by 527 agencies. We carried over 26 of these opinions from previous reporting periods.
We also issued:
- 109 audit opinions on local councils’, water agencies’ and TAFEs’ performance statements
- 159 acquittals for local councils and departments.
Audit opinions on financial and performance statements
Average cost of audit opinions issued on financial statements
The average cost of audit opinions represents the typical audit fee we charge our clients.
Under the Audit Act 1994, we recover all reasonable expenses associated with conducting audits.
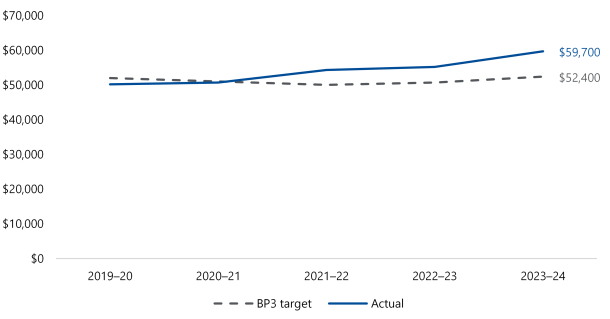
In 2023–24 the average cost per financial report audit opinion was $59,700. This is 13.9 per cent above our target of $52,400.
The main reasons our average cost increased this year are:
- we rebased our financial audit engagement fees when we needed to put in additional effort or costs to complete the audit (for example, increased complexity due to machinery of government changes or accounting challenges, or to pass on increases in our contracted audit services costs)
- we indexed the remaining audit fees by 4 per cent in line with the Australian Bureau of Statistics wage price index.
Figure 12: Average cost of audit opinions issued on financial statements from 2019–20 to 2023–24
Source: VAGO.
The current department funding model caps the increase in our annual targets based on an indexation percentage, the Australian Bureau of Statistics wage price index. As outlined in Figure 12, our actual costs have increased above the set indexation over time.
Since 2022 we have consistently requested an increase to our target for the average cost of audit opinions issued on financial statements, to reflect our expected costs more accurately. Our requests to date have been rejected by the Treasurer and Assistant Treasurer.
We also benchmark our financial audit opinion costs with our ACAG peers for:
- state and Australian government opinions
- local government opinions.
In 2023–24 the cost of our financial audit opinions compared favourably to the ACAG average.
Figure 13: VAGO opinion types compared to ACAG averages
| 2022–23 | 2023–24 | |||||
|---|---|---|---|---|---|---|
| Opinion type | VAGO | ACAG | VAGO | ACAG | ||
| State/territory government opinion | $77,049 | $117,072 | ✓ | $77,885 | $129,386 | ✓ |
| Local government opinions | $68,874 | $69,619 | ✓ | $77,642 | $80,735 | ✓ |
Note: We calculated the ACAG averages by dividing the actual costs for a financial year into the number of opinions issued. Our Budget Paper No. 3: Service Delivery (BP3) target in Figure 12 is the average of the actual lifecycle costs for a project – a financial audit project typically spans across 2 financial years. Both are useful measures.
Source: VAGO.
Average cost of audit opinions issued on performance statements
In 2023–24 the average cost for audit opinions issued on performance statements was $5,400. This is below our target of $5,700 and consistent with our results of the last 5 years.
Figure 14: Average cost of audit opinions issued on performance statements from 2019–20 to 2023–24

Source: VAGO.
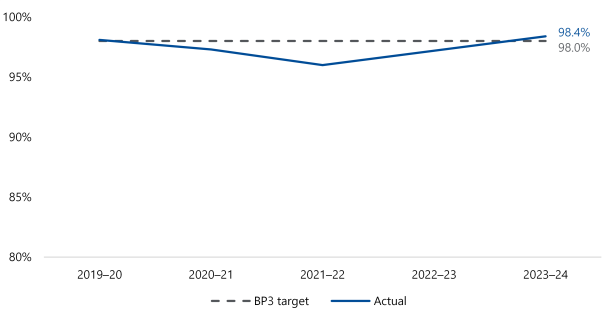
Timeliness of audit opinions delivery
In 2023–24 we issued 98.4 per cent of audit opinions within the statutory deadline (exceeding our target of 98 per cent).
Figure 15: Percentage of audit opinions issued within the statutory deadline from 2019–20 to 2023–24
Source: VAGO.
We improved the timeliness of the delivery of audit opinions in 2023–24 compared with 2022–23:
- 68.3 per cent of opinions were issued by October (60.9 per cent in 2022–23)
- 82.5 per cent of opinions were issued by November (75.6 per cent in 2022–23).
Figure 16: Percentage of audit opinions issued per month by balance date

Source: VAGO.
Timeliness of management letters delivery
In 2023–24 we issued 85.7 per cent of management letters within agreed timelines (outside our target of 90 per cent).
The main reasons we did not meet our timeliness target for issuing management letters in 2023–24 were due to:
- identifying complex audit issues that required further consideration and drafting
- delays in receiving clients’ responses to our findings
- changes in the external environment outside our control (for example, audits impacted by machinery-of-government changes took longer than anticipated).
Figure 17: Percentage of management letters issued within established timeframes from 2019–20 to 2023–24

Source: VAGO.
While missing our overall target, pleasingly our timeliness improved as the audit cycle progressed as we focused on getting back on track post-pandemic. This is evident by the improvement in delivery of final management letters:
- for our 30 June 2023 audit cycle we issued 15.4% final management letters late
- for our 31 December 2023 audit cycle only 1.6% management letter was issued late.
Satisfaction with management letters
We want to ensure that we not only meet our time and cost targets, but our clients also value our work.
Each year we ask the chief financial officers (CFOs) of our clients how satisfied they are with our management letters.
In 2023–24, of the CFOs who responded to our survey:
- 94 per cent agreed that the letters clearly communicate findings and issues (up from 90 per cent in 2022–23)
- 90.6 per cent agreed that the letters were balanced and fair (up from 89.2 per cent in 2022–23).
Figure 18: CFOs’ satisfaction with our management letters from 2019–20 to 2023–24

Source: VAGO.
3. A transparent and accountable public sector
Parliamentary accountability is a cornerstone of effective government. Publicly reporting the results of our work to Parliament and all Victorians means they are better informed and able to hold the government accountable.
We want to be a source of credible, authoritative assurance about the public sector’s performance and deliver reports that are well regarded, balanced and fair.
In 2023–24 we continued to refine and evolve our parliamentary products and associated web content.
Our vision is to produce an integrated suite of digital content that is more accessible, understandable and usable as well as reliable, meaningful and timely.
Our work and parliamentary committees
Parliamentary committees
The Parliament of Victoria has 2 houses:
- the Legislative Assembly, which has 88 members and 88 districts (one member per district)
- the Legislative Council, which has 40 members and 8 regions (5 members per region).
There are different parliamentary committees, including:
- legislative council committees
- legislative assembly committees
- joint committees, which are formed by members from both houses.
Many of our performance audits received attention from these committees in 2023–24, which we discuss below.
Gambling and liquor regulation in Victoria: a follow up of three Auditor-General reports
In recent years we have tabled 3 parliamentary reports relating to liquor and gambling regulation and minimising the harm caused by gambling and alcohol.
Following significant interest on the impact of gambling in recent years, PAEC further built on our initial work, expanding their scope by also examining the regulations and harm associated with online gambling.
In November 2023 PAEC tabled its report Gambling and liquor regulation in Victoria: a follow up of three Auditor-General reports.
Inquiry into the 2023‒24 budget estimates
In October 2023 PAEC tabled its Report on the 2023‒24 Budget Estimates.
The committee’s inquiry into the budget estimates promotes the accountability, transparency and integrity of the executive and the public sector. PAEC’s report, findings and recommendations referred to a number of our tabled reports:
- Measuring and Reporting on Service Delivery (2021)
- Follow‑up of Maintaining the Mental Health of Child Protection Practitioners (2022)
- The Effectiveness of Victoria Police’s Staff Allocation (2022)
- Effectiveness of Rail Freight Support Programs (2023)
- Supporting Sexual and Reproductive Health (2023)
- Results of 2021–22 Audits: Local Government (2023).
Performance of the Victorian integrity agencies 2021/22
In November 2023 the Integrity and Oversight committee tabled its report Performance of the Victorian integrity agencies 2021/22.
In the report the committee references the paper Budget independence for Victoria’s Independent Officers of Parliament, which we jointly published with IBAC and the Victorian Ombudsman in October 2022.
The report also referenced the Prevention and Education Advisory Committee (PEAC). PEAC meets quarterly to consider, collaborate on and develop corruption prevention and education resources and training for the Victorian public sector.
Alongside VAGO, PEAC’s membership comprises representatives from:
- IBAC
- the Local Government Inspectorate
- the Office of the Victorian Information Commissioner
- the Victorian Ombudsman
- the Victorian Public Sector Commission.
We note and welcome the committee’s recommendation to extend PEAC membership to the VI.
Inquiry into the impact of road safety behaviours on vulnerable road users
In May 2024 the Legislative Assembly Economy and Infrastructure Committee published its report Inquiry into the impact of road safety behaviours on vulnerable road users. This report referenced our 2020 Accessibility of Tram Services report.
In our report we concluded that tram services are not meeting the accessibility needs of passengers with mobility restrictions. We found that in 2018–19, only 15 per cent of tram services delivered a low-floor tram at a level-access stop.
The committee reinforced our earlier work and recommended that the Department of Transport and Planning prioritises delivering accessible tram stops.
Inquiry into the 2026 Commonwealth Games Bid
In September 2023 the Legislative Council established the Select Committee on the 2026 Commonwealth Games bid.
At the committee’s request, the Auditor-General and a member of the audit team who worked on our Withdrawal from 2026 Commonwealth Games report attended a briefing with the committee in October 2023.
The committee’s interim report, which it tabled in April 2024, references information published in our March 2024 report.
Inquiry into the rental and housing affordability crisis in Victoria
In November 2023 the Legislative Council Legal and Social Issues Committee tabled its report The rental and housing affordability crisis in Victoria.
The report references 3 of our audits, dating back to 2012:
- Managing Victoria’s Public Housing (2017)
- Accessibility of Mainstream Services for Aboriginal Victorians (2014)
- Access to Public Housing (2012).
What MPs are telling us
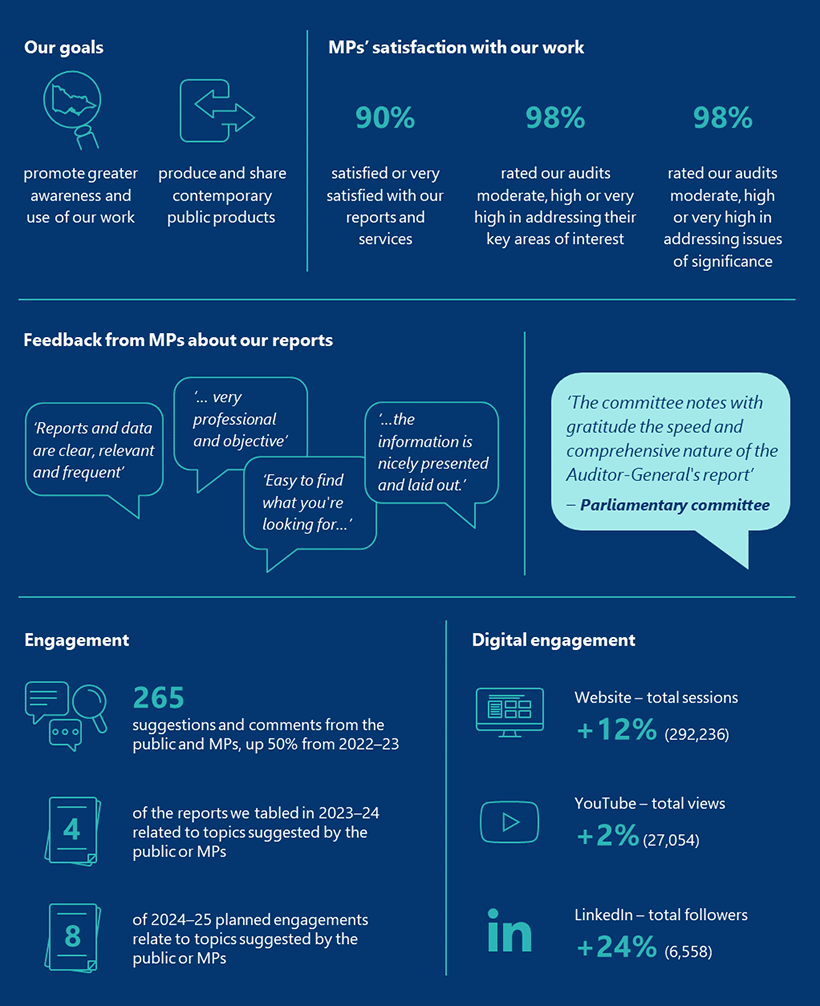
MPs’ satisfaction with our work
Alongside the public sector, MPs are the key audience of our work. Each year we survey them to find out how satisfied they are with our work.
Overall, in 2023–24, 90 per cent of MPs who responded to our survey said they were either satisfied or very satisfied with our reports and services (compared to 78 per cent in 2021–22).
We also ask them if they think our reports and services:
- provide valuable information on public sector performance
- clearly communicate issues
- help improve public sector administration
- assist them in their parliamentary role.
Figure 19: Percentage of MPs who are satisfied with our work from 2019–20 to 2023–24

Note: There was no survey in 2022–23.
Source: VAGO.
We also ask MPs to what extent our performance audits address:
- their key areas of interest
- issues of significance.
In 2023–24, 98 per cent of MPs who responded to our survey rated our performance audits as moderate, high or very high in addressing their key areas of interest and issues of importance.
Figure 20: Percentage of surveyed MPs who think our performance audits address their key areas of interest from 2019–20 to 2023–24

Source: VAGO.
Figure 21: Percentage of surveyed MPs who think our performance audits address issues of significance from 2019–20 to 2023–24

Source: VAGO.
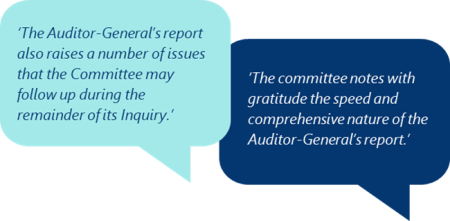
In our 2023–24 survey MPs also told us:

Making our work accessible and engaging
Increasing the accessibility of our work
Effective communication is crucial to achieving our strategic objectives. We continue to improve the readability of our reports for Parliament and Victorians by:
- writing in plain English
- applying information mapping to structure our reports
- using more graphic elements.
Easy English
In 2023–24 we published an Easy English version of the snapshot of our Guardianship and Decision-making for Vulnerable Adults report.
Easy English is a way of writing that uses short sentences, everyday language and clear images to help readers understand the message. Our goal was to increase the accessibility of our findings and recommendations to the end users of these services.
We used Easy English to increase the accessibility of our report’s key messages to people who may have difficulty reading and understanding complex information.
References and use of our work
The Inspector-General for Emergency Management maintains a contemporary online resource of assurance reports that are relevant to statewide risks.
In 2023–24 the Inspector-General updated its resources to include links to 3 of our performance engagement reports:
- Managing State-significant Risks (2024)
- Reducing the Illegal Disposal of Asbestos (2023)
- Cybersecurity: Cloud Computing Products (2023).
Engaging with the public
When we develop our annual plan engagement topics we consult with the agencies we audit.
We encourage Parliament and the public to suggest audit topics to make sure our work program reflects relevant issues.
Four of the audits we tabled in 2023–24 relate to issues raised in referrals from members of the public and MPs:
- Domestic Building Oversight Part 1: Regulation
- Domestic Building Oversight Part 2: Dispute Resolution
- Planning Social Housing
- Withdrawal from Commonwealth Games 2026.
In 2023–24 we received 265 pieces of correspondence from MPs and the public. This is an increase of over 50 per cent compared with 2022–23.
The correspondence included:
- 249 requests and suggestions from the general public (compared with 164 in 2022–23)
- 16 requests from MPs (compared with 11 in 2022–23).
A number of performance engagements in our Annual Plan 2024–25 relate to topics and issues raised by MPs and the public, including:
- Accessibility of tram services: follow-up
- Domestic building insurance
- Elective survey in Victoria
- Maintaining the condition of state-managed roads
- Managing disruptions affecting Victoria’s public transport network
- Managing the transition of energy supply to renewables
- Realising the benefits identified in the Suburban Rail Loop business case
- Recovering and reprocessing resources from waste: effectiveness of system reforms.
Our main communication platforms
We continue to proactively share content across multiple channels, including our website, YouTube and social media channels.
Figure 22 summarises engagement levels across our website, YouTube and LinkedIn, which are our 3 main platforms.
The popularity of some of our older videos indicates that interest in our work extends long after we table a report in Parliament.
Figure 22: Digital engagement statistics for our website, YouTube and LinkedIn
| Platform | Main purpose | Engagement and comparison with last year | Top report pages/posts |
|---|---|---|---|
| VAGO website | Present, share and display our past and future work program | 292,236 total sessions (+12%) 173,256 unique users (+14%) 2.3 minutes actively spent on the website (−0.3 min) | Withdrawal from 2026 Commonwealth Games (2024) Cybersecurity: Cloud Computing Products (2023) Contractors and Consultants in the Victorian Public Service: Spending (2023) |
| YouTube | Host and share videos, including summaries of tabled reports and industry forums | 27,054 total views (+2%) 168,986 total impressions (+5%) 504 total subscribers (+15%) 1,007 total hours watched (−5%) | Occupational Violence Against Healthcare Workers (2015) Melbourne Metro Tunnel Phase 2: Main Works (2022) Managing Conflicts of Interest in Procurement (2021) |
Promote VAGO to potential employees and graduates Build the public’s understanding of our overall purpose and work Share information about tabled reports and supporting products, such as data analytics dashboards and report summary videos | 6,558 total followers (+24%) | Our office in 1985: microcomputers Welcome to our new graduates Video: Withdrawal from 2026 Commonwealth Games |
Source: VAGO.
Public sector advocacy programs
Advocacy programs
We have a leadership role to influence and shape how well the public sector reports its performance by making information publicly available that is reliable, meaningful and timely.
We are undertaking 4 programs to directly advocate and influence change in the Victorian public sector and accounting profession based on insights from our work.
These programs are:
- simplification of public sector financial reporting
- challenge fair value in the public sector
- prepare for climate accountability
- rationalised public sector financial reporting framework.
These advocacy programs are in addition to the insights we provide to Victorian public sector bodies to improve their services.
Simplification of public sector financial reporting
This project focuses on influencing the Department of Treasury and Finance’s (DTF) proposal for a simplified financial reporting framework for qualifying public sector entities.
This initiative aligns with our strategic goal to improve public sector financial reporting. Simplifying financial reporting is important because increasingly complex and lengthy financial reports can be hard for users to understand.
We shared our observations and recommendations from this project with DTF. We emphasised the need to maintain transparency and accountability through financial reporting within the proposed framework. We also continued to highlight the importance of streamlining financial reports to help meet DTF’s intended outcomes.
DTF adopted most of our recommendations and the final proposals were approved in June 2024. They will take effect from the 2024–25 financial year onward.
Challenge fair value in the public sector
In 2023–24 our advocacy work focused on educating auditors and other staff who prepare financial reports about the new fair value measurement requirements that the Australian Accounting Standards Board (AASB) introduced for not-for-profit public sector entities. We did this work in collaboration with DTF.
Additionally, we worked with regulators to understand their approach to assessing the impact of these requirements. The program has helped entities get ready to prepare financial reports in line with the new requirements, which apply as of 31 December 2024.
Prepare for climate accountability
We established this program to help the public sector prepare for the new climate-related financial disclosures introduced in 2022.
In 2023–24 we led drafting of the Australasian Council of Auditors-General’s (ACAG) response to AASB’s exposure draft Australian Sustainability Reporting Standards – Disclosure of Climate-related Financial Information.
We also contributed to ACAG’s response to AASB’s consultation paper regarding the proposed adoption of the international auditing standard ISSA 5000 Assurance over Climate and Other Sustainability Information.
Additionally, we engaged with key stakeholders, including AASB, AUASB, DTF, and Local Government Victoria. Our aim was to stay informed about their progress on reporting and assurance impacts in addition to advocating public sector perspectives in standard-setting.
We periodically engaged with ACAG through various forums, such as the Auditors General’s business meetings, the heads of financial audit committee, the financial reporting committee, and the audit standards committee. These interactions allowed us to share our experiences and learn about other jurisdictions’ progress and plans.
ACAG and the heads of financial audit committee have started discussing potentially co-designing audit methodologies and underlying procedures.
Rationalised public sector financial reporting framework
Through this program we aim to advocate for and influence a clear and straightforward financial reporting framework for the Australian public sector that balances user needs with preparer costs.
Since this project is linked to AASB’s public sector financial reporting framework, there has been limited progress since 2022–23, with our focus primarily on monitoring AASB’s activities.
Other presentations and leadership initiatives
Presentations and engagement
Representatives from our office hosted, presented and engaged with other key stakeholders throughout 2023–24, including:
- hosting 2 forums for the chairs and members of our clients’ audit committees, where we explored the latest and emerging public sector trends and insights
- presenting an overview of our Employee Health and Wellbeing in Victorian Public Hospitals audit at the Australian Nursing and Midwifery Conference
- attending the Pacific Association of Supreme Audit Institutions’ Governance and Leadership Women Symposium, which explored themes including:
- sustainable audit practices
- quality management
- gender policy
- governance, accountability and empowerment
- leading and managing change
- participating in sector and industry-based panels, for example:
- department and portfolio sector agency CFO forums
- FinPro
- VicWater
- Municipal Association of Victoria
- AASB
- AUASB panels and working groups
- providing our sector insight newsletters to our clients
- providing financial reporting alerts and public sector perspectives articles via our website
- providing fraud action alerts.
4. Better public services
Accountability and transparency help improve public services.
We have a role to play in helping the public sector understand and mitigate risks to efficient and effective service delivery.
By leveraging our information we have a unique opportunity to maximise the value and impact of work. We continue to seek opportunities to evolve our product offerings and provide insights about the public sector and how it delivers services.
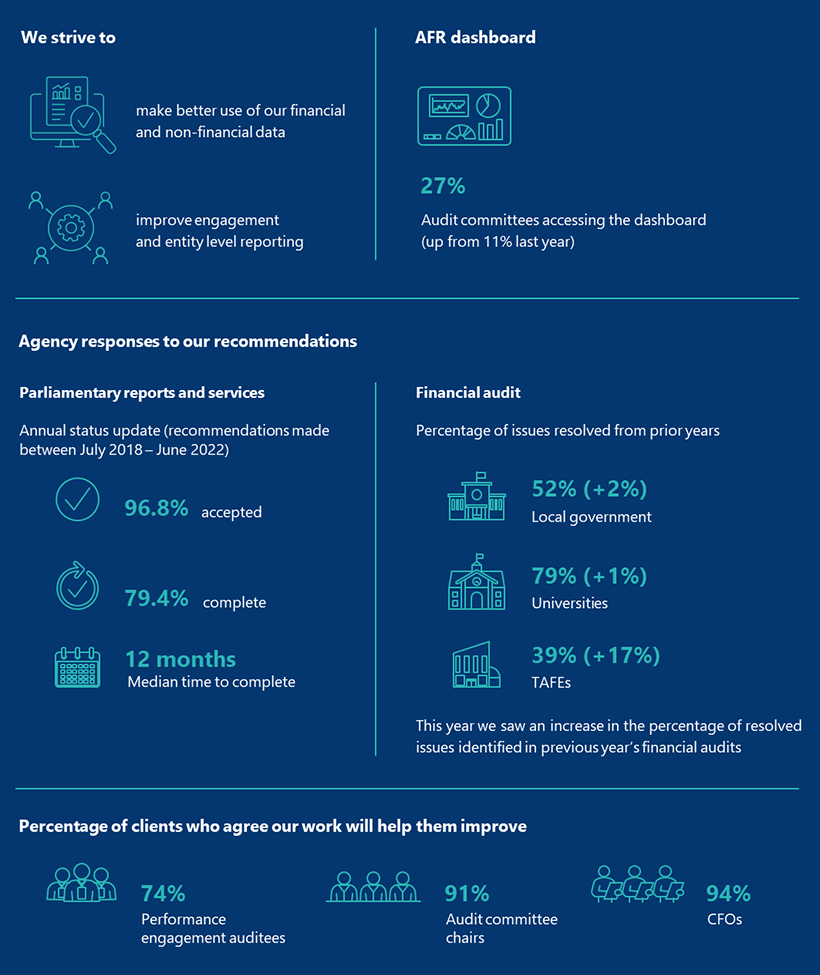
Updating our AFR dashboard
Expanding our AFR dashboard
We updated our 2023–24 AFR dashboard to include 2024–25 state Budget information for the first time this year.
We shared the updated dashboard on the same day the Budget was released to make it easier for Victorians to digest the information.
Our dashboard allows stakeholders to compare historical information with actual results and see the projected budget and forecast information in real time alongside the tabled Budget.
View our dashboard on our website: https://www.audit.vic.gov.au/dashboards/updated-2024-25-state-budget-dashboard
Figure 23: AFR dashboard updated for the 2024–25 state Budget

Source: VAGO.
Audit committee chairs using our AFR report
Increasing popularity of our report on the AFR
Through our annual satisfaction survey, we asked the chairs of our clients’ audit committees if they had considered our financial audit parliamentary reports.
In 2023–24, 27 per cent of audit committee chairs who responded to our survey said their committee considered our most recent Auditor-General’s Report on the Annual Financial Report of the State of Victoria, compared to 11 per cent in our 2022–23 survey.
Figure 24: Percentage of audit committee chairs who considered our most recent report on the AFR

Source: VAGO.
Our annual Fair Presentation of Service Delivery Performance report
Improvements to measuring and reporting service delivery
Each year we assess if Victorian Government departments fairly present their service delivery performance in Budget Paper No. 3: Service Delivery (BP3). We annually report our findings in our Fair Presentation of Service Delivery Performance reports.
In November 2023 we tabled our Fair Presentation of Service Delivery Performance 2023 report.
In response to our recommendations in these reports, the Department of Energy, Environment and Climate Action (DEECA) made 6 changes to the measures in its performance statement for
2024–25. These changes included:
- renaming one measure for simplicity
- proposing to discontinue 5 other measures because:
- 2 were related to activities that DEECA has no control over
- one related to DEECA’s core governance and compliance activities
- one duplicated reporting under DEECA’s objective indicators
- one needed to be converted into a new DEECA objective indicator.
Improving internal controls
Agencies’ response to financial audit recommendations
Our financial audits have helped agencies improve their internal controls this year.
Part of our financial audit process is to send management letters to agencies. These letters highlight internal control weakness and other matters we identify during our audits and make
recommendations to resolve them. Agencies respond to these letters with their intended actions.
In 2023–24 we saw an improvement in the percentage of internal control issues entities resolved from prior years:
- Local government entities resolved 52 per cent of prior-period issues (compared to 50 per cent in 2022–23).
- TAFEs resolved 39 per cent (compared to 22 per cent in 2022–23).
- Universities resolved 79 per cent (compared to 78 per cent in 2022–23).
Figure 25: Percentage of resolved issues from prior years by sector from 2019 to 2023

Source: VAGO.
Our annual Responses to Performance Engagement Recommendations report
How agencies responded to performance engagement recommendations
Each year we survey agencies about their progress on recommendations from our performance engagements.
Agencies are not required to accept, complete or publicly report on our recommendations. So we use our assurance review powers to provide greater transparency and accountability to the Victorian public and MPs.
We tabled our report Responses to Performance Engagement Recommendations: Annual Status Update 2023 in August 2023. The report outlines the status of 1,518 recommendations we made across 100 agencies in 77 performance engagement reports tabled between 1 July 2018 and 30 June 2022. We found:
- 96.8 per cent of recommendations were accepted (1,469 recommendations)
- 79.4 per cent of the accepted recommendations were completed (1,166 recommendations)
- the median time to complete a recommendation was 12 months
Figure 26: Status of accepted recommendations by tabled year
| 2018–19 | 2019–20 | 2020–21 | 2021–22 | Total | |
|---|---|---|---|---|---|
| Complete | 504 (89%) | 239 (92%) | 219 (68%) | 204 (64%) | 1,166 (79%) |
| In progress | 65 (11%) | 20 (7.7%) | 100 (31%) | 115 (36%) | 300 (20%) |
| Not started | - | - | 1 (0.3%) | 2 (0.6%) | 3 (0.2%) |
Source: VAGO.
How our work helps our clients improve
What our clients are telling us
We want our clients to value our work so it makes an impact.
As part of our client satisfaction surveys we ask our auditees if our work will help them improve.
In 2023–24, 91 per cent of audit committee chairs and 94 per cent of CFOs either agreed or strongly agreed that our recommendations will improve their organisation’s financial management and internal controls.
When we surveyed our performance engagement auditees 74 per cent either agreed or strongly agreed that our performance engagement will help them improve the audited activity.
Figure 27: Percentage of surveyed audit committee chairs, CFOs and performance engagement auditees who said our work help them improve in 2023–24

Source: VAGO.
5. An enriched experience for our people
Our people are central to us achieving our purpose and delivering quality outcomes. We aim to attract and retain talented and committed people by:
- providing professional development and career growth
- equipping them with technology, methodology and accessible workspaces
- supporting them to be highly productive and positively engaged.
Our people
Our workforce
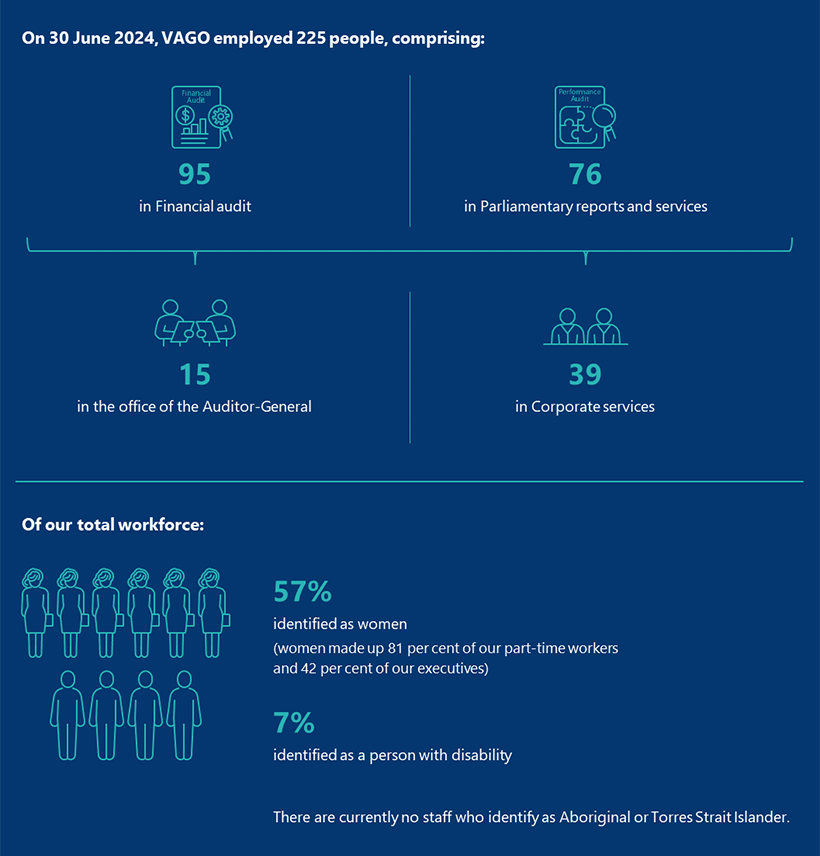
On 30 June 2024 VAGO employed 225 people, including:
- 95 in FA
- 76 in PRS
- 54 in audit support, including:
- 15 in OAG
- 39 in CS.
Of our total workforce:
- 57 per cent identified as women (women made up 81 per cent of our part-time workers and 42 per cent of our executives)
- 7 per cent identified as a person with disability.
There are currently no staff who have disclosed they identify as Aboriginal or Torres Strait Islander.
See Appendix B for a detailed profile of the VAGO workforce.
How we invest in our people
Capability frameworks
In 2023–24 we launched our capability frameworks for FA and PRS.
We developed these frameworks to support our people in their daily work and help them:
- understand common capability requirements and ways of working
- take ownership of their career pathways, learning and development.
Each framework clearly:
- delineates between Victorian public sector grades and roles
- aligns to relevant job descriptions
- leverages professional audit and accounting requirements and best practice.
Figure 28: Overview of the FA capability framework
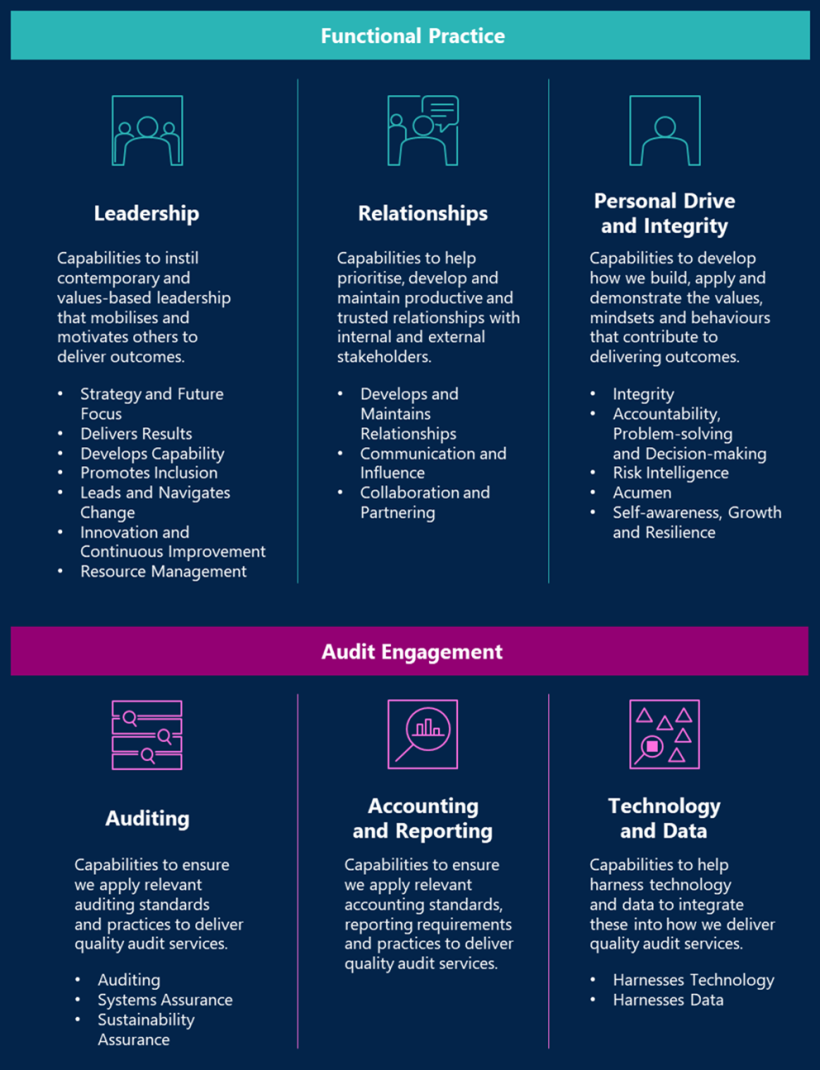
Source: VAGO.
Figure 29: Overview of the PRS capability framework
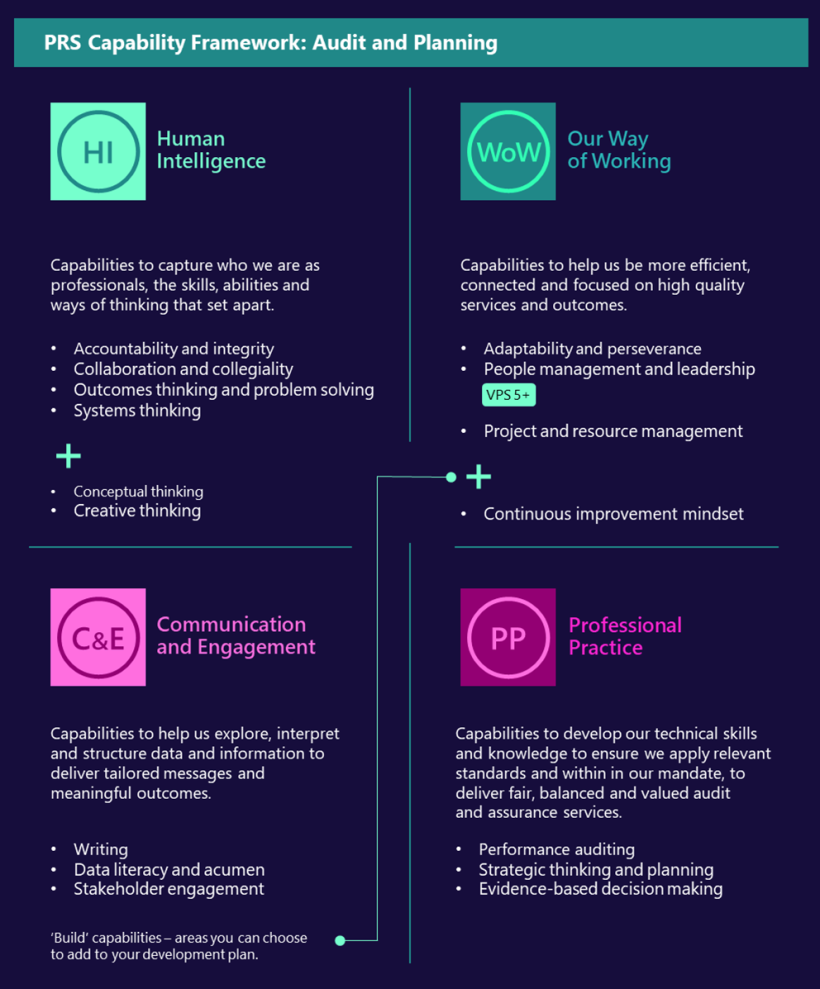
Source: VAGO.
In 2024–25 we plan to further enhance professional development and career growth for our people by prioritising the following initiatives:
- connecting individuals’ development plans to our capability frameworks and performance outcomes
- further optimising the tools and systems our people use
- designing and implementing:
- a succession management framework
- an enterprise learning platform.
System of quality management
The Audit Act 1994 requires us to apply AUASB’s standards where they are relevant to us.
In line with the new audit quality standards, we replaced our quality control framework with a new system of quality management.
Our new system, which we launched in November 2023, aims to enhance the robustness of our approach to quality.
Figure 30: Overview of our system of quality management

Note: SQM stands for system of quality management.
Source: VAGO.
We annually evaluate our system of quality management. This involves incorporating our audit inspection programs and considering results from independent reviews.
You can learn more about our system of quality management and the results of our evaluations in our annual transparency report: https://www.audit.vic.gov.au/transparency-report.
PRS professional practice and development
This year we established and resourced a branch in PRS to identify and develop the tools, guidance and development our people need to deliver high-quality engagements that inform Parliament and the community and are in accordance with relevant standards.
This year we:
- designed and launched a new approach to performance development plans
- developed and launched a monthly community of practice
- established ‘tutorial Tuesdays’ to support PRS staff to learn more about how the government works.
We are also comprehensively reviewing and updating our engagement methodology and the associated tools, guidance and manuals. We will progressively launch the updated tools and documents over 2024–25.
Financial audit toolset
We are transitioning our in-house audits to a new cloud-based financial audit toolset in stages:
- In 2024 33 per cent of in-house audits will be transitioned to the new system.
- By the end of the 2024–25 audit cycle 84 per cent of in-house audits will use the new system.
- The remaining in-house audits will transition in the 2025–26 audit cycle.
The new toolset is designed to make our audits more efficient and streamlined. Key functionalities include:
- integrated client communication: our auditors and clients can collaborate directly within the tool, with all responses automatically linked to the relevant audit tasks
- streamlined workflow: uploading trial balances and creating lead sheets is easier, which speeds up key audit tasks
- Empower 2.0 integration: leveraging the power of our in-house analytics platform directly within the audit toolset enables a more data-driven approach
- enhanced visibility: granular control over visibility settings enables auditors to tailor audit procedures to specific engagements
- embedded methodology: tasks are aligned with the latest guidelines, ensuring our audits meet public sector audit best practices.
Empower
In 2023–24 we launched Empower 2.0, which is an upgraded version of our in-house analytics platform that supports our audits of financial reports.
We first introduced Empower 1.0 in November 2019 for approximately 50 audits. Since then, our client base has grown to 72 audits. Our platform now manages about 20 billion records.
In 2023 we embarked on a significant project to completely rebuild Empower. We focused on better data protection, faster performance and a smoother user experience.
We fully launched Empower 2.0 in April 2024. It gives auditors the raw data and pre-constructed analysis they need to conduct audits more efficiently and effectively.
This latest version positions us to expand our analytics platform further and accommodate new clients.
We are excited about the opportunities Empower 2.0 offers.
Ways of working
We have continued to refine and embed our ways of working. Our approach combines the best of office based, client site and virtual work – being purposeful when we come together.
Some of the initiatives we refined or introduced to further improve our approach are:
Together–Together days and strategic collaboration activities
- virtual and in-person coffee catch-ups
- learning and development experiences
- returning to more client site visits
- peer networks
- Q and A drop-in sessions.
Declaration in the Performance Statement
In our opinion, the measures used and results reported in the accompanying performance statement of the Victorian Auditor-General’s Office in respect of the 2023–24 financial year are presented fairly, and are consistent with the Standing Directions under the Financial Management Act 1994.
The statement includes the 2023–24 performance measures agreed with the Treasurer as set out in Budget Paper No. 3, actual and comparative results achieved for the financial year against targets where applicable, and explanations of any significant and/or material variance between the actual results and performance targets.
As at the date of signing, we are not aware of any circumstance which would render any particulars in the performance statement to be misleading or inaccurate.
We authorise the attached performance statement for issue on 3 September 2024.
Dave Barry
Deputy of the Auditor-General
Victorian Auditor-General’s Office
Melbourne
3 September 2024
Anh Ha
Chief Financial Officer
Victorian Auditor-General’s Office
Melbourne
3 September 2024
6. Performance statement
7. Our financial management
Appendix A: Reconciliation of parliamentary report program
Download a PDF copy of Appendix A: Reconciliation of parliamentary report program.

Download Appendix A: Reconciliation of parliamentary report program
Appendix B: Workforce profile and gender pay gap
Download a PDF copy of Appendix B: Workforce profile and gender pay gap.
Appendix C: Workplace health and safety
Download a PDF copy of Appendix C: Workplace health and safety.
Appendix D: General executive information
Download a PDF copy of Appendix D: General executive information.
Appendix E: Audit and risk management
Download a PDF copy of Appendix E: Audit and risk management.
Appendix F: Policies and procedures
Download a PDF copy of Appendix F: Policies and procedures.
Appendix G: Additional information available on request
Download a PDF copy of Appendix G: Additional information available on request.
Download Appendix G: Additional information available on request