Efficiency and Effectiveness of Hospital Services: High-value Equipment
Overview
This audit examined the efficiency and cost-effectiveness of managing high-value Computed Tomography (CT) and Magnetic Resonance (MR) scanners in public hospitals. We found that these imaging services are not being managed economically, efficiently or effectively across Victoria.
The cost-effectiveness of delivering CT and MR imaging services varies widely across health services. Some CT and MR imaging services operate at a profit while others incur losses in the millions each year. In its central procurement role, Health Purchasing Victoria could assist health services to achieve the best value when purchasing CT and MR imaging services.
Health services are currently unable to compare their CT and MR scanner economy and efficiency with that of other health services. This makes it difficult for health services, and the Department of Health and Human Services as the manager of Victoria’s health system, to know whether this costly imaging equipment is being used efficiently.
The department does not include imaging services in its planning. Health services' planning for and management of imaging equipment over the medium to longer term is poor. Without informed planning at the department and health-service level, there is a risk that patients will not be able to access CT and MR scanners in close proximity to them, in a timely way, and without incurring additional costs.
Efficiency and Effectiveness of Hospital Services: High-value Equipment: Message
Ordered to be published
VICTORIAN GOVERNMENT PRINTER February 2015
PP No 8, Session 2014–15
President
Legislative Council
Parliament House
Melbourne
Speaker
Legislative Assembly
Parliament House
Melbourne
Dear Presiding Officers
Under the provisions of section 16AB of the Audit Act 1994, I transmit my report on the audit Efficiency and Effectiveness of Hospital Services: High-value Equipment.
The audit examined the efficiency and cost-effectiveness of managing high-value imaging equipment—specifically computed tomography (CT) and magnetic resonance (MR) scanners—in public hospitals. It also assessed whether planning at the hospital and state level for high-value imaging equipment is effective.
I found that public health services are not managing CT and MR scanners efficiently or cost-effectively. There is substantial variation in the utilisation of these services, including number of scans per day and wait times. Planning undertaken by health services at the hospital level is inadequate, and the Department of Health and Human Services does not include imaging services in its planning at the state level. I cannot be assured that CT and MR scanners are being used optimally or that the state is well positioned to meet future demand.
Yours faithfully

John Doyle
Auditor-General
25 February 2015
Auditor-General's comments
 John Doyle Auditor-General |
Audit team Michele Lonsdale—Engagement Leader Michael Herbert—Team Leader Engagement Quality Control Reviewer Renee Cassidy |
In Victoria, as in other jurisdictions, there is growing demand for the latest medical technology to diagnose and treat disease. We want access to medical equipment that will tell us promptly the nature of our illness or injury, and how this will be treated. And while technological advances are improving diagnosis and treatment, they are also increasing the costs of healthcare.
This audit focused on two of the most expensive pieces of equipment—computed tomography (CT) and magnetic resonance (MR) scanners. Given that these machines cost around $1 to $3 million to purchase and demand is increasing, I want to know whether Victorians are getting value for money at a time when health costs are absorbing an increasing proportion of our State Budget.
In this audit I examined the efficiency and cost-effectiveness of managing high‑value CT and MR scanners in public hospitals. I also assessed whether planning at the hospital and state level for high-value imaging equipment can effectively meet growing demand.
I found that public CT and MR imaging services are not being managed economically, efficiently or effectively across Victoria.
In particular, I found great variation across public hospitals. Some CT and MR imaging services operate at a surplus—in one case, up to $2 million a year—while others incur losses in the millions each year. There is also considerable variation in how many scans are being done per day in different hospitals and how long people have to wait for a scan. It is concerning that one hospital can have a wait list of up to 98 days for an MR scan while the waiting time in a hospital less than 10 kilometres away is only two days. This is not making best use of costly resources.
I found that some public patients do not have the same access to publicly-owned and funded CT and MR scanners as others. Residents of Melbourne's northern and western suburbs face double the wait times for an MR scan as those in the south—and two regional centres do not have free public outpatient imaging services. Where patient access to publicly funded scanning services is limited, they may need to travel further, or pay out of pocket expenses, to receive the same service privately.
Hospitals are not able to compare the efficiency and economy of their scanners. Without the data that would enable this comparison it is difficult for health services and the Department of Health and Human Services to know whether costly imaging equipment is being used efficiently.
In its role as manager of the health system in Victoria, the department does not consider imaging services in its planning. This is despite the increasingly heavy reliance on imaging services for diagnosis and treatment. The department does not collect key information on medical imaging equipment—such as the location, number and associated costs across the state—or on services provided—such as wait times. Yet without this knowledge how can Victorians be assured that imaging services such as CT and MR scanners will be available to meet future demand or that we are obtaining value for money from existing services?
Health Purchasing Victoria (HPV) was set up to assist health services in value‑for‑money procurement of equipment and services. This audit found that more could be done by HPV to assist health services in the procurement of CT and MR scanners.
This report contains eight recommendations which, if implemented, will help health services better utilise these expensive assets and the department to gain a better understanding of future demand.
I intend to revisit this audit to determine whether and how health services, HPV and the department have addressed these recommendations.
I want to thank the staff in the Department of Health and Human Services, HPV and the audited health services for their constructive engagement with the audit team throughout the audit.

John Doyle
Auditor-General
February 2015
Audit Summary
Public health services routinely use computed tomography (CT) and magnetic resonance (MR) scanners to diagnose, manage and treat medical conditions. These scanners take high-quality images of internal organs and tissues. They are now critical to clinical decisions at key points in a patient's treatment, and can significantly influence patient outcomes.
CT and MR scanners are two of the most expensive pieces of medical equipment in hospitals, with CT scanners costing between $1 and $2 million and MR scanners costing between $1.5 and $3 million. These machines also represent a considerable financial risk for hospitals due to their short life cycle of seven to 10 years, excluding major upgrades, and their high replacement and maintenance costs—up to $180 000 or more annually.
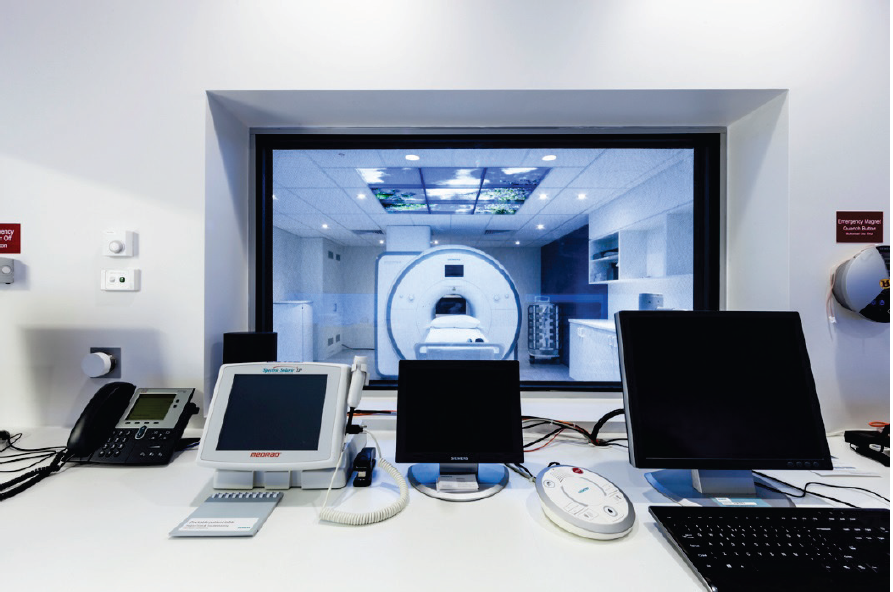
MR Scanner. Photograph supplied by Alfred Health Radiology.
The Department of Health and Human Services (the department) is responsible for the planning, policy development, funding and regulation of health service providers. The health service boards and chief executive officers are accountable to the Minister for Health for their organisation's performance—including the provision of imaging services and utilisation of associated equipment.
Health Purchasing Victoria (HPV) is the central procurement agency for the public hospital sector. It has a mandate to achieve 'best value' outcomes in the procurement of health-related goods, services and equipment, including imaging equipment.
Informed planning at a state and health-service level is important if growing demand for these expensive imaging services is to be met in an efficient and cost-effective manner.
This audit examined the effectiveness and efficiency of planning, delivery and utilisation of high-value imaging equipment in Victorian public hospitals.
This audit was commenced under the Department of Health. On 1 January 2015, machinery-of-government changes took effect and the responsibilities of the former Department of Health transferred to the Department of Health and Human Services.
Conclusions
Public CT and MR imaging services are not being managed economically, efficiently or effectively across Victoria.
There is no system-wide planning for high-value imaging equipment. The department does not forecast future demand or coordinate the approach to managing demand for CT and MR imaging services at a time when demand is growing rapidly. Health services' planning for, and management of, imaging equipment over the medium to longer term is poor. Without informed planning at the department and health-service level, there is a risk that patients will not be able to access CT and MR scanners in close proximity to them, in a timely way, and without incurring additional costs.
The cost-effectiveness of delivering CT and MR imaging services varies widely across health services. Some CT and MR imaging services operate at a surplus while others incur losses in the millions each year. Health services should be proactively reviewing their options to enable the provision of cost-effective imaging services. In its central procurement role, HPV could assist health services to achieve the best value when procuring CT and MR imaging services. To date it has prioritised achieving best value for other categories of complex medical equipment rather than imaging equipment.
Health services cannot compare their CT and MR scanner economy and efficiency with that of other health services and almost half do not collect sufficient information to even benchmark internally. This means that it is not possible for health services management, or the department as health system manager, to know whether costly imaging equipment is being used efficiently. There are opportunities for health services to increase scanner availability and patient throughput—that is, the number of patients being moved through the scanning process—with improved planning at state, health-service and hospital levels.
Findings
Inadequate planning
The department does not consider imaging services in its planning. This is despite major health-service streams—including cancer, cardiology and neurology—being imaging resource intensive. The department does not collect key information on medical imaging equipment—such as the location, number and associated costs across the state—or on services provided—such as wait times.
Because it does not collect this information, its decisions about funding for imaging services are made without any understanding of the potential competing needs for imaging equipment in other locations or of nearby oversupply, which has led to much longer waiting times for imaging services in some areas compared with others.
The Medical Equipment Replacement Program is the department's program for funding replacement CT and MR scanners. However, the process used by the department to assess competing bids for funds is not clear and it does not clearly document its decisions.
Analysis of nine business cases submitted under the Medical Equipment Replacement Program, or developed for internal health service use only, revealed significant shortcomings:
- none reviewed the efficiency of existing scanners to see whether another scanner might not be needed
- none considered all the available options to deliver the imaging service
- business cases were not generally forward looking—all public health services provide evidence of current service demands, however, only two of the business cases forecast future demand
- benefits were not consistently quantified making it difficult to know what to hold the health service to account for.
Poor medical equipment asset management practices in public health services exacerbate a lack of planning at the health-system level. None of the six public health services visited had an asset management plan that included imaging equipment. The health services could not communicate to the department—or clearly identify—what their future imaging needs would be over the medium to longer term.
This means that although future demand is set to increase, it is not clear at either the health-system or health-service level how that demand might best be met.
Access to MR and CT scanners
Informed planning at a health-system level is important in making sure that patients have good geographical and timely access to CT and MR scanners. The available data suggests that some metropolitan regions and regional centres do not have the same access to publicly-owned and funded CT and MR scanners as others. Where patient access to publicly-funded scanning services is limited, they may need to travel further or pay out-of-pocket expenses to receive the same service privately.
MR scan wait times vary considerably between health services, with the longest taking three months. Residents of Melbourne's northern and western suburbs face double the wait times for an MR scan as those in the south, and two regional centres do not have free public outpatient imaging services.
Better coordination between public health services could reduce outpatient MR scan wait times and better utilise nearby MR scanners.
Unlike MR scans, the demand for CT scans is being met. CT wait times vary from zero to seven days.
The department does not collect information on the location of publicly-funded CT and MR scanners or privately-operated scanners in Victoria.
Value-for-money imaging services
Health services do not always acquire CT and MR imaging services at the best possible price. Imaging is one of the few areas within a health service that can generate revenue over and above its annual operating budget.
Analysis of 2012–13 financial data from six audited public health services shows substantial variation in the comparative profitability of imaging services. In 2012–13 the provision of CT imaging services ranged from an annual surplus of $2 million in one of the audited health services to an annual loss of almost $3 million in another. The surplus of public MR imaging services in the same year ranged from around $1 million to a loss of $2.4 million. This variation does not reflect the size of the imaging service.
These significant differences in the costs and profitability of CT and MR imaging services across the six hospitals suggest substantial scope to improve how these services are delivered, and at what cost.
The capacity of health services to consider and evaluate all options for service delivery can be limited by their existing delivery model. For instance, one audited public health service is in a long-term leasing arrangement that precludes the use of other equipment until the lease is completed.
High variability in CT and MR utilisation
Due to the high capital, maintenance and operating costs, health services need to utilise CT and MR scanners to the fullest extent. There is considerable variation in utilisation rates within and across health services, and utilisation data is not analysed sufficiently to inform efficiency improvements.
While variation can be explained in part by clinical decision-making, patient type, hospital specialisation, the level of demand and the availability of scanners at a given health service, these factors alone do not sufficiently explain the variability in scanner utilisation across the state.
Health services do not routinely compare their scanner efficiency within their own facilities or benchmark utilisation against other health services. This means health service managers and the department cannot know whether costly imaging equipment is being used optimally.
As part of this audit, all major Victorian health services—13 metropolitan and six regional—were requested to submit data from their radiology information systems. Four large health services could not submit utilisation data to VAGO of sufficient integrity to enable analysis. It is therefore questionable whether these health services could report accurately to senior management on their own use of their CT and MR scanners. A further four health services could not provide this data at an individual machine level, despite all the radiology information systems being capable of doing so. Overall, the audit found that almost half—42 per cent—of all major health services cannot accurately determine utilisation or compare the efficiency of the scanners they manage.
Health services do not always maximise the availability of CT and MR scanners. While there are some instances of high availability, other scanners could be open for longer hours during the week and weekend. This is especially true for MR scanners, with an average wait time for outpatients at 30 days.
There are clearly opportunities for improvement. For example, one imaging service in a large metropolitan health service was able to turn around an annual loss of almost $3 million in 2007–08 to an annual surplus of just over $2 million in 2013–14, while also increasing patient throughput and reducing wait lists. It did so by reviewing its processes, identifying areas for improvement and implementing a series of reforms to improve patient scheduling. This demonstrates that there are significant financial and patient benefits to be gained from looking at how health services are delivering their imaging services.
Recommendations
That the Department of Health and Human Services:
- collects, analyses and uses key information on computed tomography and magnetic resonance imaging services to inform resource allocation decisions and better coordinate services across the state
- more rigorously and transparently assesses the proposals for funding submitted to its Medical Equipment Replacement Program, and clearly documents its decision‑making processes
- develops a shared referral system to better coordinate public health services' imaging departments and reduce wait times for public outpatient magnetic resonance scans.
That public health services:
- develop and apply medical equipment asset management practices consistent with Department of Treasury and Finance better practice guidelines
- review all available options for new and existing imaging services, as a priority, so that the purchase of computed tomography and magnetic resonance imaging services achieves the best value for money.
That Health Purchasing Victoria:
- assists health services to achieve the best value outcomes in the procurement of computed tomography and magnetic resonance imaging services.
That the Department of Health and Human Services:
- develops a data repository to enable public health services to understand and compare their computed tomography and magnetic resonance scanner utilisation.
That public health services:
- analyse and use key information about the utilisation of their own and other health services' computed tomography and magnetic resonance scanners to maximise utilisation.
Submissions and comments received
We have professionally engaged with the Department of Health and Human Services, Health Purchasing Victoria and a selection of six public health services throughout the course of the audit. In accordance with section 16(3) of the Audit Act 1994 we provided a copy of this report to those agencies and requested their submissions or comments.
We have considered those views in reaching our audit conclusions and have represented them to the extent relevant and warranted. Their full section 16(3) submissions and comments are included in Appendix C.
1 Background
1.1 Introduction
Imaging services are increasingly being used to diagnose and treat medical conditions in our public health system.
Two of the most commonly used pieces of imaging equipment are computed tomography (CT) and magnetic resonance (MR) scanners. CT and MR scanners represent two of the costliest pieces of medical equipment in hospitals with an initial cost between $1 and $2 million for a CT machine and $1.5 and $3 million for an MR machine. They also have a relatively short life cycle of seven to 10 years—excluding major upgrades—and high maintenance costs of between $90 000 and $180 000 per machine each year.
1.1.1 Medical imaging
Medical imaging, or radiology, is central to health care because of its critical role in diagnosis, treatment and patient management. Modern medical imaging uses a range of technology and equipment—such as imaging software and scanners—to detect tissue and organs and assess underlying medical conditions that are not able to be seen in any other way. Types of medical imaging include:
- CT
- MR
- 'plain film' X-ray
- fluoroscopy
- angiography
- ultrasound
- nuclear medicine—including positron emission tomography (PET)
- hybrid scanners.
An effectively managed imaging service enables timely identification and treatment of medical conditions and supports efficient patient flow through a health service. Imaging services are widely used in public and private hospitals and our reliance on this equipment for diagnostic and treatment purposes is steadily growing.
Figure 1A illustrates how scans are typically performed.
Figure 1A
Typical scanning process

Source: Victorian Auditor-General's Office.
1.1.2 Growth in demand
There are no data on the total number of scans performed on public patients in Victoria or Australia. In the absence of more holistic data, Medicare data has been used as a proxy indicator. Medicare data on outpatients alone indicates that over the past decade MR has become the fastest growing imaging service in Victoria and Australia, with 235 370 outpatient MR scans performed in Victoria during 2013–14, compared with 81 812 in 2004–05. This represents a 188 per cent increase, with an annual average growth of around 10 per cent. Over the same period, the number of outpatient CT scans in Victoria increased from 355 630 to 641 460—an increase of 80 per cent. The data does not show what proportion of this growth occurred in public health services as opposed to services provided by the private sector. Figure 1B shows medical imaging services, excluding in-patient scanning and non-rebatable procedures, between 2004–05 and 2013–14.
Figure 1B
Medical imaging between 2004–05 and 2013–14 based on Medicare data
|
Imaging service |
Increase from 2004 (per cent) |
Total number of scans 2013 (Medicare outpatients) |
|---|---|---|
|
MR |
187.7 |
235 370 |
|
Ultrasound |
103.1 |
2 147 614 |
|
CT |
80.4 |
641 460 |
|
Nuclear medicine imaging |
68.1 |
137 660 |
|
Diagnostic radiology |
32.5 |
2 544 498 |
Source: Victorian Auditor-General's Office based on Medicare online data.
In 2011, the Commonwealth Department of Health and Ageing Review of Funding for Diagnostic Imaging Services: Final Report reported a sustained increase in the demand for imaging services over the past 20 years. In the latest year reported, 2009–10, imaging services accounted for $2.15 billion—13.9 per cent—of all Medicare expenditure.
The growth in demand for CT and MR imaging services has been driven by several factors, including rapid technological advancement—which has broadened the clinical scope of these scanners—an ageing population with often chronic and complex medical needs, and an increase in the ease and speed of undertaking scans.
1.2 CT and MR scanners
The respective functions, approximate costs, life cycles, strengths and limitations of CT and MR equipment are outlined in Figure 1C.
Figure 1C
Computed tomography and magnetic resonance scanning equipment
|
Computed tomography |
Magnetic resonance |
|
|---|---|---|
|
What it does |
|
|
|
How it works |
Uses X-rays and computer technology to create rapid cross-section images of the body. |
Uses a magnetic field and radio waves to build up cross-section images of the body. |
|
Approximate costs per scanner |
|
|
|
Life cycle of equipment |
Seven to 10 years, excluding major upgrades.* |
Seven to 10 years, excluding major upgrades.* |
|
Relative strengths and limitations |
|
|
Note: * In March 2014 the Australian Government Department of Health published updated capital sensitivity measures for diagnostic imaging equipment that extended the maximum effective life to 15 years for CT and 20 years for MR for upgraded equipment. These measures only apply to the eligibility of scanners attracting Medicare rebates, and do not define the effective life cycle of a CT or MR scanner.
Source: Victorian Auditor-General's Office.
Licensing of scanners
The Commonwealth Department of Health is responsible for Medicare, including the Medicare Benefits Schedule (MBS), which sets rebates for eligible medical procedures—including certain CT and MR scans. All CT scanners in public health services across the state are eligible for Medicare rebates for procedures listed in the MBS and do not need to be licensed.
MR scanners can be granted full or partial licences by the Commonwealth Department of Health, which affects the revenue each scanner can generate:
- Fully licensed MR scanners—18 of 30 in Victorian public health services—are eligible to claim rebates for all 189 MR procedures listed on the MBS.
- Partially licensed MR scanners—8 of 30 in Victorian public health services—are eligible to claim rebates for 24 MR procedures listed on the MBS.
- Unlicensed MR scanners—4 of 30 in Victorian public health services—cannot claim any MBS rebate.
Of the total 189 MR procedures or scans currently listed on the MBS, rebates range from $168 to $690 per MR scan. While public hospitals can apply for a partial or full MR licence, these applications are granted at the sole discretion of the Commonwealth.
1.3 Roles and responsibilities
1.3.1 Department of Health and Human Services
The Department of Health and Human Services (the department) is the state's health system manager, responsible for the planning, policy development, funding and regulation of health service providers. This includes monitoring the performance of health services and public hospitals on behalf of the Minister for Health.
Capital Projects and Service Planning
The Capital Projects and Service Planning division of the department leads statewide planning in addition to developing and delivering infrastructure for health services. It manages the Medical Equipment Replacement Program, which is a major public source of replacement funding for CT and MR imaging equipment.
Health Protection Branch
The Environmental Health Regulation and Compliance unit within the Health Protection Branch of the department oversees the licensing of radiation services and maintains an inventory of CT equipment across the state because CT scanners—unlike MR scanners—emit radiation.
1.3.2 Health Purchasing Victoria
Health Purchasing Victoria (HPV) is the central procurement agency for the public hospital sector. HPV has a mandate to assist health services achieve best-value outcomes in the procurement of equipment and services, including imaging equipment. Set up in 2001 under the Health Services Act 1998, it was established to improve public health system effectiveness by:
- facilitating public health service collaboration to get the best value in purchasing
- reducing inefficient duplication of functions, particularly in tendering
- improving purchasing practices by developing policies and practices.
1.3.3 Health services and public hospitals
In Victoria, health services are often large organisations that manage more than one public hospital and operate under a devolved governance model. This model is designed to allow local decisions to be made by the chief executive officer and board of a health service, including how best to deliver imaging services. Health services are accountable to the Minister for Health for their organisation's performance, including the utilisation of medical imaging equipment.
1.4 Legislative and policy context
The 2000 Department of Treasury and Finance's Sustaining Our Assets policy statement articulates the government's asset management planning strategy and provides principles to guide better practice. This policy is applicable to public health service imaging equipment.
There is no policy specific to medical imaging equipment or specific legislation for the efficient or effective operation of imaging equipment in Victoria. However, the Victorian Health Priorities Framework 2012–2022—the overarching government policy for the public health system at the time of the audit—sets out five key outcomes for the health system. Two of these outcomes reinforce the importance of efficient and cost-effective healthcare, including imaging services. These outcomes are that:
- care is clinically effective and cost-effective
- the health system is highly productive and health services are cost-effective and affordable.
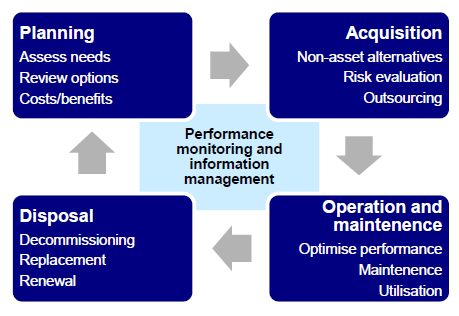
1.4.1 Medical Equipment Asset Management Framework
Developed in partnership between the department and health services, the Medical Equipment Asset Management Framework assists health services to manage their medical equipment assets according to government requirements. It gives guidance, principles and the stages of asset management, which are shown in Figure 1D.
Figure 1D
Key stages of medical equipment asset management
Source: Victorian Auditor-General's Office.
1.5 Complexity of CT and MR imaging services
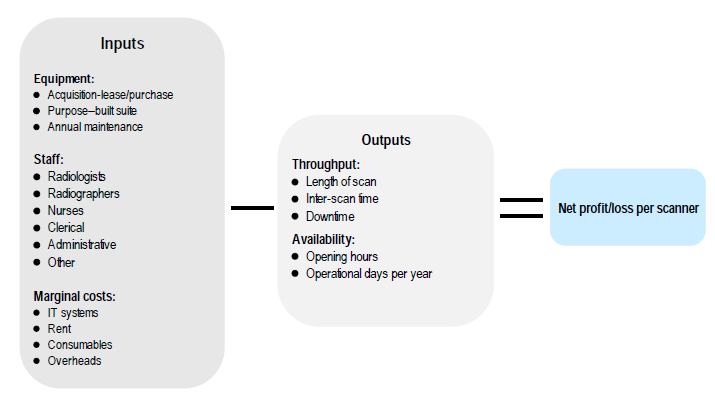
Health services can deliver CT and MR imaging services in a number of ways, including purchasing or leasing scanners for in-house use, outsourcing the service or a combination of options. Figure 1E illustrates some of the factors underlying these service delivery methods that can influence their profitability.
Figure 1E
Factors that can influence the profitability of CT and MR imaging services
Source: Victorian Auditor-General's Office.
As shown in Figure 1F, funding for CT and MR scanners comes from a range of sources—including the department, internally generated hospital funds, research funding or philanthropy. The department's Medical Equipment Replacement Program is a major source of capital funding for replacing high-value imaging equipment owned by hospitals.
Figure 1F
Funding sources for CT and MR scanners owned by Victorian health services, 2012–13
|
Funding source |
CT scanners |
MR scanners |
|---|---|---|
|
Health service |
9 |
8 |
|
Donation |
3 |
3 |
|
Donation and health service |
3 |
2 |
|
Department of Health and Human Services |
10 |
7 |
|
Total |
25 |
20 |
Note: One large metropolitan health service could not identify the funding source for an MR scanner purchased in 2003—this scanner is excluded.
Source: Victorian Auditor-General's Office from the baseline survey of all health services conducted in July 2014 and follow-up of those who own CT and MR scanners.
1.5.1 Medical Equipment Replacement Program
The department administers the Medical Equipment Replacement Program. In 2012–13, the $35 million program consisted of two funding streams—each allocated $17.5 million:
- Statewide replacement fund for equipment over $300 000—public hospitals submit bids to the department through a competitive process.
- Specific-purpose capital grants are allocated to replace critical at-risk medical equipment valued up to $300 000—high-value imaging equipment exceeds this threshold.
1.6 Audit objectives and scope
This audit examined the efficiency and effectiveness of the management of high-value imaging equipment in public hospitals. To determine this, the audit assessed whether:
- planning is appropriate to the cost and life cycle of high-value imaging equipment
- public hospitals use cost-effective options to access high-value imaging equipment for services
- public hospitals efficiently utilise high-value imaging equipment.
This audit focused on a number of metropolitan and large regional public health services where high-value imaging equipment is concentrated. It assessed the roles of the Department of Health and Human Services, Health Purchasing Victoria and health services.
This audit was commenced under the Department of Health. On 1 January 2015, machinery-of-government changes took effect and the responsibilities of the former Department of Health transferred to the Department of Health and Human Services.
In this audit:
- 'Effectiveness' refers to the cost-effectiveness or economy of imaging service delivery. It includes examining if hospitals assess different service delivery options—such as procurement, leasing and outsourcing—and how these models influence the cost per scan.
- 'Efficiency' refers to the technical efficiency of CT and MR scans. This is a measure of how efficiently a patient is processed through a scan and the number of scans conducted in a given time frame.
- 'High-value imaging equipment' means CT and MR imaging equipment, including the external computing components, associated software and purpose-built facilities.
Other less expensive or less widely used modes of imaging—such as ultrasound, X‑ray and positron emission tomography (PET) scanners—are excluded from this audit. The adequacy and efficiency of the workforce used to operate and interpret results from imaging equipment have also been excluded from the audit.
1.7 Audit method and cost
The audit methodology involved the following methods:
- document review of departmental program and policy documents, academic literature and other data sources—including the Medicare Benefits Schedule, a selection of health service business cases, and asset management planning documentation
- baseline survey of 83 public hospitals and health services
- data analysis of radiology information systems data from 15 health services
- interviews with Victorian and interstate health department officials
- site visits to six metropolitan and regional health services, including interviews with radiology unit representatives, clinical and executive staff, and observation of imaging department facilities and equipment.
The methodology and approach used is detailed in Appendix A. The audit was performed in accordance with the Australian Auditing and Assurance Standards. Pursuant to section 20(3) of the Audit Act 1994, unless otherwise indicated, any persons named in this report are not the subject of adverse comment or opinion.
The total cost of the audit was $400 000.
1.8 Structure of the report
This report is structured as follows:
- Part 2 examines the adequacy of state and health-service level planning to meet demand for CT and MR scanning services
- Part 3 examines whether value-for-money imaging services are being provided
- Part 4 assesses the utilisation of CT and MR scanners within and across hospitals in Victoria.
2 Planning for high-value equipment
At a glance
Background
Informed planning at a state and health-service level is important to meet growing demand for computed tomography (CT) and magnetic resonance (MR) imaging services.
Conclusion
There is a lack of understanding and coordination of CT and MR imaging services at the state level. The Department of Health and Human Services (the department) does not forecast demand for imaging services or identify how best to meet the growing demand for these. Audited health services are not meeting government asset management guidelines for their existing CT and MR scanning equipment. Medium- to longer-term planning is absent. This has contributed to some areas of Melbourne and regional Victoria having poorer access to MR scans.
Findings
- The department does not collect key information on medical imaging equipment, or on associated services provided, such as wait lists.
- The department does not assess proposals submitted to its Medical Equipment Replacement Program using clear criteria, or document its decisions.
- The audited health services had no medical equipment asset management plans.
Recommendations
That the Department of Health and Human Services:
- collects and uses key information on CT and MR imaging services to inform resource allocation and better coordinate services
- develops a shared referral system to better coordinate public health services' imaging departments and reduce wait times for public outpatient MR scans.
That public health services develop medical equipment asset management practices consistent with Department of Treasury and Finance better practice guidelines.
2 Planning for high-value equipment
2.1 Introduction
A thorough understanding of demand for computed tomography (CT) and magnetic resonance (MR) services across the state is needed to inform resource decisions that support timely and equitable access to these services.
2.2 Conclusion
The Department of Health and Human Services (the department) does not collect and analyse the necessary information on imaging services—such as the number, location and associated costs of scanners across the state—or monitor service demand. It does not forecast demand for imaging services or identify how best to meet this demand at a time when demand is growing rapidly.
While health services have a role in helping to identify demand and ways of managing this locally, their role is diminished through poor imaging equipment asset management planning. Audited health services are not meeting government expectations for asset management for their existing CT and MR scanning equipment. Medium- to longer-term planning—which is important for expensive scanning equipment requiring major upgrade or replacement every seven to 10 years—is absent. Without robust information to inform resourcing decisions at the department and health-service level, inequitable access to imaging services is inevitable. This is the case for access to MR scanning equipment, for which there is considerable variation in wait times, from zero days to three months in metropolitan Melbourne.
2.3 Absence of system-level understanding of imaging services
The department does not understand or consider imaging services at the state level. It does not collect and analyse key imaging information and apply this to service and capital planning decisions. This is despite there being several reasons why they should:
- CT and MR scanners bear a significant capital cost in a rapidly changing technological environment. A strategic approach to equipment replacement and purchasing over the medium and longer terms is particularly important so that the number and locations of scanners are appropriate for service needs.
- There is rapidly increasing demand for imaging services generally, and CT and MR scans in particular. In the past decade Medicare data shows that demand for MR services has increased by 188 per cent—it is currently the fastest growing imaging type in Victoria and Australia. CT is the third fastest growing imaging type with an 80 per cent increase in demand over the same period. The 2009 Commonwealth Review of Funding for Diagnostic Imaging Services: Final Report expects such trends to continue and possibly intensify.
- MR and CT images are now driving clinical decisions at key points in a patient's treatment. Access to CT and MR scanners can improve patient flow. Based on a scan, for example, surgery may be scheduled or delayed, or a patient may be discharged or moved from an Intensive Care Unit to a ward providing less acute care. Executive directors from all audited public health services reinforced the increasingly central role that MR and CT imaging services play in public health services.
The department uses an inpatient model to forecast demand for health service inpatient and emergency services. This inpatient model takes into account the average length of stay, and the number of health service beds needed across the state. This model does not forecast the needs related to medical equipment and does not capture trends in demand for CT and MR imaging services. This is despite major health service streams—including cancer, cardiology and neurology—being imaging resource intensive. This model also fails to take into account that almost half—48 per cent—of all demand on public health service CT and MR scanners comes from outpatients.
The department does not know the total cost of CT and MR imaging services across Victorian public health services or whether CT and MR imaging services are consuming an increasing proportion of health services' budgets. The relevant department branch responsible for asset and infrastructure planning within the department—Capital Projects and Service Planning—does not know the number, location or specifications of CT and MR scanners in Victoria. However, this information is fundamental to making sound resource allocation decisions, and the lack of such information limits the department's ability to do so.
2.4 Medical Equipment Replacement Program
The Medical Equipment Replacement Program (MERP) is the department's program for funding replacement CT and MR scanners. There are 25 CT and 20 MR scanners owned by public health services—of these, between 17 and 38 per cent have been funded by the department. The process used to assess the funding of equipment is neither clear nor robust.
Health services submit business cases to the department through a competitive process for the replacement of existing, owned equipment. It is not clear how the department assesses competing bids—for example, a scanner at one health service versus another, or against a different piece of medical equipment, such as an X-ray machine. There is little transparency around the department's decision‑making. These decisions are also made in the absence of any understanding of potential competing needs for imaging equipment in other locations or any nearby oversupply.
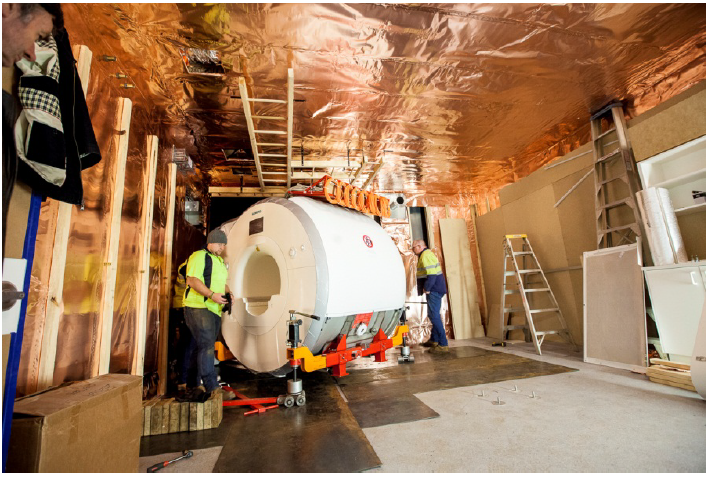
Installation of an MR scanner. Photograph supplied by Alfred Health Radiology.
2.4.1 CT and MR scanner business cases
We reviewed nine MR and CT business cases from seven health services, developed between 2007 and 2014. None of the business cases addressed all the criteria detailed in the Australian National Audit Office 2010 Better Practice Guide on the Strategic and Operational Management of Assets by Public Sector Entities or in the department's Medical Equipment Asset Management Framework's business case guidelines. Business case criteria include:
- an outline of how equipment will meet current and future service demands
- evidence of service demands
- alignment with hospital objectives
- consideration of all options—leasing, purchasing, upgrading, outsourcing the service or 'do nothing'
- a comparison of the costs, benefits and risks of included options
- the inclusion of life-cycle costs—equipment, staff, consumables and other costs
- utilisation targets
- an outline of the rationale for the preferred option
- quantification of benefits.
Four of the business cases were submitted under, and received funding from, MERP, which requires health services to be compliant with the Medical Equipment Asset Management Framework. Guidance from the department is comprehensive, however, the four successful business cases all fell well short of meeting the guidelines, indicating that the department is not enforcing its own guidelines. Analysis of business cases submitted under MERP, and those developed for internal use only, revealed significant shortcomings:
- None reviewed the efficiency of existing scanners to see whether another scanner might not be needed. CT and MR scanners have high fixed costs regardless of intensity of use, creating an imperative to fully use existing equipment.
- None considered all available options to deliver the imaging service. This is of concern as there are many different methods used to deliver, and expand, CT or MR imaging services in Victoria, including:
- upgrading or increasing the use of an existing scanner
- leasing instead of owning the scanner
- acquiring a new scanner
- outsourcing the service.
- Business cases were not generally forward looking. Although all public health services provided evidence of current service demands, only two of the reviewed business cases forecast future demand. Business cases did not identify a time line or responsibilities for review.
- Seven out of nine business cases did not set utilisation targets against which scanner efficiency could be measured. Benefits of the preferred option were not quantified in four cases—making it difficult to know what to hold the health service to account for. Inadequately defined benefits also make it difficult for decision-makers to make an informed decision at the outset.
2.5 Access to MR and CT scanners
Informed resource allocation at a health-system level is important in making sure that patients have good geographical and timely access to publicly-funded CT and MR services. Where access to publicly-funded scans is limited, patients may need to travel further or pay out-of-pocket expenses—which typically range from $60 to $200, depending on the procedure—to receive the same service privately.
Geographical access
The available data suggests that some metropolitan regions and regional centres do not have the same geographical access to public MR and CT imaging services as others. For example:
- as shown in Figure 2A, the Southern metropolitan region has six and two times the density of publicly-funded MR and CT scanners respectively as the Eastern metropolitan region
- significant regional cities such as Warrnambool and Mildura have no publicly‑funded MR scanner available to outpatients.
Appendix B shows the location of CT and MR scanners that are funded and owned by public health services and private service providers. Figure 2A includes publicly-owned scanners as well as privately-owned scanners that provide access to public patients through contracts with public health services.
Figure 2A
Publicly-funded MR and CT scanners per million population

Note: Excludes specialty health services—Peter MacCallum Cancer Centre, Royal Children's Hospital, Royal Eye and Ear Hospital and Royal Women's Hospital.
Source: Victorian Auditor-General's Office from the baseline survey of all health services conducted in July 2014, and site visits of selected health services.
Timely access
The department does not monitor demand or waiting times for imaging services to understand service need and inform resource allocation decisions. Wait times for CT scans vary from zero to seven days across the state, indicating that CT demand is being met. However wait times for MR scans vary considerably.
Figure 2B shows the range of MR wait times in the metropolitan region, based on our survey results. It shows wait times from zero to 98 days. Wait times in the North and West region of Melbourne are twice that of the Southern region. This indicates either poor distribution of MR scanners across Melbourne, and/or areas where health services need to improve the utilisation of existing scanners.
Figure 2B
2012–13 average outpatient MR wait times in metropolitan health regions
|
Region |
Shortest wait time (days) |
Average wait time (days) |
Longest wait time (days) |
|---|---|---|---|
|
Southern metropolitan—three health services |
10 |
27 |
38 |
|
Eastern metropolitan—one health service |
– |
49 |
– |
|
North and West metropolitan—four health services |
24 |
60 |
98 |
|
Speciality health services |
0 |
2 |
8 |
Note: Eastern metropolitan has only one publicly-funded MR scanner.
Note: Specialty health services include Peter MacCallum Cancer Centre, Royal Children's Hospital and Royal Women's Hospital. The Royal Eye and Ear Hospital does not have an MR scanner.
Source: Victorian Auditor-General's Office from the baseline survey of all health services conducted in July 2014.
The department and health services also do not know the capacity or wait lists of adjacent public imaging services. Better coordination between public health services could reduce outpatient MR scan wait times and better utilise nearby MR scanners. For instance, as shown in Figure 2B, outpatients facing a three-month wait at a public health service in the North and West metropolitan region could instead be scanned sooner at a nearby health service.
Likewise, MR scanners at two specialist metropolitan health services have wait lists of less than three days, and could potentially absorb unmet demand from other metropolitan health services—an adjacent public health service has a wait list greater than 84 days, while another public health service less than 10 kilometres away has a wait list of 98 days.
Some regional health services could also help meet demand. An imaging services manager at a regional public health service with an MR wait list of zero days commented that while it is commonplace for patients in regional areas to travel to Melbourne for scans, this was not the case for patients in the city who would seldom travel to a regional public health service for the same procedure.
These examples demonstrate that it is possible for public health services to coordinate services to reduce wait lists across the state.
A step in the right direction is the department's Specialist clinics in Victorian Public Hospitals Access policy, which could allow outpatients at one health service to be referred to another. It is expected that all health services will be compliant with this policy by 1 July 2015. However, without information about the waiting lists of other health services it will be difficult for health services to make appropriate referrals.
2.6 Inadequate medical equipment asset management
Poor medical equipment asset management practices in public health services exacerbate a lack of information at the health-system level. None of the six public health services visited had an asset management plan that included imaging equipment. The health services cannot communicate to the department what their future imaging needs would be, or clearly identify to the audit team what these equipment needs would be over the medium to longer term. This means that although future demand is set to increase, it is not clear at either the health-system or health‑service level how that demand might best be met.
A review of medical equipment documentation from six major public health services found that imaging equipment asset management practices are:
- not integrated into overall planning—such as business and corporate plans
- not considering funding strategies or options—this is particularly important given the relatively high equipment cost and uncertainty of funding from the main sources, namely MERP, philanthropy and surplus internal funds
- not consistent with government policy as articulated in the 2000 Department of Treasury and Finance's Sustaining Our Assets, as they do not:
- cover the full life cycle and costs—including acquisition, condition, maintenance, upgrades, utilisation, redeployment and disposal
- identify and prioritise service demands
- determine the optimal asset mix of high-value equipment
- establish accountability for asset condition, use and performance
- well short of the five-year horizon recommended by government policy, and the 2003 VAGO audit Managing Medical Equipment in Public Health Services—the longest forward estimate for medical equipment asset planning in the six public health services visited was two years.
Based on information provided by health services there has been little systemic improvement in medical equipment asset management since the 2003 VAGO audit, which shows an ongoing shortcoming within public health services.
The department acknowledges that asset management practices are variable across public health services. During the audit public health service representatives reported that asset management practices within health services compare unfavourably with other areas of government—such as municipal councils, where asset management is more developed. This is supported by the 2014 VAGO Asset Management and Maintenance by Councils report, which found that although there was room for improvement, councils were applying asset management guidance, routinely self-assessing asset management performance, and had developed asset management systems, frameworks, strategies and plans.
As stated in the 2012–13, 2013–14 and 2014–15 Victorian Health policy and funding guidelines, the department requires public health services to meet government asset management policy requirements. It has developed specific guidance for public health services in the form of the Medical Equipment Asset Management Framework. This is consistent with government policy and covers the life-cycle stages of effective asset management. However, there is little evidence that public health services are using this framework systematically or that the department is monitoring compliance with this requirement.
Public health services instead rely on multiple sources of documentation and fragmented processes for the management of medical equipment. These sources are located at, and owned by, different areas within public health services and include asset registers, business cases and basic asset management plans:
- Asset registers—maintained by finance departments within public health services for accounting and administrative purposes. These do not contain comprehensive information on equipment service demands, performance, condition and maintenance, and cannot be used for such purposes.
- Business cases—developed as service needs arise, generally to acquire new equipment. While service demand analysis may be conducted for individual pieces of equipment it is not undertaken for overall service planning purposes, as would be expected by the Department of Treasury and Finance's Sustaining Our Assetsguidance.
- Basic asset management plans—are developed, updated and submitted to the department for asset replacement purposes. The department states that basic asset management plans are not intended to replace asset management plans.
Recommendations
That the Department of Health and Human Services:
- collects, analyses and uses key information on computed tomography and magnetic resonance imaging services to inform resource allocation decisions and better coordinate services across the state
- more rigorously and transparently assesses the proposals for funding submitted to its Medical Equipment Replacement Program, and clearly documents its decision‑making processes
- develops a shared referral system to better coordinate public health services' imaging departments and reduce wait times for public outpatient magnetic resonance scans.
That public health services:
- develop and apply medical equipment asset management practices consistent with Department of Treasury and Finance better practice guidelines.
3 Delivering value-for-money imaging services
At a glance
Background
Public health services can deliver computed tomography (CT) and medical resonance (MR) imaging services in a number of ways—including purchasing or leasing for in‑house use, outsourcing the service or a combination of options. All options need to be assessed so that CT and MR imaging services are delivered cost-effectively.
Conclusion
The cost-effectiveness of delivering CT and MR imaging services varies widely between health services. This means that while some CT and MR imaging services operate at a surplus, similar imaging services at nearby health services incur losses in the millions each year.
Findings
- Public health services provide CT and MR imaging services in very different ways.
- Significant differences in the operating costs and revenue of these delivery models show substantial scope for improving how—and at what cost—these services are delivered.
- Public health services do not develop comprehensive imaging equipment business cases that would assist them to optimise these services.
- Health Purchasing Victoria is beginning to lead procurement improvement in the purchasing of complex medical equipment by public health services.
Recommendations
- That public health services review all available options for new and existing imaging services, as a priority, so that the purchase of CT and MR imaging services achieves the best value for money.
- That Health Purchasing Victoria assists health services to achieve the best value outcomes in the procurement of CT and MR imaging services.
3.1 Introduction
Public health services can deliver computed tomography (CT) and medical resonance (MR) imaging services in a number of ways—including purchasing or leasing for in‑house use, outsourcing the service or a combination of options. Better practice—as outlined in the Department of Treasury and Finance's (DTF) Sustaining Our Assets, asset management policy—calls for all options to be assessed so that CT and MR imaging services are delivered cost-effectively.
3.2 Conclusion
The cost effectiveness of CT and MR imaging services varies widely between health services. This means that while some CT and MR imaging services operate at a surplus, similar imaging services at nearby health services incur losses in the millions each year. Effort to improve the cost-effectiveness of poorer performing health services could generate significant savings and potentially increase patient access.
3.3 CT and MR imaging delivery model
Victoria's public health services provide CT and MR imaging services using a range of delivery models. As shown in Figure 3A:
- 45 per cent (37) fully outsource CT and MR imaging
- 26 per cent (22) refer to other service providers, either public orprivate
- 17 per cent (14) provide CT and MR imaging services inhouse
- 12 per cent (10) combine in-house and outsourcing models.
Figure 3A
How health services deliver CT and MR imaging services in Victoria
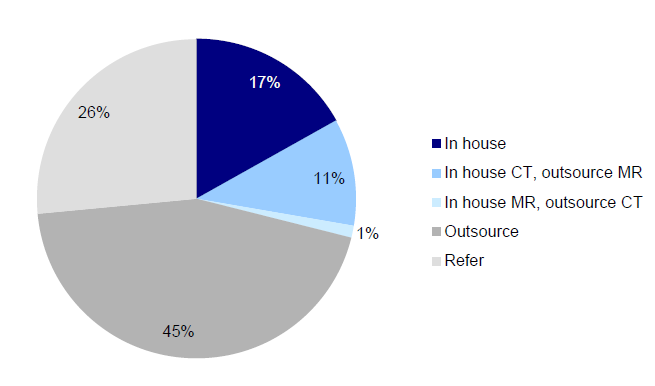
Source:Victorian Auditor-General's Office from the baseline survey of all health services in 2014.
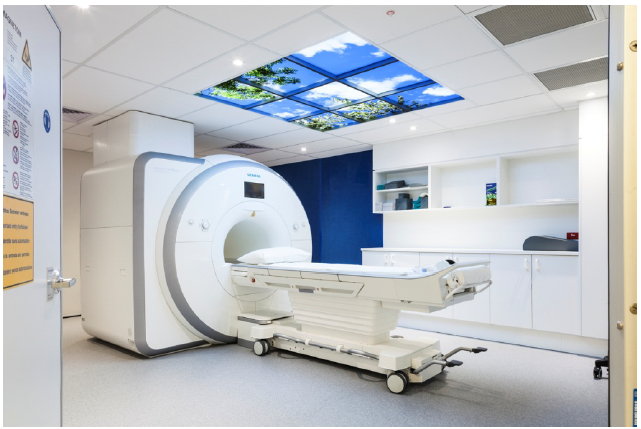
MR scanner—photograph supplied by Alfred Health Radiology.
Although DTF's Sustaining Our Assets calls for all options to be considered at the outset, public health services are not always in a position to adopt their preferred operating model. In particular, public health services:
- do not have ready access to capital to purchase scanners as they:
- do not receive specific capital funding—it is included as a component of the activity-based funding model and is therefore often absorbed by general operating costs
- are not permitted to borrow capital or enter into hire purchase leases
- cannot apply for funding from the Department of Health and Human Services unless equipment is part of a broader expansion of the health service or replacing an existing, owned scanner—funding is not available to replace leased equipment
- can be limited by their existing delivery model—for example, one audited health service has signed a 10-year agreement, with an option to extend a further 10years at the discretion of the private provider, that binds it to use an outsourced model for all patients on that health service site
- have little control over whether they are granted Commonwealth licences for an MR scanner—a licence completely changes the business model as the service can then receive Medicare rebates for 189 procedures or scans, while an unlicensed scanner cannot claim rebates for any of these procedures.
Analysis of 2012–13 financial data from six audited public health services shows substantial variation in the comparative profitability or loss of imaging services. For example:
- The provision of CT imaging services ranges from an annual surplus of $2 087 883 in one of the audited health services, to an annual loss of almost $3 million in another. Similarly, the annual surplus of public MR imaging services ranges from $990 162to an annual loss of $942 000. This variation is not dependent on the size of the imaging service. This is significant as larger imaging services might be better able to spread the high fixed costs of scanners, such as annual maintenance than smaller imaging services.
- For MR scans, the average unit scan cost charged by private providers contracted by health services ranges from $231 to $431 per MR scan. This amounts to a difference of around $1millionperyear for an average large regional or metropolitan imaging service.
- The average unit scan cost for in-house imaging services ranges from a surplus of $62 to a loss of $55 per CT scan, and a surplus of $47 to a loss of $71 per MR scan. This amounts to a difference of over $2 million per year for an average large regional or metropolitan CT and MR imaging service.
- Cost to interpret the scanned image. Fee-for-service (FFS) models in two public health services cost roughly one and a half times more per CT scan ($94) than the same service provided in house ($62). This amounts to almost $1 million per year each for an average large regional or metropolitan service.
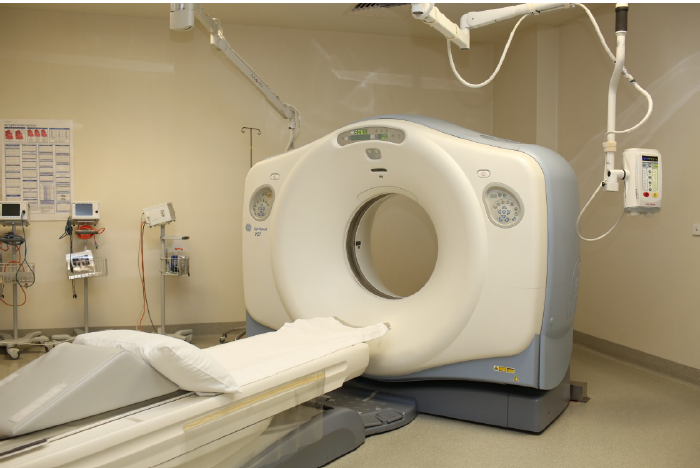
CT scanner—photograph supplied by Alfred Health Radiology.
Figure 3B and 3C provide further details from six health services visited—including equipment, staff and other operating costs in addition to revenue generated for CT and MR imaging services.
In this analysis total revenue excludes activity-based funding—Weighted Inlier Equivalent Separation (WIES)— as the Department of Health and Human Services and health services could not identify the proportion of this funding for CT or MR imaging services. Further, audited health services reported that WIES funding is not distributed to imaging services pro rata—that is, based on the number of inpatients scanned.
Figure 3B
Comparative CT imaging service profitability, 2012–13
|
Health service 1 |
Health service 2 |
Health service 3 |
Health service 4 |
Health service 5 |
Health service 6 |
|
|---|---|---|---|---|---|---|
|
Delivery model |
In house |
In house |
In house |
Outsource |
In house |
In house |
|
Number of scanners |
Three |
Four |
Five |
Three |
Two |
|
|
Scanners status |
Two owned One leased |
One owned Three leased |
Five leased |
n/a |
Two owned One leased |
Two owned |
|
Equipment total |
$1 236 430 |
$1 027 367 |
$1 327 000 |
n/a |
$538 022 |
$910 000 |
|
Staff total |
$3 241 499 |
$3 663 315 |
$3 497 100 |
$2 275 428 |
$1 594 101 |
|
|
Other total |
$365 618 |
$236 618 |
$267 940 |
$305 595 |
$460 044 |
|
|
Average read cost per scan |
$50 |
$85 |
(FFS) $88 |
n/a |
$58 |
(FFS) $99 |
|
Total cost |
$4 843 547 |
$4 927 300 |
$5 092 040 |
$2 991 916 |
$3 119 045 |
$2 964 145 |
|
Total revenue |
$6 931 430 |
$5 219 128 |
$3 410 957 |
$0 |
$3 241 613 |
$2 706 901 |
|
Net surplus/loss |
$2 087 883 |
$291 828 |
–$1 681 083 |
–$2 991 916 |
$122 568 |
–$257 244 |
|
Total scans |
33 488 |
28 032 |
30 480 |
12 959 |
18 610 |
12 344 |
|
Surplus/loss per scan |
$62 |
$10 |
–$55 |
–$231 |
$7 |
–$21 |
Note: Equipment total includes all costs associated with the scanners, including lease, acquisition and maintenance costs, regardless of funding source. Where scanners were acquired outright, the total acquisition cost was divided evenly over 10 years. Depreciation of equipment was excluded from this analysis.
Note: Staff total includes all staffing costs associated with operating the scanners, including salaries and on-costs. Due to the different approaches used to assign penalty rates to these staff, penalties were excluded from this analysis.
Note: Average read cost per scan is determined by summing the outsourced interpreting and reporting of scans, along with the salaries and on-costs of radiologists, registrars and fellows employed to interpret and report on the scan. FFS signifies a fee-for-service model used to interpret and report on scans conducted by that health service.
Note: Other total includes contrast agents and other consumables used routinely to deliver CT and MR imaging services. It also includes the supporting costs for the Radiology Information Systems and the Picture Archive and Communication Systems (PACS) associated with the CT and MR imaging services. It excludes rent as no imaging department is charged rent in the health services visited. It also excludes corporate overheads as the imaging department of two health services are not charged overheads.
Source: Victorian Auditor-General's Office.
Figure 3C
Comparative MR imaging service profitability, 2012–13
|
Health service 1 |
Health service 2 |
Health service 3 |
Health service 4 |
Health service 5 |
Health service 6 |
|
|---|---|---|---|---|---|---|
|
Delivery model |
In house |
In house |
Outsource |
Outsource |
In house |
In house |
|
Number of scanners |
Three |
Two |
Two |
One |
||
|
Scanners status |
Three owned |
One owned One leased |
n/a |
n/a |
Two leased |
One owned |
|
Licence |
2 full; 1 part |
1 full; 1 part |
1 full; 1 part |
1 full |
||
|
Equipment total |
$916 700 |
$661 746 |
n/a |
n/a |
$962 756 |
$457 970 |
|
Staff total |
$3 217 325 |
$2 580 078 |
$1 754 117 |
$987 934 |
||
|
Other total |
$335 523 |
$122 874 |
$181 349 |
$305 188 |
||
|
Average read cost per scan |
$66 |
$175 |
n/a |
n/a |
$92 |
(FFS) $121 |
|
Total cost |
$4 469 548 |
$3 364 698 |
$942 000 |
–$584 042 |
$2 898 222 |
$1 751 092 |
|
Total revenue |
$5 459 710 |
$2 664 431 |
$0 |
$0 |
$2 250 585 |
$1 681 804 |
|
Net surplus/loss |
990 162 |
–$700 267 |
–$942 000 |
–$584 042 |
–$647 637 |
–$69 288 |
|
Total scans |
21 234 |
9 819 |
2 185 |
2 529 |
8 714 |
4 456 |
|
Surplus/loss per scan |
$47 |
–$71 |
–$431 |
–$231 |
–$74 |
–$16 |
Note: See notes under Figure 3B.
Source: Victorian Auditor-General's Office.
Such significant difference in the costs associated with delivering CT and MR imaging services across the six health services shows that there is substantial scope for improving how—and at what cost—these services are delivered. Health services need to carefully consider the many variables involved in operating a CT or MR imaging service that can affect profitability, including:
- how the equipment is acquired and maintained
- the number and mix of staff needed to operate the scanners and interpret the scans
- their capacity to move patients efficiently through the scanning process
- scanner availability, including the opening hours per day and the number of week and weekend days open per year
- whetherthe patient is private or public and related opportunities to generate revenue.
3.3.1 Missed opportunities to generate additional revenue
Imaging services are one of the few areas within a public health service that can generate revenue over and above their annual operating budget. Licensed MR scanners, and all CT scanners, can generate substantial revenue from outpatients—who represent 48 per cent of all patients scanned in public imaging departments—through the Commonwealth Medicare Benefits Scheme, the Transport Accident Commission, Victorian WorkCover Authority and the Department of Veteran Affairs. For example, Commonwealth Medicare Benefits Scheme standard fees for each CT procedure range from $56.60 to $700, and for each MR procedure from $168 to $690.
By optimising this additional revenue, CT and MR imaging services can potentially operate profitably.
Outsourced CT and MR imaging services—shown as Health service 4 in Figure 3B and Health services 3 and 4 in Figure 3C—cost significantly more primarily because additional third-party revenue is foregone.
3.4 Health Purchasing Victoria
Health Purchasing Victoria (HPV) has a legislative mandate to facilitate public health service collaboration to get the best value in purchasing, reduce inefficient duplication of functions—particularly in tendering—and improve purchasing practices.
HPV accepted a 2011 VAGO Procurement Practices in the Health Sector audit recommendation to 'purposefully lead procurement improvement in the public hospital sector by actively fulfilling all its legislative functions'. Since then it has acted on this recommendation by executing agreements in 2014 for two categories of complex medical equipment—physiological monitoring devices and defibrillators.
HPV also commenced a Medical imaging equipment sourcing strategy in April 2014. As part of this strategy, it has committed to releasing standard terms, conditions and specifications for scanning equipment contracts by March 2015. This will save time and costs for health services when negotiating for the lease and acquisition of imaging equipment. However, it has yet to improve the procurement of public imaging services.
Recommendations
- That public health services review all available options for new and existing imaging services, as a priority, so that the purchase of computed tomography and magnetic resonance imaging services achieves the best value for money.
- That Health Purchasing Victoria assists health services to achieve the best value outcomes in the procurement of computed tomography and magnetic resonance imaging services.
4 Utilisation of high-value equipment
At a glance
Background
The high capital and maintenance costs of computed tomography (CT) and magnetic resonance (MR) scanners mean they should be used to the fullest extent possible. Increasing scanner efficiency, and therefore utilisation, can significantly decrease the cost per scan and increase public patient access to imaging equipment.
Conclusion
Managers of health services and the Department of Health and Human Services, as the health system manager, do not know whether costly imaging equipment is being utilised efficiently, which makes it difficult to take appropriate action to increase efficiency.
Findings
- There is widespread variation in the utilisation of CT and MR imaging equipment—from 351 to over 21 000 scans per machine per year.
- Public health services do not systematically collect the information necessary to determine or improve the efficiency of the scanners they manage.
- Public health services have no means to compare their efficiency with that of other health services.
Recommendations
- That the Department of Health and Human Services develops a data repository to enable public health services to understand and compare their CT and MR scanner utilisation.
- That public health services analyse and use key information about the utilisation of their own and other health services' CT and MR scanners to maximise utilisation.
4.1 Introduction
Due to high capital and maintenance costs—which are not dependent on the number of scans performed—computed tomography (CT) and medical resonance (MR) scanners should be used as intensively as possible. Intensive use drives efficiency by spreading the cost of the machine across more patients, thus reducing the overall cost per scan. Patient throughput—that is, the number of patients being moved through the scanning process—and scanner availability should be optimised to best meet patient demand.
4.2 Conclusion
There is significant variation in the efficiency of public scanners. Opportunities to reduce substantial wait times for MR scans—averaging 30 days for public outpatients across the state—are missed.
Public health services do not routinely compare efficiency between their own scanners or have the means to compare scanner efficiency with other health services. This means that managers of public health services and the Department of Health and Human Services (the department) as health system manager, does not know whether costly imaging equipment is being fully utilised.
Public health services could improve CT and MR productivity by:
- using radiology information system (RIS) machine performance data to monitor performance at a machine, site and health-service level
- reviewing appointment and scan times for routine procedures to reduce downtime or time between patients
- operating MR scanners for longer hours in the week and weekend, where practicable
- sharing MR outpatients across public health services to reduce long wait lists.
4.3 Benchmarking performance
Internationally, there are no widely accepted performance benchmarks for CT and MR scanner utilisation. However, an analysis of Organisation for Economic Co-operation and Development (OECD) data—shown in Figure 4A—indicates that there is scope to improve Victoria's use of both CT and MR scanners.
Figure 4A
International comparison of Victorian CT and MR utilisation, 2012
|
Average CT scans per scanner |
Average MR scans per scanner |
|
|---|---|---|
|
Canada |
8 627 |
5 519 |
|
England |
8 732 |
6 480 |
|
Victoria |
7 690 |
5 297 |
|
OECD |
6 987 |
4 921 |
Source: Victorian Auditor-General's Office, from Organisation for Economic Co-operation and Development Health Statistics dataset and 15 health services' radiology information system data.
While the OECD average provides a point of comparison, there are limitations with this data due to:
- differences between countries in the model of healthcare delivery
- geographical and demographic constraints
- the fact that the average does not necessarily represent appropriate clinical practice.
4.4 Performance measurement
Public health services have no way of understanding their scanner performance. They are unable to compare performance with other health services. Utilisation, or scanner efficiency, is about how available scanners are to patients—hours open—and patient throughput—the number of scans per hour. As part of this audit, all major Victorian health services—13 metropolitan and six regional—were requested to submit data from their RIS. These systems record utilisation data from each CT and MR scan.
Four large health services could not submit data to VAGO of sufficient integrity to enable analysis and were excluded from the sample. It is therefore doubtful whether these health services could report accurately to senior management on the use of their scanners. A further four health services could not provide this data at a machine level, despite all RIS being capable of doing so. Overall, this means almost half—42 per cent—of all major health services cannot accurately determine utilisation or compare the efficiency of the scanners they manage. Only two of the six health services visited could demonstrate that they review and regularly report on CT and MR scanner performance to senior management.
Managers of public health services and the department as health system manager, do not know whether costly imaging equipment is being fully utilised, which makes it difficult for managers to identify improvements that could be made and to take appropriate action.
4.5 Unexplained variation in scanner utilisation
There is widespread variation in the patient throughput and availability of both CT and MR imaging equipment in Victorian health services. The breadth of this variation—from 351 to over 21 000 scans annually—strongly suggests that not all scanners are managed efficiently and that under-utilisation is occurring. Analysis of the 2012–13 RIS data provided by 15 health services is summarised in Figures 4B and 4C.
Figure 4B
2012–13 CT scanner utilisation—summary data
|
Lowest |
Average |
Highest |
|
|---|---|---|---|
|
Availability |
|||
|
Hours of operation per week |
37.5 |
75 |
168 |
|
Visits between 8am and 6pm—per cent |
49 |
78 |
100 |
|
Weekday visits—per cent |
70 |
85 |
100 |
|
Throughput |
|||
|
Number of scans by scanner—annual |
547 |
7 690 |
21 151 |
|
Number of scans by scanner—per hour |
0.4 |
2.3 |
3.2 |
|
Wait time in days |
0 |
1.6 |
7 |
Source: Victorian Auditor-General's Office, collated from the baseline survey of all health services and 15 health services' radiology information system data.
Figure 4C
2012–13 MR scanner utilisation—summary data
|
Lowest |
Average |
Highest |
||||
|---|---|---|---|---|---|---|
|
Availability |
||||||
|
Hours of operation per week |
42.5 |
67 |
168 |
|||
|
Visits between 8am and 6pm—per cent |
76 |
87 |
100 |
|||
|
Weekday visits—per cent |
78 |
89 |
100 |
|||
|
Throughput |
||||||
|
Number of scans by scanner—annual |
351 |
5 297 |
9 504 |
|||
|
Number of scans by scanner—per hour |
0.2 |
1.8 |
2.9 |
|||
|
Wait time in days |
0 |
30 |
98 |
|||
Source: Victorian Auditor-General's Office, collated from the baseline survey of all health services and 15 health services' radiology information system data.
Some variation in the productivity of CT and MR scanners is unavoidable for a range of reasons:
- The clinical protocols for a CT or MR scan can vary slightly between health services as they are prescribed by the radiologists. In practice, this can mean that the scanning procedure at one health service can be more conservative and take longer than the prescribed scanning procedure for the same patient at another health service. This is a clinical judgement which the audit team did not assess.
- The number of specialised scanning procedures that take significantly longer, such as those requiring sedation.
- Patient condition can affect throughput as some patient groups, such as those in acute care, take considerably longer to move on and off the scanner.
- The specialisation of the health service is relevant, as a health service specialising in spinal care may take longer to perform these scans compared to another with patients who can walk in and out of the imaging department.
- Some machines are dedicated scanners that need to be available regardless of demand, particularly those in the emergency department (ED).
4.5.1 Utilisation of CT scanners
We analysed date from 315 297 CT scans across 15 health services in 2012–13. There is wide variation in the total number of scans and operating hours of CT machines located within and outside EDs. Scanner productivity also varies in the number of scans performed per hour and the estimated downtime of scanners in operating hours. There is a significant opportunity to increase the efficiency of public CT scanners.
CT scanners perform a critical function in EDs by enabling rapid diagnosis. CT machines located in EDs performed between 9 218 and 21 151 scans, with an average of 15 355 scans, in 2012–13. Out of necessity these machines are open for longer hours than those located outside EDs, regardless of demand, and were excluded from further analysis.
Figure 4D illustrates the wide variation in the number of scans performed by non-ED CT scanners, which performed between 547 and 8 437 scans, at an average of 4 970 scans, in 2012–13. This means that the lowest performing scanner completes one scan for every nine completed with an average scanner, while the highest performing scanner has a scanning rate of almost double the average CT scanner.
The number of CT scans performed per hour of operation also varies considerably. Scanner efficiency varies from less than one CT scan every two hours to more than three an hour, with an average of 2.3 scans per hour. Higher performing CT scanners completed eight times as many scans per hour as lower performing scanners.
Figure 4D
Number of CT scans performed by machines not located in emergency departments 2012–13
Source: Victorian Auditor-General's Office from 11 health services' radiology information system data.
CT inter-scan time
We examined 2012–13 Commonwealth Medicare Benefits Schedule (MBS) data to identify the three most common CT billable outpatient procedures in Victoria. These CT procedures include:
- neck, chest, abdomen and pelvis (MBS item 56807)
- brain (MBS item 56001)
- lumbar spine (MBS item 56223).
Each of the six health services visited was asked to provide its standard appointment times, and actual scan or 'table' times for these procedures, with the difference between the two equating to the inter-scan time.
Patients with acute needs—such as those in an ED or Intensive Care Unit, or requiring interventions such as internal biopsies—can take considerably longer to scan and these patients were excluded from this analysis. All other patient groups, including inpatients and outpatients, were included.
Figure 4E
CT inter-scan times
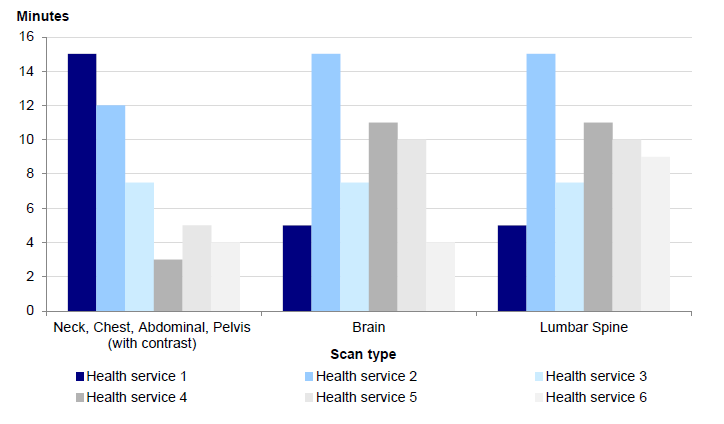
Source: Victorian Auditor-General's Office.
Figure 4E shows that there is significant variation, of at least 10 minutes, in inter-scan times for all CT procedures examined. This is mainly due to the large variation in appointment times for the same procedure. This provides a clear opportunity for public health services to reduce machine downtime within current operating hours by reviewing scheduling arrangements and appointment times with regard to actual scan times.
For example, Health service 2 in Figure 4E advised that its appointment times are quite conservative, allowing more time than may be needed per patient, and that this approach is currently being reviewed by the health service to increase patient throughput. Health service 1 is also aware of its relatively long inter-scan time for the neck, chest, abdominal, pelvis CT scans and is determining what the optimal schedule time for this procedure should be.
Figure 4F shows what one audited health service has done to improve utilisation rates and increase scanner availability for patients.
Figure 4F
Improving CT imaging service efficiency
|
The imaging department in one large metropolitan health service identified areas for improvement and was able to increase CT scanner efficiency between 2007–08 and 2013–14 by:
Since 2007–08 this imaging service has achieved the following positive outcomes:
|
Source: Victorian Auditor-General's Office.
Wait time for CT scans
Wait lists for CT scans in Victoria are relatively low compared to MR wait lists, suggesting there are currently enough CT scanners to meet service demand. Wait times for CT vary from zero to seven days depending on patient type, with outpatients waiting longer than inpatients and those in ED. Just over a quarter of all CT scanners had no wait time.
4.5.2 Utilisation of MR scanners
Similar to CT scanners, there is wide variation in the total number of scans and operating hours of MR scanners. There is a significant opportunity to increase the efficiency of public MR scanners.
A total of 154 030 MR scans across 15 health services were analysed in 2012–13. Figure 4G illustrates variation in the number of scans conducted per machine for this period—from 351 to 9 504. This means that while the lowest performing scanner conducts less than one scan per day, the highest performing scanner does more than 26 scans per day. Similar to CT scanner productivity, unavoidable factors such as working with more complex patient groups do not account for the huge breadth of variation in scanner performance across the state.
Figure 4G
Number of MR scans by machine
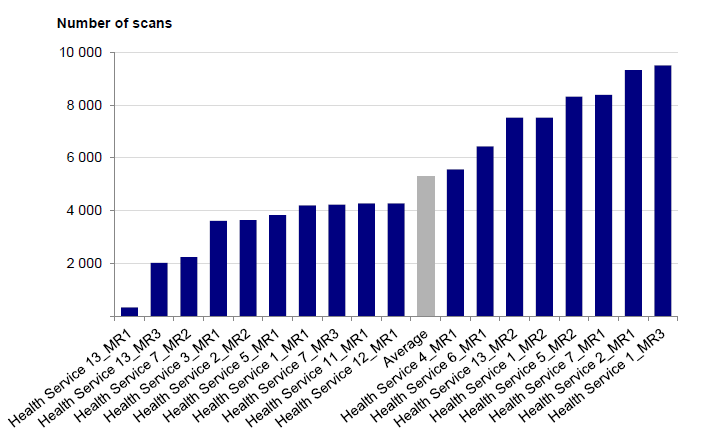
Source: Victorian Auditor-General's Office from 11 health services' radiology information system data.
Scanner utilisation also varies in the number of scans performed per opening hour, from less than one scan every six hours to over two and a half scans every hour. The lowest performing MR scanner is located adjacent to a health service that has two MR scanners with a wait list of over three months. MR wait lists are discussed below.
MR inter-scan time
Standard appointment times, and scan or 'table' times, were analysed for three Medicare billable MR procedures:
- knee or its supporting structures (MBS item 63 328)
- brain and surrounding membranes (MBS item 63 001)
- sciatic nerve (MBS item 63 176).
As with the CT scan analysis, patients with acute needs such as those in an ED or Intensive Care Unit or requiring interventions such as internal biopsies were excluded from this analysis. The MR imaging service for Health Service 3 was outsourced and excluded as it did not provide data. Figure 4H shows the inter-scan times for the three procedures examined. Although the variation between the health services is not as great as that found for CT inter-scan times, there is variation in inter-scan times for all six CT and MR procedures examined, primarily due to the large variation in appointment times for the same procedure.
This variation can have a significant impact on imaging services with licensed scanners. For a knee MR scan, an inter-scan time of nine minutes less per scan can mean 17 more appointments per day if this was the only procedure performed on that scanner. The revenue generated from each outpatient knee MR scan through the MBS is currently $403.20. Reducing the outpatient inter-scan time to that of Health service 4 would potentially mean an additional $6 854 in revenue each day. This indicates a clear opportunity to increase patient access and revenue without an increase in resources for those health services whose service delivery method allows this.
Figure 4H
MR inter-scan times
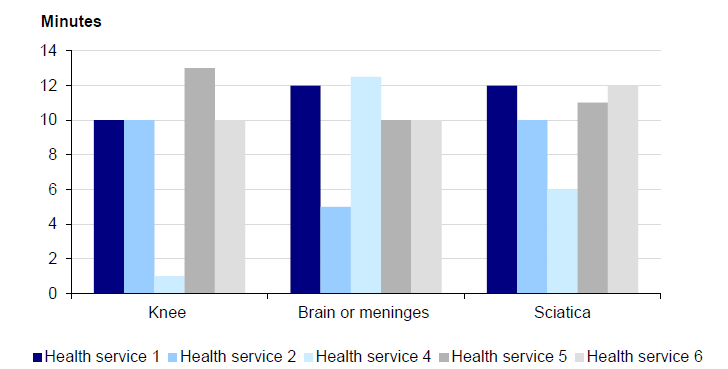
Source: Victorian Auditor-General's Office.
Wait time for MR scans
Unlike CT imaging services, wait times for MR scanners indicate that demand for MR is not being met by public health services. As discussed in Part 2, outpatient wait times for an MR scan are considerable, averaging 30 days across the state.
Inpatient access to imaging services can also be delayed and affect access to beds and patient flow through a hospital or health service as the result of an MR scan after treatment often triggers the decision to discharge.
Two of the six public health services visited, shown in Figure 4I, provided data on MR scan wait times for their inpatients. Roughly half of all non-urgent inpatients could not have an MR scan on the day it was ordered by the clinician. An average of 16 per cent of non-urgent inpatients waited four days or more for an MR scan. This indicates that poor MR scanner management is contributing to the demand for beds.
Figure 4I
Public health service inpatient wait times for non-urgent MR scans
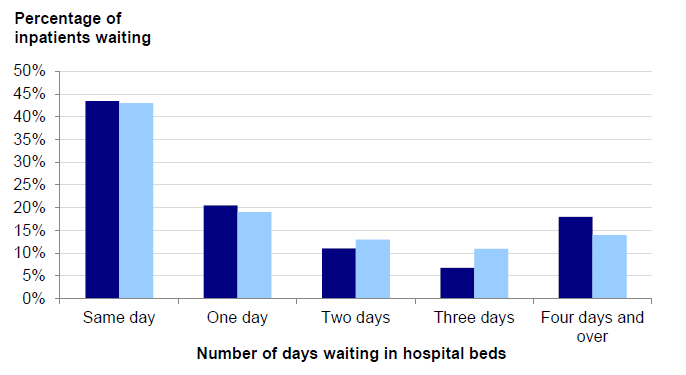
Source: Victorian Auditor-General's Office based on data from two metropolitan health services.
Another public health service reported that: 'In terms of additional time spent waiting in hospital for an MR, [the business case to put on an additional MR scanner has been] modelled on 13 patients per week assuming a conservative saving of two bed days, or 26 bed days per week (1 352 per year). This would enable savings to be achieved in the order of four equivalent beds per day, equating to $296 000 per year.'
4.5.3 Availability of MR imaging services
Where practicable, MR scanners could be open for longer hours and more days of the week to better meet demand. Despite high wait lists MR scanners are predominantly only available on weekdays between 8 am and 6 pm. The majority of scans—over three quarters—are performed in these hours. The availability of MR scanners varies from machine to machine across public health services with the opening hours of MR scanners ranging from 42.5 to 168 hours per week with an average of 68 hours.
Fully licensed MR scanners generally open for longer hours than unlicensed and partially licensed machines as they can generate substantial revenue from all MR procedures currently listed on the MBS—rebates range from $168 to $690 per scan. Six licensed scanners—one-third of all licensed MR scanners—are open for fewer hours than the overall average. All unlicensed machines and 80 per cent of partially licensed machines are open less than 60 hours a week. The spread of opening hours by type of MR scanner is shown in Figure 4J.
Figure 4J
MR scanner opening hours by licence type
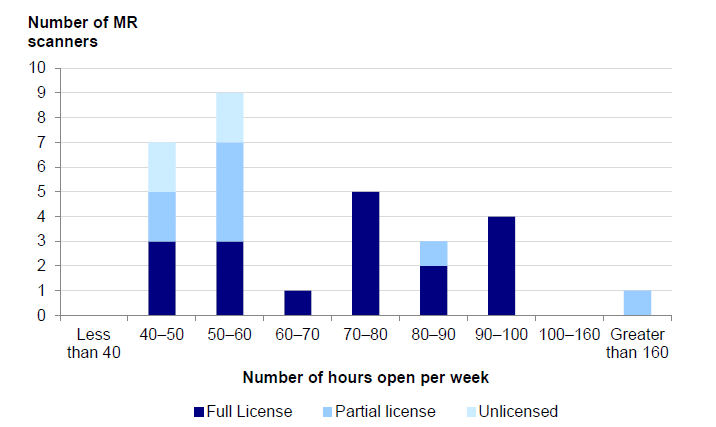
Source: Victorian Auditor-General's Office from the baseline survey of all health services.
When analysed by day of the week, Figure 4K shows that the number of MR scans drops by 50 per cent on Saturdays and by 75 per cent on Sundays compared to weekday usage. Meanwhile, nearly nine out of 10 scans were carried out between 8 am and 6 pm. Public health services have advised that a key reason for not being able to extend opening hours has been the difficulty of getting staff to work these hours.
Figure 4K
MR scans per day of the week
Source: Victorian Auditor-General's Office from 15 health services' radiology information system data.
Recommendations
- That the Department of Health and Human Services develops a data repository to enable public health services to understand and compare their computed tomography and magnetic resonance scanner utilisation.
- That public health services analyse and use key information about the utilisation of their own and other health services' computed tomography and magnetic resonance scanners to maximise utilisation.
Appendix A. Audit methodology
The audit approach—after benchmarking, interviews with the Victorian Department of Health and Human Services and Health Purchasing Victoria, and desktop review—consisted primarily of assessing three distinct data sources, of different breadth and level of inquiry. Group One included all public hospitals and health services, Group Two included a representative sample of 15 metropolitan and regional health services, while Group Three focused on a selective sample of six health services.
|
Benchmarking: Publicly available computed tomography (CT) and magnetic resonance (MR) scanner utilisation data
|
|
Group One: All public hospitals and health services
|
|
Group Two: Representative sample
|
|
Group Three: Selective sample
|
Appendix B. Location of CT and MR scanners in Victoria
Location of CT scanners in Victoria
The map below shows ownership of CT scanners—it does not show those private CT scanners that may serve public patients through outsourced arrangements with public health services.
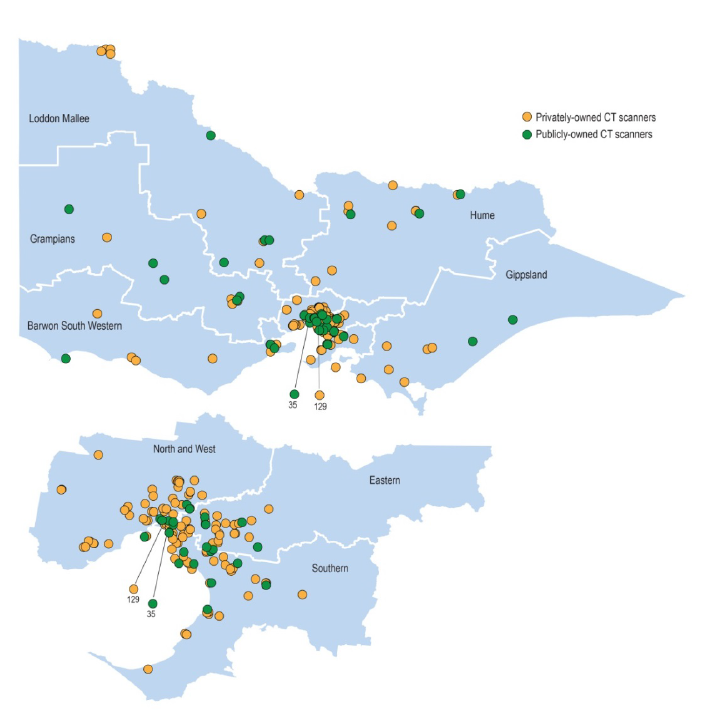
Source: Victorian Auditor-General's Office based on Department of Health and Human Services data.
Location of MR scanners in Victoria
The map below shows ownership of MR scanners—it does not show those private MR scanners that may serve public patients through outsourced arrangements with public health services.
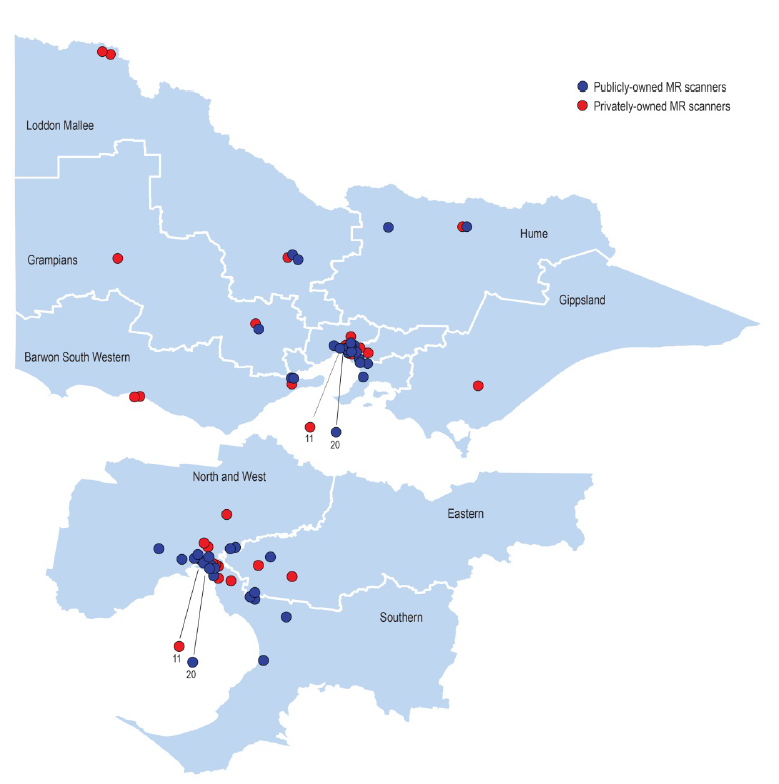
Source: Victorian Auditor-General's Office based on Commonwealth Department of Health's List of Medicare eligible units. Last updated on 25 July 2014.
Appendix C. Audit Act 1994 section 16—submissions and comments
Introduction
In accordance with section 16(3) of the Audit Act 1994, a copy of this report, or part of this report, was provided to the Department of Health and Human Services, Health Purchasing Victoria and six public health services.
The submissions and comments provided are not subject to audit nor the evidentiary standards required to reach an audit conclusion. Responsibility for the accuracy, fairness and balance of those comments rests solely with the agency head.
Responses were received as follows:
Department of Health and Human Services
Further audit comment:
Auditor-General's response to the Secretary, Department of Health and Human Services
RESPONSE provided by the Secretary, Department of Health and Human Services
RESPONSE provided by the Secretary, Department of Health and Human Services – continued
RESPONSE provided by the Secretary, Department of Health and Human Services – continued
Auditor-General's response to the Department of Health and Human Services
The department appears to have only clearly accepted one of the four recommendations directed towards it—with two recommendations being accepted ‘in principle’ and one ‘noted’. This does not provide confidence that the department will actively drive the implementation of these recommended actions. Further comment on the department’s response to each recommendation is provided below.
Recommendation 1While the department has agreed to develop a Victorian atlas of CT and MR scanners in 2015, this will not on its own be sufficient to inform resource allocation decisions or enable better coordination of services across the state. The department needs to collect both supply and demand data to fully inform planning at the state level, including data on scanner age and likely replacement, population densities of its regions and the wait times for Victorians in need of these services.
The report does not state nor imply that the department should be planning at the machine level. Pages 16 and 17 of our report make clear that this level of planning should be undertaken by health services in their asset management plans.
Recommendation 2
The department has accepted the need to improve documentation around the current Medical Equipment Replacement Program funding allocation process. However, the first part of this recommendation goes beyond just the documentation of decisions and highlights the need for the department to be ‘more rigorously and transparently assessing’ competing bids for the replacement of imaging equipment. This would address gaps, such as that detailed on page 11 of the report, around the justification of funding allocations.
Recommendation 3
The department has only noted the third recommendation but nevertheless undertakes to work with health services to develop a shared referral system to better coordinate public health services' imaging departments and reduce wait times for public outpatient magnetic resonance scans. VAGO assumes that this means that the department will drive the implementation of this action.
Recommendation 4
In its ‘in principle’ acceptance of Recommendation 7, the department commits to ‘a feasibility assessment’ and, if feasible, will develop a detailed business plan. VAGO does not agree that feasibility is an issue. Each health service’s radiology information system, as detailed on pages 28 and 29 of our report, stores readily available utilisation data on every scan. Such a database is practical and has been developed on a larger scale elsewhere. For example, the UK Primary Care Trusts have access to a data repository, maintained by the UK Department of Health for comparative purposes. The report does not state that the department itself needs to compare data at the health service level: rather, that it provides the means by which health services can do so.
RESPONSE provided by the Board Chair of Health Purchasing Victoria
