Local Government: 2014–15 Audit Snapshot
Overview
This report comments on the outcomes of the 2014–15 financial report and performance statement audits of the local government sector.
The sector generated a net surplus of more than $900 million annually in each of the past five financial years. The sector's net surplus was $1.5 billion in 2014–15 ($923.6 million in 2013–14). The increase was partly driven by the advance payments of $269.8 million of Commonwealth grants in 2014–15.
The changed timing for financial assistance grants in 2014–15 also impacted several short-term financial sustainability risk indicator results, leading to a more favourable outcome for the sector. Generally, local councils received a low financial sustainability risk assessment. Despite this, some local councils continue to face the ongoing challenge of maintaining spending on capital works and existing assets at sufficient levels.
A new performance reporting regime was introduced for the first time this year. However, there are still areas for improvement and challenges to overcome.
Local councils face the challenge of meeting higher costs associated with the maintenance and management of infrastructure assets over time yet not all local councils that received development contributions for local infrastructure had all the key elements of an effective development contribution management framework in place. Improvements can be made to strengthen the framework around risk identification and management, monitoring and reporting.
Local Government: 2014–15 Audit Snapshot: Message
Ordered to be published
VICTORIAN GOVERNMENT PRINTER November 2015
PP No 111, Session 2014–15
President
Legislative Council
Parliament House
Melbourne
Speaker
Legislative Assembly
Parliament House
Melbourne
Dear Presiding Officers
Under the provisions of section 16AB of the Audit Act 1994, I transmit my report on Local Government: 2014–15 Audit Snapshot.
This report comments on the outcomes of the 2014–15 financial report and performance statement audits of the local government sector.
This report shows that the local government sector generated a net surplus of more than $900 million annually in the past five financial years and has low financial sustainability risks. However, some local councils continue to face the ongoing challenge of maintaining spending on capital works and existing assets at sufficient levels.
This was the first year that local councils were required to prepare performance statements in accordance with the Local Government Performance Reporting Framework as set out by the Local Government (Planning and Reporting) Regulations 2014. It is a significant deficiency of the new performance reporting framework that targets are not included in performance statements for performance indicators.
This report also highlights that improvements can be made to how local councils account for, monitor and report on development contributions for local infrastructure. Local councils can also strengthen how they identify and manage risks associated with development contributions for local infrastructure.
Yours faithfully

Dr Peter Frost
Acting Auditor-General
25 November 2015
Auditor-General's comments
|
Dr Peter Frost Acting Auditor-General |
Audit team Tim Loughnan—Engagement Leader Ivy Ly—Team Leader Rowan Jennion—Team member Engagement Quality Control Reviewer Ronald Mak |
Victoria's local government sector is recognised in Victoria's Constitution Act as the third tier of government. My report provides an analysis of the 2014–15 financial results and performance statements of the 79 local councils and their financial sustainability risks. It also comments on local councils' management of development contributions to local infrastructure.
The local government sector generated a net surplus of $1.5 billion in the 2014–15 financial year ($923.6 million surplus in 2013–14). The increase was partly attributed to the Commonwealth Government's decision to bring forward the payment of half of the 2015–16 financial assistance grants into the 2014–15 year.
The changed timing for financial assistance grants in 2014–15 also impacted several short-term financial sustainability risk indicator results, leading to a more favourable outcome for the sector. Generally, local councils received a low financial sustainability risk assessment. Notwithstanding, some local councils continue to face the ongoing challenge of maintaining spending on capital works and existing assets at sufficient levels.
For the first time local councils were required to prepare performance statements in accordance with the Local Government Performance Reporting Framework. It is a significant deficiency of the new performance reporting framework that targets are not included in performance statements for performance indicators. Local councils also need to refine their processes around performance data preparation and improve on their quality assurance processes.
My report also highlights that development contributions to local infrastructure are a critical component of Victoria's broader planning system—valued at approximately $815 million in 2014–15. Local councils need an effective framework in place to better account for and manage these development contributions. Specifically, the processes around risk identification and management, monitoring and reporting need to be strengthened.
Disappointingly, 51 per cent (61 per cent in 2013–14) of our previous year's audit findings relating to high- and medium-risk internal control deficiencies are yet to be rectified. Local councils need to be more timely in addressing the issues identified. That these control deficiencies remain unremedied is a very poor reflection on both the management and governance of these councils.
Dr Peter Frost
Acting Auditor-General
November 2015
Audit Summary
Introduction
This report identifies and discusses the key issues in the local government sector, consisting of 79 local councils, that arose during financial audits, and provides an analysis of information included in local council financial reports and performance statements.
Conclusions
The local government sector generated a net surplus of $1.5 billion in the 2014–15 financial year ($923.6 million surplus in 2013–14) and has low financial sustainability risks. However, this has been partly driven by the advance payment of $269.8 million of Commonwealth grants in 2014–15. This strong position may be impacted by the introduction of rate capping in 2016–17.
A new performance reporting regime was introduced for the first time this year. However, there are still areas for improvement and challenges to overcome.
Local councils face the challenge of meeting higher costs associated with the maintenance and management of infrastructure assets over time yet not all local councils that received development contributions for local infrastructure had all the key elements of an effective development contribution management framework in place. Improvements can be made to strengthen the framework around risk identification and management, monitoring and reporting.
Findings
2014–15 financial audits
Clear financial audit opinions were issued for the 79 local councils for the year ending 30 June 2015. This means that Parliament and the public can have confidence in the financial statements of these local councils.
While the general internal control frameworks of local councils were appropriate for financial reporting purposes, in 2014–15 we noted 103 instances of high and medium risk control weaknesses (99 in 2013–14) across the 79 local councils that should be addressed by management as soon as possible. Local councils need to be more timely in addressing the issues identified as part of the audit, as the sector had not resolved 51 per cent of issues raised in prior year audits.
The 2014–15 reporting period was the first year local councils were required to prepare their financial statements in accordance with the Local Government Model Financial Report 2014–15 (the Model) issued by Local Government Victoria (LGV). Our review of the 2014–15 financial reports indicated that there was a sound commitment by the councils to meet the revised requirements and there was considerable less variability in the quality of the financial reports compared to prior years. LGV should seek feedback on the effectiveness of the Model and consider suggestions for improvement.
Financial outcomes
The local government sector generated a net surplus of $1.5 billion in the 2014–15 financial year ($923.6 million surplus in 2013–14). The increase was partly attributed to the Commonwealth Government's decision to bring forward the payment of half of the 2015–16 financial assistance grants into the 2014–15 year. Payment of approximately $269.8 million was made to local councils on 30 June 2015 for 2015–16.
The changed timing for financial assistance grants in 2014–15 also impacted several short-term financial sustainability risk indicators, reporting a more favourable outcome for the sector. Our analysis of the sector shows that local councils as a whole had a low financial sustainability risk assessment. Notwithstanding, some local councils continue to face the ongoing challenge of maintaining spending on capital works and existing assets at sufficient levels.
This strong position may be impacted by the introduction of rate capping in 2016–17.
Performance reporting
The 2014–15 reporting period was the first year local councils were required to prepare information on a prescribed set of performance indicators in accordance with the Local Government Performance Reporting Framework. The new regime requires extensive financial and non-financial information to be disclosed.
The performance reporting processes were generally adequate, however, further refinement is required, on local council's performance reporting processes, including the quality assurance process.
The implementation of a new performance regime inherently presents challenges to the sector and further attention is required by LGV and local councils to address these areas. This includes local councils establishing targets so that they can better interpret their results and make meaningful conclusions about their performance. There is also the need for LGV to refine the definitions included in the Local Government Better Practice Guide 2014–2015: Performance Reporting Framework Indicator Workbook.
Development contributions
The local government sector received development contributions for local infrastructure of approximately $815 million in 2014–15 (approximately $696 million in 2013–14). They are an important component of Victoria's broader planning system. Due to the large value of development contributions and those contributions often being once-off for specific developments, local councils need to have an effective framework in place. There is no existing legislative or other requirements that specify the elements of an effective framework on how local councils should manage these development contributions.
We surveyed all 79 local councils and reviewed three 'case-study' local councils against key elements of an effective development contributions management framework and identified areas for improvement.
Local councils, generally had some elements of an effective development contributions management framework in place. However, improvements can be made to strengthen the framework around risk identification and management, monitoring and reporting.
Recommendations
- That Local Government Victoria seeks feedback from the sector on local council views on the effectiveness of the Local Government Model Financial Report 2014–15 and their suggestions for improvement ahead of the 2015–16 financial year.
That local councils:
- implement appropriate governance and monitoring mechanisms to ensure audit findings are addressed by management on a timely basis
- actively manage and monitor their rate of capital and renewal spending to at least meet the consumption of their assets
- annually review their landfill sites for remediation and aftercare costs and recognise a liability in accordance with the accounting standards
- enhance their performance reporting processes by developing performance statement preparation plans and setting performance indicator targets.
That Local Government Victoria:
- refines and updates the definitions in the Local Government Better Practice Guide 2014–2015: Performance Reporting Framework Indicator Workbook to demonstrate a clearer linkage between the performance objective and the result.
That local councils:
- acquit each development contribution plan by reporting publicly on the development contributions received/unspent and remaining infrastructure required
- include risks associated with development contributions and infrastructure asset delivery in councils' risk register—these risks need to be actively assessed and managed
- prepare a cash flow forecast of at least five years to better manage financial impacts of development contributions
- conduct an internal audit review of development contributions on a periodic basis.
Submissions and comments received
We have professionally engaged with all local councils and the Department of Environment, Land, Water & Planning throughout the course of the preparation of this report. In accordance with section 16(3) of the Audit Act 1994 we provided a copy of this report, or relevant extracts to those agencies and requested their submissions or comments.
We have considered those views in reaching our audit conclusions and have represented them to the extent relevant and warranted. Their full section 16(3) submissions and comments are included in Appendix E.
1 Context
1.1 Introduction
This report details the outcomes of the financial report and performance statement audits of the 79 local councils for the financial year ending 30 June 2015.
Figure 1A outlines the structure of this report.
Figure 1A
Report structure
|
Report part |
Description |
|---|---|
|
Part 1: Context |
Provides an overview of the local government sector, including emerging issues. Discusses the internal control and other financial reporting issues identified during the 2014–15 financial audits and provides an update on prior year issues. |
|
Part 2: Financial outcomes |
Comments on the financial outcomes of the 79 local councils including discussion of key financial issues impacting the sector. Discusses the financial sustainability risks faced by local councils at 30 June 2015. |
|
Part 3: Performance reporting |
Comments on the audit results of the performance statement audits, including an assessment of the new 2014–15 Local Government Performance Reporting Framework. |
|
Part 4: Development contributions |
Comments on the development contributions management framework of the sector, including a detailed analysis of three local councils. |
Source: Victorian Auditor-General's Office.
Pursuant to section 20(3) of the Audit Act 1994, unless otherwise indicated, any persons named in this report are not the subject of adverse comment or opinion.
The total cost of this report was $180 000.
1.2 Victorian local government sector
The Victorian local government sector is recognised in Victoria's constitution as the third tier of government and comprises 79 local councils, 11 regional library corporations and 13 associated entities. For the purposes of this report, only the 79 local councils are referenced as the local government sector.
Local councils are governed by democratically elected councillors and their operations are administered by the council-appointed chief executive officer. Under the Local Government Act 1989, each council operates autonomously and is directly accountable to its constituents.
At 30 June 2015, two councils were operating under administration arrangements, Brimbank City Council (since November 2009) and Wangaratta Rural City Council (since September 2013). This means that they do not have an elected council, and the administrator has been appointed by the state government. These administrative arrangements are expected to expire after the next local government elections in October 2016.
Local council cohorts
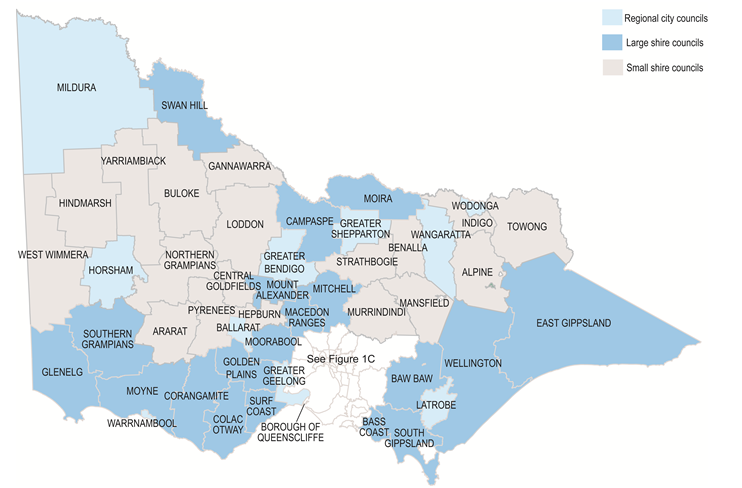
To assist with our analysis of Victorian local councils, particularly in Part 2 of this report, we have classified local councils into five cohorts based broadly on size, demographics and funding. These cohorts are consistent with the classification used by Local Government Victoria (LGV). Appendix A lists the local councils within each category cohort
Figures 1B and 1C provide a visual representation of the local councils that make up each cohort.
Figure 1B
Victorian local government sector
Source: Victorian Auditor-General's Office.
Figure 1C
Victorian local government sector – metropolitan region

Source: Victorian Auditor-General's Office.
1.3 Legislative reforms
The Local Government (Planning and Reporting) Regulations 2014 (the regulations) set out the new financial planning and reporting requirements for the sector, and applied from 1 July 2014. The regulations form part of the Local Government Act 1989.
The regulations require local councils to report against prescribed performance indicators in the report of operations and performance statement in the local councils' annual reports. This is covered in Part 3 of the report.
In addition, the 2014–15 reporting period was the first year local councils were required to prepare their financial statements in accordance with the Local Government Model Financial Report 2014–15 (the Model) as per the regulations.
Our review of the 2014–15 financial reports for the local councils found that there was a sound commitment by the councils to meet the revised reporting requirements. The mandatory model provided standardisation of the financial information reported compared to prior years.
LGV should seek feedback from the sector on local council views on the effectiveness of the Model and their suggestions for improvement ahead of the 2015–16 financial year.
1.4 Opinions
1.4.1 Financial report opinions
Independent audit opinions add credibility to financial reports by providing reasonable assurance that the information reported is reliable and accurate. A clear audit opinion confirms that the financial report presents fairly the transactions and balances for the reporting period, in accordance with the requirements of the applicable accounting standards and relevant legislation.
For 2014–15, 79 clear audit opinions were issued on financial statements of local councils (79 clear in 2013–14).
1.4.2 Performance statement opinions
Performance statements continue to be audited on a fair presentation basis, with all 79 local councils receiving a clear audit opinion.
Wodonga City Council received a clear audit opinion containing an emphasis of matter paragraph to highlight that council had not obtained results for two service performance indicators.
1.5 General internal controls
In conducting our financial audits of the sector, we identified that internal controls we tested during our audit were adequate for maintaining the reliability of financial reporting. Nevertheless, we also identified a number of instances where important internal controls need to be strengthened.
Weaknesses in internal controls that are found during the audit of a council are reported to the mayor or administrator (on behalf of the council), chief executive officer and audit committee in a management letter. Typically, two management letters will be provided throughout a financial audit—an interim and a final.
1.5.1 Current period issues
In 2014–15, across the sector, 103 high and medium control issues were reported through interim and final management letters (99 in 2013–14). Figure 1D shows the reported issues by area and risk. The risk ratings and the expected time lines for the resolution of issues based on the risk used in our management letters are provided in Appendix B.
Figure 1D
2014–15 reported issues by area and risk rating
|
Area of issue |
Risk rating of issue |
||
|---|---|---|---|
|
High |
Medium |
Total |
|
|
Expenditure and accounts payable |
5 |
17 |
22 |
|
Payroll |
3 |
6 |
9 |
|
General ledger |
– |
10 |
10 |
|
Information systems |
10 |
25 |
35 |
|
Revenue |
2 |
12 |
14 |
|
Governance |
– |
5 |
5 |
|
Assets |
1 |
7 |
8 |
|
Total |
21 |
82 |
103 |
Note: Figure 1D excludes low-risk issues.
Source: Victorian Auditor-General's Office.
The most common issues identified relate to information systems. These made up 34 per cent of total high and medium risks reported and accounted for 48 per cent of the total high-risk issues raised in 2014–15. The common information systems control weaknesses reported include:
- inadequate review of access rights and security profiles
- none or an outdated IT policy and procedures relating to IT security and change management.
The maintenance of effective control over the IT systems is a challenge for many local councils, particularly the small and large shire councils with limited access to specialist IT resources. However, the prevalence and extent of reliance on financial and operational IT systems means that local councils must ensure they have adequate IT controls in place.
Internal control issues relating to expenditure identified deficiencies, in particular a lack of segregation of duties where council staff were approving their own purchase orders. Issues around inadequate controls over the security of the payment system were also noted—this included outdated bank signatories.
1.5.2 Status of prior-period issues
The status of prior-period internal control issues identified are also presented and communicated to local councils and their audit committees through audit management letters. These issues are monitored to ensure weaknesses identified by previous audits are resolved promptly. Figure 1E shows the internal control deficiency issues status identified in the prior periods.
Figure 1E
Prior-period internal control deficiency issues—resolution status by risk
|
Issue status |
Risk rating |
||
|---|---|---|---|
|
High |
Medium |
Total |
|
|
Unresolved |
10 |
52 |
62 |
|
Resolved |
6 |
53 |
59 |
|
Total |
16 |
105 |
121 |
Note: Figure 1E excludes low-risk issues.
Source: Victorian Auditor-General's Office.
In the prior period, 121 high- and medium-risk internal control deficiency issues were reported to management for rectification with only 59 resolved within the past 12 months.
Fifty-one per cent of prior-period issues raised remained unresolved at 30 June 2015, of which 13 related to issues outstanding for more than 24 months. This indicates that local councils are not addressing the weaknesses identified in a timely manner, nor following the recommended time lines for the resolution of issues as detailed in Appendix B.
1.6 Emerging events
The following section highlights emerging events that impact the local government sector in the upcoming financial year.
1.6.1 Rate capping
Local councils from 1 July 2016 will be required to cap their annual rate increases to a combination of the Consumer Price Index plus or minus any adjustment set by the Minister for Local Government with any variation to be approved by the Essential Services Commission (the commission).
The commission was tasked to conduct a review on rate capping and report to the ministers for Finance and Local Government on the recommended approach for a rates capping framework for implementation from the 2016–17 financial year. The final report was made available on the commission's website on 22 October 2015 with the recommended time line for the commission to announce the cap in December 2015.
Recommendations
- That Local Government Victoria seeks feedback from the sector on local council views on the effectiveness of the Local Government Model Financial Report 2014–15 and their suggestions for improvement ahead of the 2015–16 financial year.
- That local councils implement appropriate governance and monitoring mechanisms to ensure audit findings are addressed by management on a timely basis.
2 Financial outcomes
At a glance
Background
This Part looks at the financial results of the local government sector for the year ended 30 June 2015. It discusses the main drivers behind key movements impacting the financial performance and position of the sector for the period.
It also analyses the sector against six financial sustainability risk indicators, as well as local council trend data.
Conclusion
The net result for the sector was a surplus of $1.5 billion compared to $923.6 million last year. This increase was partly driven by the advance payment of Commonwealth grants in 2014–15 for 2015–16. The sector also had a low financial sustainability risk assessment. This strong position may be impacted by the introduction of rate capping in 2016–17.
Findings
- Metropolitan, large and small shire local councils have a medium risk rating for their capital replacement ratio and are at risk of not spending enough on capital assets to service the rate of use.
- Regional city local councils continue to be at risk of not spending enough on asset renewal.
- Not all local councils have reviewed and recognised the remediation and aftercare costs of council owned landfills.
Recommendations
That local councils:
- actively manage and monitor their rate of capital and renewal spending to at least meet the consumption of their assets.
- annually review their landfill sites for remediation and aftercare costs and recognise a liability in accordance with the accounting standards.
2.1 Introduction
This Part reviews the financial results and performance of Victoria's local government sector for the 2014–15 financial year. It also assesses the local council cohorts against six financial sustainability risk indicators at 30 June 2015.
This includes comment on the main drivers behind the net result achieved and analysis of local council trend data for selected revenue and expenses streams and capital spend for the preceding five years and forecast data for three years. The forecast data has been prepared by local councils as part of their budget processes and has not been subject to audit. Consequently this information is prospective, unaudited and actual results could vary significantly. Nonetheless it provides an insight to local councils expected outcomes.
2.2 Financial overview of the sector
Figure 2A summarises the key financial balances of the local government sector for the financial year ended 30 June 2015. The sector generated a net surplus of $1.5 billion ($923.6 million in 2013–14).
Figure 2A
Key balances for local government sector for the financial year ended 30 June 2015
|
Cohort |
Revenue |
Expenditure |
Net result |
Net assets |
|---|---|---|---|---|
|
Metropolitan |
3 856.3 |
3 377.8 |
478.5 |
40 251.9 |
|
Interface |
2 148.5 |
1 593.5 |
555.0 |
16 011.0 |
|
Regional city |
1 415.5 |
1 188.7 |
226.8 |
9 651.5 |
|
Large shire |
1 237.5 |
1 074.4 |
163.1 |
9 438.7 |
|
Small shire |
522.2 |
455.0 |
67.2 |
4 030.4 |
|
Total |
9 180.0 |
7 689.4 |
1 490.6 |
79 383.5 |
Source: Victorian Auditor-General's Office.
The interface cohort generated the largest net surplus for the financial year, with a surplus of $555.0 million ($355.0 million in 2013–14). Interface local councils have a larger proportion of grant revenue and development contributions for local infrastructure compared to the other four cohorts as there is greater community and infrastructure development in these areas to service the growing populations. Development contributions are cash payments or in-kind works provided to the local council by developers towards the supply of infrastructure to meet the future needs of local residents. Part 4 of this report analyses the development contributions framework.
Underlying result
The net result of the local government sector includes both operational and capital funding provided to local councils from the state and Commonwealth governments. In addition, local councils received development contributions in the form of monetary (cash) and non-monetary assets (in-kind).
Non-monetary contributions are provided once off for specific developments and do not contribute to the revenue of normal operations. A truer reflection of the performance of the local government sector is to use the underlying result which excludes non‑monetary contributions.
At 30 June 2015, the local government sector reported an underlying surplus of $881.7 million. Figure 2B shows the aggregate underlying result compared to the net result of the local government sector for the financial years 2011 to 2015. The difference is due to the exclusion of non-monetary contributions in the underlying result—accounting for approximately $600 million each year.
Figure 2B
Local government sector results for financial years 2011 to 2015
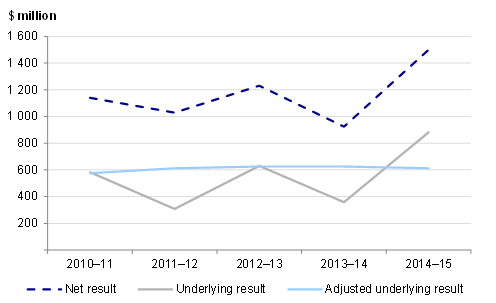
Note: Net result is calculated by subtracting a council's total expenses from the total revenue, in a given period of time. Underlying result is the net result adjusted for non-monetary contributions. Adjusted underlying result is the underlying result adjusted for any timing differences of financial assistance grants and call from the defined benefit superannuation fund.
Source: Victorian Auditor-General's Office.
The higher underlying surplus in 2014–15 was partly attributed to the Commonwealth's payment of $269.8 million (50 per cent) of the 2015–16 financial assistance grants in the current year. Local councils have effectively received 18 months of financial assistance grants in 2014–15 ($811.5 million) compared to six months of financial assistance grants in 2013–14 ($265.9 million). The Commonwealth can bring forward payments of financial assistance grants under the Federal Financial Relations Act 2009.
Government grants are the second largest source of revenue for the local government sector—accounting for 20 per cent (16 per cent in 2013–14) of total revenue. Therefore any change in the timing of cash receipts clearly impacts a local council's underlying result.
For comparison, Figure 2B also shows the underlying result adjusted by removing any timing difference of the financial assistance grants over the past five years and the additional expenditure relating to the call from the defined benefit superannuation fund to address the funding shortfall in 2012–13.
This shows that the underlying surplus has been relatively consistent with approximately a $50 million margin across the five financial years.
Revenue
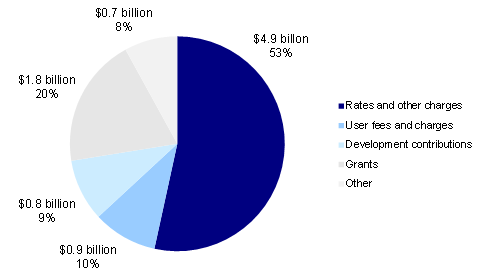
Total revenue of the sector was $9.2 billion in 2014–15 ($8.24 billion in 2013–14).
Figure 2C details the main categories of revenue raised by the local government sector in 2014–15.
Figure 2C
Local government sector revenue composition, 2014–15
Source: Victorian Auditor-General's Office.
Rates and other charges are the main source of revenue for the sector. In 2014–15, rates and charges made up $4.9 billion or 53 per cent (56 per cent in 2013–14) of total revenue generated for the year.
Development contributions revenue accounted for 9 per cent of total revenue. Part 4 of this report analyses the types of development contributions received.
Expenses
Total expenditure for the sector was $7.7 billion in 2014–15 ($7.3 billion in 2013–14). Figure 2D details the main categories of expenditure for the sector in 2014–15.
Figure 2D
Local government sector expenditure composition, 2014–15
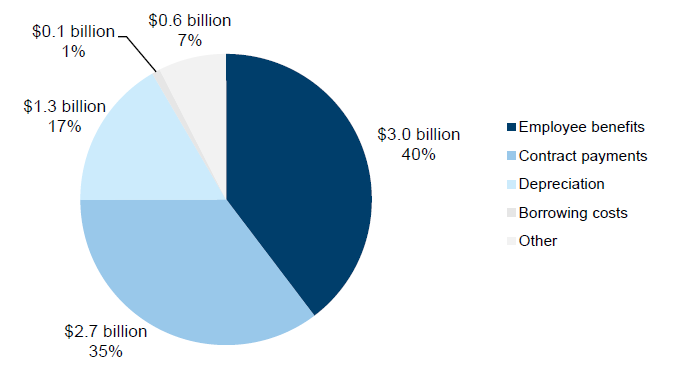
Source: Victorian Auditor-General's Office.
Employee benefits represented 40 per cent of total expenditure and were the key driver in the increase in expenditure in 2014–15. Employee benefits have increased by $131.5 million or 4.5 per cent compared to the prior year but has remained the same as a proportion of total expenditure.
Assets
At 30 June 2015, the sector had total assets of $82.6 billion, an increase of $4.7 billion, or 6 per cent, compared to the prior year. Property, plant, equipment and infrastructure assets represented 93.8 per cent of total assets.
The $4.7 billion increase is attributable to:
- $2.0 billion from asset acquisitions
- $2.6 billion from the revaluation of land, buildings and infrastructure assets
- $0.1 billion from development contribution assets and the recognition of assets already controlled by councils not previously recorded (found assets).
Figure 2E shows the value of asset revaluation across the various asset categories for the local government sector in 2014–15 and 2013–14.
Figure 2E
Asset revaluation on various asset categories for the sector in 2014–15 and 2013–14
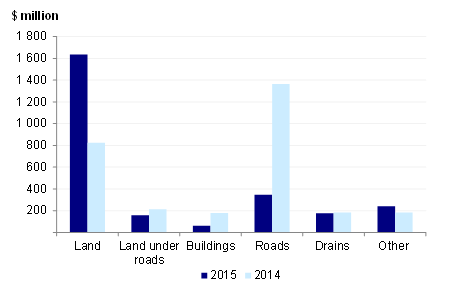
Source: Victorian Auditor-General's Office.
The increase in asset revaluation for 2014–15 was primarily due to land revaluations by the metropolitan cohort of local councils, accounting for 98 per cent of the increase.
Most local councils have a two-year revaluation cycle for their land and building assets. In between years, an interim valuation exercise is performed to consider whether there has been significant movements in the values of these assets which will result in a formal revaluation to occur.
In 2014–15, nine (41 per cent) of metropolitan councils identified material movements in the values of their land holdings since the last revaluation. These local councils either conducted a formal revaluation or applied indices to determine the value of the revaluation to be included in their financial reports.
Local councils should have a formal review in place to review their land values in a non-revaluation year. This is even more important when local councils have revaluation cycles greater than two years as the fluctuation in the land carrying value will be greater and local councils may not be recording their land assets at their fair value.
Liabilities
At 30 June 2015, the local government sector had combined liabilities of $3.3 billion, an increase of $235.4 million or 7.8 per cent in comparison with the prior year.
Figure 2F details the main categories of liabilities for the 2014–15 financial year.
Figure 2F
Local government sector liabilities composition, 2014–15
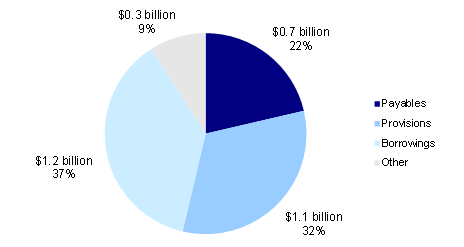
Source: Victorian Auditor-General's Office.
Borrowings accounted for $1.2 billion or 37 per cent of total liabilities. This is a net increase of $50 million or 4.3 per cent from the prior period ($1.2 billion in 2013–14). The increase in borrowings is mainly driven from new borrowings by:
- Maroondah City Council of $24.2 million to partly fund the construction of Aquanation—an aquatic and leisure centre in Ringwood
- Greater Geelong City Council of $27.7 million to fund the Geelong Library and Heritage Centre, Drysdale Landfill and four integrated children's centres.
Provisions include employee benefits provisions and landfill provisions, and accounted for $1.1 billion or 32 per cent of total liabilities.
Landfill remediation and rehabilitation provision
In accordance with Environment Protection Act 1970 enforced by the Environment Protection Authority (EPA), landfill operators are required to effectively management landfill sites.
There are three components that address different aspects of site operation, closure and post-closure liabilities. The three components are:
- remedial action—costs incurred to address pollution
- site rehabilitation—cost of works to close the landfill
- site aftercare—cost of care of the landfill cap and pollution prevention infrastructure.
Local councils need to define and plan for remediation liabilities so they do not expose ratepayers to marked rate increases to cover costs that could have been foreseen. The EPA requires closed landfills to be rehabilitated and then cared for over a period of up to 30 years or more.
In 2014–15, 52 local councils recorded a provision for landfill remediation or rehabilitation works of $304.0 million. This is an increase of $61.2 million or 25 per cent since 2013–14. The increase is due to additional remediation works set out in the new regulations by the EPA issued in October 2014. The new regulations require rehabilitation throughout the life of the landfill, as opposed to just when the landfill ceases to operate. In addition, the standard of works required has been raised and as a result local councils are faced with higher costs to remediate landfill sites. Due to the new standard of works and length of time required, not all local councils have reviewed and recognised the associated costs for remediation and after care costs of council owned landfills.
Our audit report Managing Landfills, tabled in September 2014, identified that local councils had poor operational practices in managing landfill risks to the environment, human health and amenity and there is inadequate rehabilitation at active landfills and shortfalls in after care of closed sites.
From a financial reporting perspective, a liability for site remediation costs during the period of operation of the landfill or after care costs is to be recognised in accordance with AASB 137 Provisions, Contingent Liabilities and Contingent Assets. If the recognition criteria are not able to be satisfied—for example, due to an inability to reliably estimate the cost of remediation—a contingent liability is to be disclosed.
From our review, 13 local councils (16 per cent of all local councils) had not performed a formal review of their provision for landfill. As a result, the amount disclosed in their financial statements may not be sufficient.
2.3 Financial sustainability risks
To be financially sustainable, local councils should aim to generate sufficient revenue from operations to meet their financial obligations, and to fund asset replacement and asset acquisitions.
We use six financial sustainability risk indicators over a five-year period to assess the potential financial sustainability risks in the local government sector. Appendix C describes the financial sustainability indicators, risk assessment criteria and benchmarks we use in this report. Figure 2G summarises the financial sustainability risk ratings for the sector for 30 June 2015 based on local council cohorts. The financial sustainability risk indicators are calculated using the financial transactions and balances of each local council's financial report.
Figure 2G
Financial sustainability risk indicators for the local government sector at 30 June 2015
|
Indicator |
Industry average |
Metro average |
Interface average |
Regional average |
Large shire average |
Small shire average |
|
|---|---|---|---|---|---|---|---|
|
2010–11 to 2014–15 |
2014–2015 |
||||||
|
Net result ratio |
12.68% |
15.42% |
12.14% |
24.33% |
15.44% |
12.59% |
12.62% |
|
Liquidity ratio |
2.17 |
2.29 |
1.99 |
2.49 |
1.87 |
2.36 |
2.76 |
|
Internal financing ratio |
117.98% |
148.75% |
169.46% |
155.14% |
122.45% |
155.14% |
150.00% |
|
Indebtedness ratio |
25.23 |
26.70 |
16.34 |
32.86 |
32.45 |
32.74 |
19.12 |
|
Capital replacement ratio |
1.61 |
1.54 |
1.50 |
1.86 |
1.69 |
1.26 |
1.38 |
|
Renewal gap ratio |
1.10 |
1.05 |
1.14 |
1.06 |
0.98 |
1.01 |
1.04 |
Note: A yellow result means a medium-risk assessment and a green result means a low-risk assessment.
Source: Victorian Auditor-General's Office.
Net result ratio
As a whole, the net result for the local government sector has significantly improved in 2014–15 compared to the prior year. The combined net result was a surplus of $1.5 billion compared to $923.6 million in 2013–14. The increase was partly attributed to the Commonwealth's payment of $269.8 million, 50 per cent of the 2015–16 financial assistance grants in the current year. Local councils have effectively received 18 months of financial assistance grants in 2014–15 ($811.5 million) compared to six months of financial assistance grants in 2013–14 ($265.9 million).
Ten local councils would have reported a net deficit if the financial assistance grants were not paid in advance compared to two (13 in 2013–14).
Liquidity ratio
This is a measure of a local council's ability to pay their existing current liabilities in the next 12 months. In 2014–15, the liquidity ratio has improved from already good levels. Again this is primarily due to the Commonwealth Government bringing forward the payment of half of the 2015–16 financial assistance grants into the 2014–15 year, which increased councils' cash balances by a total of $269.8 million.
In addition, 30 local councils entered into the Local Government Funding Vehicle (LGFV) debt procurement in September 2015. This allowed them to refinance previously held short-term debt over terms longer than 12 months.
The LGFV was established by the Municipal Association of Victoria to provide debt financing to local councils. These borrowings require interest only repayments until maturity of the debt in five or seven years.
Capital replacement ratio
The capital replacement indicator illustrates whether local councils are spending more on new assets than the council's depreciation costs. The ratio for the sector of 1.54 has deteriorated in 2014–15 compared to the sector average of 1.61 over the past five years.
The ratios for the metropolitan and small shire cohorts have deteriorated in 2014–15 compared to the prior period, moving from green to yellow (2013–14 metro 1.71, small 1.78). Large shire cohorts continue to have a medium risk rating of 1.26 (1.45 in 2013–14). This indicates that the rate of capital spending in 2014–15 did not match the consumption of councils' assets—as represented by depreciation and amortisation. The decline reflected the impact of the revaluation of land and infrastructure assets in 2013–14 for these cohorts. Depreciation expense increased in the year following the revaluations as a result of higher asset values.
Renewal gap ratio
The renewal gap compares the rate of spending through renewing, restoring and replacing existing assets with the rate assets are depreciated. Spending more than the rate an asset is used indicates that an entity is sufficiently renewing its assets.
Again the sector average of 1.05 for 2014–15 has fallen below the five-year sector average of 1.10, primarily due to a decline for the small shire local councils (1.50 in 2013–14 to 1.04 in 2014–15). Small shire local councils must actively monitor their rate of spend and remain focused on maintaining their assets at serviceable levels as they age, to enable them to service community needs and expectations.
Regional city councils continue to report a medium risk rating 0.98 (0.95 in 2013–14) and is the only local council cohort that had a medium risk rating. Regional city councils have established assets, but they also service as proxy centres to the large and small shire councils geographically located around them. As a consequence they will need to continue to focus on spending on renewing and maintaining existing assets while looking to stimulate economic growth in the area. This is evidenced by 60 per cent (70 per cent in 2013–14) of regional city local councils having a renewal gap ratio of less than 1.00.
2.4 Trend analysis and outlook
Figure 2H shows the five-year trend from 2010–11 to 2014–15 and forecast (2015–16 to 2017–18) for rates and charges, user charges, employee benefits, material and services and capital spend.
The analysis is based on the audited financial data from 2010–11 to 2014–15 for all local councils. The 2015–16 to 2017–18 forecasts are based on unaudited 2015–16 local council published budgets. Actual results could vary significantly.
Figure 2H
Trend and forecast result for the local government sector
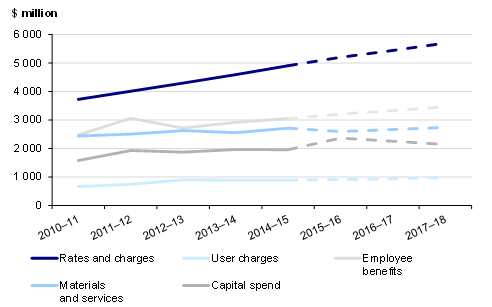
Source: Victorian Auditor-General's Office.
Rates and charges have increased by an average of 5.7 per cent from 2010–11 to 2014–15. These increases have been largely offset by an average annual increase of 4.3 per cent in employee benefits for the same period. Material and services have increased at an average of 2.2 per cent (1.9 per cent in 2013–14).
Future impacts
With rate capping coming into effect in 2016–17, local councils will be required to cap their annual rate increases to reflect a combination of the Consumer Price Index plus or minus any adjustment set by the Minister for Local Government. Local councils will have to reduce expenditure, and/or rely on alternative revenue sources—such as user fees and charges—to supplement their revenue, as well as borrowings to enable them to continue providing the services required by the community and to maintain their assets. Alternatively, any variation to the rate cap will need to be approved by the Essential Services Commission.
The forecasts from 2015–16 to 2017–18 shows rate revenue, user charges and employee benefits increase broadly in line with historical trends.
At the time of this report, local councils could not include rate capping impacts in their 2014–15 budget as the proposed legislation has not been approved by Parliament. Local councils need to forward plan the impact rate capping will have on their budgets, and the actions they will need to take to prevent reductions in the services they are able to provide to their communities.
Recommendations
That local councils:
- actively manage and monitor their rate of capital and renewal spending to at least meet the consumption of their assets
- annually review their landfill sites for remediation and aftercare costs and recognise a liability in accordance with the accounting standards.
3 Performance reporting
At a glance
Background
This Part covers the results of the 2014–15 audits of local council performance statements. It also details how well prepared local councils were in reporting a mandatory set of measures for the first time in accordance with the Local Government Performance Reporting Framework.
Conclusion
Parliament can have confidence in the fair presentation of the performance statements of all 79 local councils as they all received clear audit opinions for 2014–15.
A new performance reporting regime was introduced for the first time this year. However, there are still areas for improvement and challenges to overcome.
Findings
- Wodonga City Council received a clear audit opinion containing an emphasis of matter paragraph to highlight that the council had not obtained results for two performance indicators.
- Thirty-six local councils had poor document management systems and processes which resulted in inefficiencies and year end delays to the audit process.
- There are no targets set in the new Local Government Performance Reporting Framework.
Recommendations
- That local councils enhance their performance reporting processes by developing performance statement preparation plans and setting performance indicator targets.
- That Local Government Victoria refines and updates the definitions in the Local Government Better Practice Guide 2014–2015: Performance Reporting Framework Indicator Workbook to demonstrate a clearer linkage between the performance objective and the result.
3.1 Introduction
This Part covers the results of the audits of the 2014–15 performance statements of local councils and details amendments to the Local Government Act 1989 that are designed to enhance performance reporting by local councils. The Local Government Amendment (Performance Reporting and Accountability) Act 2014 and associated regulations were introduced and set out the new performance reporting framework applicable from 1 July 2014 onwards. This framework is designed to ensure that all councils are measuring and reporting on their performance in a consistent and meaningful way.
Our audits of local councils' performance statements provided opinions on whether the reported results were fairly presented. The opinions do not conclude on the relevance or appropriateness of the reported performance information as they are set by legislation.
3.2 Conclusion
Performance statements continue to be audited on a fair presentation basis, with all local councils receiving a clear audit opinion.
Wodonga City Council received a clear audit opinion containing an emphasis of matter paragraph to highlight that council had not obtained results for two service performance indicators.
The performance reporting processes were generally adequate, however, further enhancement is required on local council's performance reporting processes, including the quality assurance process.
The implementation of a new performance regime inherently presents challenges to the sector and further attention is required by Local Government Victoria (LGV) to address these areas. This includes local councils establishing targets so that they can better interpret their results and make meaningful conclusions about their performance. LGV also needs to refine the definitions included in the Local Government Better Practice Guide 2014–2015: Performance Reporting Framework Indicator Workbook (indicator workbook).
3.3 Local Government Performance Reporting Framework
The Local Government (Planning and Reporting) Regulations 2014 (the regulations) sets out the new financial planning and reporting requirements for the sector, and applied from 1 July 2014. The regulations form part of the Local Government Act 1989.
This is the first year local councils were required to prepare information on a prescribed set of performance indicators in accordance with the Local Government Performance Reporting Framework (LGPRF) as specified in the regulations. The new regime requires extensive financial and non-financial information to be disclosed within the Report on Operations (unaudited) and Performance Statement (audited). Figure 3A summarises the number of performance indicators prescribed by the new framework.
Figure 3A
Local Government Performance Reporting Framework indicator areas and sets
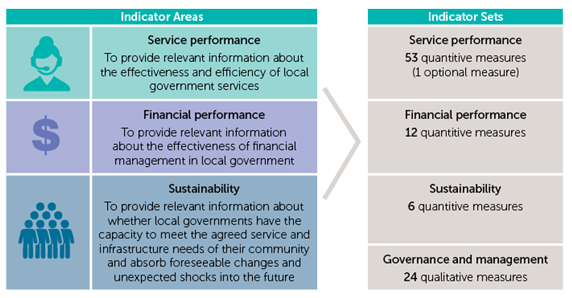
Source: Local Government Better Practice Guide 2014–2015: Performance Reporting Framework Indicator Workbook prepared by LGV.
Local councils must have appropriate systems and processes in place to enable complete and accurate performance reporting.
3.4 Performance audit opinions issued
Clear audit opinions were issued on all local council performance statements for 2014–15. A clear audit opinion confirms that the actual results in the performance statement were fairly presented in accordance with legislative requirements.
Audit opinions that include an emphasis of matter draw the reader's attention to a matter or disclosure in the performance statement that provides important context, but still concludes that the entity's financial information is presented fairly and can be relied upon by users.
Wodonga City Council received a clear audit opinion containing an emphasis of matter paragraph to highlight that the council had not obtained results for two service performance indicators.
3.5 Performance reporting
The performance statements should be subject to an internal quality assurance process.
Figure 3B sets out the best practice elements local councils should aim for to assist them to produce a complete, accurate and compliant performance statement within the legislative time frame.
Figure 3B
Selected better practice–performance statement preparation
|
Key area |
Better practice |
|---|---|
|
Performance statement preparation plan |
Establish a plan that outlines the process, resources, milestones, oversight and quality assurance practices required in preparing the performance statement. |
|
Staff competency |
The preparers of the performance statement have a good understanding of, and experience in, applying relevant requirements and legislation. They also have effective project management and interpersonal skills. |
|
Quality control and assurance procedures |
Require rigorous review of the supporting documentation, data and the performance statement itself by an appropriately experienced and independent officer prior to providing it to the auditors. Establish mechanisms for quality assurance to include:
|
|
Supporting documentation |
Prepare high-standard documentation to support and validate the performance statement, and provide a management trail. |
|
Audit committee engagement |
Audit committee actively engaged in the quality assurance process throughout the year, by challenging the information presented to them, so that accuracy and completeness of the performance statement can be achieved. |
Source: Victorian Auditor-General's Office.
We assessed the performance of the local government sector against the best practice criteria set out in Figure 3B. The results of our assessment are discussed in the following sections.
Performance statement preparation plan
The quality of an entity's performance reporting can be measured by the timeliness and accuracy of the preparation and finalisation of its performance statements. To achieve cost-effective performance reporting, local councils need to have well planned and managed performance report preparation processes.
Forty-one local councils (52 per cent) have developed a performance statement preparation plan which includes critical tasks to be completed, time lines for completion and clearly assigned responsibilities for individuals. Disappointingly, 10 local councils (13 per cent) had not prepared a performance statement preparation plan. The remaining local councils had some elements of a performance statement preparation plan. Those local councils that had not prepared or only had some elements of a performance statement preparation plan experienced inefficiencies which became more costly as additional time was required by their staff to prepare the performance statement.
Staff competency
The quality of information underpinning a performance statement is dependent on it being managed carefully and completely. It is vital that people handling the information understand and act in accordance with the required measures and procedures. This includes being trained and kept up to date with any changes in the performance measures.
It is highly desirable that a performance statement preparation plan is developed, communicated to all relevant parties and tracked against actual performance by a coordinating staff member. Accordingly, for this process to be effective, local councils should assign specific staff with the responsibility for the coordination of the LGPRF.
We found that local councils that had a coordinating staff member who understood the requirements of the LGPRF, who also checked and validated the data before presenting for audit, were able to produce their performance statement more efficiently. Local councils' whose staff member only consolidated data without checking its completeness and accuracy, experienced additional rework.
Quality control over data and assurance procedures
The indicator workbook details each of the performance indicators and provides guidance on each indicator. It also details the evidence and data source that should be retained as audit evidence.
The performance statement should be subject to an internal quality assurance process. However, our review of the performance reporting process indicated that this was not always the case.
Forty local councils (51 per cent) performed a basic level of quality control and assurance procedures during the performance statement preparation process. This includes checking that the data complied with the indicator workbook. However, six local councils (8 per cent) had not performed any quality control or assurance procedures over the data they produced. The remaining local councils had a detailed control and assurance process in place.
Supporting documentation
Local councils should establish procedures for the collection, storage and retrieval of performance data. This will ensure that the performance data is sound, complete and accurate to support the performance statement.
It is better practice to maintain a central repository of documentation on methodology, processes for collection of data and the management of performance data. This aids consistency and continuity of measurement and makes it less likely that systems are not unduly reliant on the knowledge of specific individuals.
Thirty-six local councils either did not initially have the data readily available or their systems had limitations in producing the data required. Local councils had to invest a substantial amount of time and resources to establish processes to enable meaningful data to be collected.
We found 25 local councils with performance statement issues relating to:
- a lack of or no documentation to support the indicator results
- where there was supporting documentation there were errors, as it did not meet the definition in the indicator workbook.
In addition, where a local council had an internal audit review performed, the preparedness of the local council and the quality of the data supporting the LGPRF was of a higher standard than other local councils.
Audit committee engagement
LGV's Better Practice Guides highlight the responsibilities of all parties involved in the performance reporting process—including executive management team, audit committees and councillors. As indicated previously, it is important that local councils take a structured approach, involving all these parties, to ensure the results are in line with the requirements of LGPRF.
3.6 Challenges
The implementation of a new performance regime, such as the LGPRF, can be daunting. The following section identifies the key challenges local councils faced in reporting in accordance to the LGPRF.
No targets or comparison
One of the challenges of first year implementation was that there were no targets or benchmark measures established by local councils or by LGV. This made it difficult for council and the readers of performance statements to assess how well the council had performed. Local councils were encouraged to include some relevant commentary in their performance statements where it provided useful information for the readers—otherwise the results presented alone were less meaningful.
Resource constraints
For smaller councils in regional and rural areas, resource constraint was a major obstacle faced in seeking to implement key components of a robust and effective performance reporting regime. These councils were reluctant to draw resources away from service delivery activities. However, they needed to acknowledge the importance of monitoring and reporting on the efficiency and effectiveness of service delivery to optimise outcomes, minimise wastage and enable early identification and resolution of emerging issues.
Indicator workbook
The indicator workbook details each of the performance indicators and provides guidance on the definitions and how to compute each indicator.
As this is the first year the LGPRF has been introduced, refinement of the definitions used for each indicator should be considered to ensure they are appropriate to support strategic decision-making and continuous improvement by councils. From our review, we identified:
- definition of certain indicators were subject to interpretation
- definition of certain indicators did not capture council current practices or current community needs.
Figure 3C provides an example of an indicator where the definition can be improved to include other library services to reflect current community needs and is a better reflection of performance to be in line with the objective of the indicator.
Figure 3C
Active library members
|
Service performance indicator No. 22 – Active library members Defined as the percentage of the municipal population that are active library members. The broad objective of this indicator is that library resources should be free, accessible and well utilised. High or increasing participation suggests an improvement in the effectiveness of library services. However, the definition in the indicator workbook specifically excludes e-books and does not include the use of library for any other services or programs such as Story Time or the use of public internet terminals. As per the Ministerial Advisory Council on Public Libraries' Review of Victorian Public Libraries Stage 2 Report (November 2013) there has been a slight decrease in loans and membership, but there has been an increase in the use of other services developed by libraries to respond to changing community needs. Victorian public libraries are experiencing increased use in electronic resources and the use of public library computers or Wi-Fi services during the year. Excluding the use of these services in the calculation of the performance measure clearly undermines the use of library services. |
Source: Victorian Auditor-General’s Office and the Local Government Better Practice Guide 2014–2015: Performance Reporting Framework Indicator Workbook.
3.7 Going forward
3.7.1 Comparing performance
At the sector level, the performance reporting results of all 79 local councils will be made available on LGV's 'Know your council' website where users can make comparisons.
Performance measurement can be more meaningful when appropriate comparisons are developed and provided over a period of time. Currently with no targets or previous results, the full benefit of performance reporting will not be achieved. It is a significant deficiency of the new performance reporting framework that targets are not included in performance statements for performance indicators.
Local councils should review and assess their results by comparing to similar councils, learn from better performing peers and continuously improve.
3.7.2 Post Implementation
The implementation of LGPRF should be assessed to determine if expectations were met and what gaps remain to be resolved. It is important local councils provide feedback to LGV on their experience and put forward suggestions for future improvement.
Recommendations
- That local councils enhance their performance reporting processes by developing performance statement preparation plans and setting performance indicator targets.
- That Local Government Victoria refines and updates the definitions in the Local Government Better Practice Guide 2014–2015: Performance Reporting Framework Indicator Workbook to demonstrate a clearer linkage between the performance objective and the result.
4 Development contributions
At a glance
Background
This Part reviews development contributions for local infrastructure received by councils during 2014–15, and the framework used by local councils to manage and maintain the process.
Conclusion
Councils generally maintained appropriate policies to deal with development contributions. Improvements can, however, be made to strengthen the framework around risk identification and management, monitoring and reporting.
Findings
Review of the 59 local councils with development contributions greater than $1 million in 2014–15 found:
- forty did not formally manage risks arising from development contributions
- twenty-two did not provide acquittal report to senior management and/or councillors
- fifty-two have not conducted an internal audit review of the management of development contributions in the past three years
- thirty-three have no policy covering the management of development contributions
- sixteen did not meet key milestones as set out in the development contributions plan.
Recommendations
That local councils:
- acquit each development contribution plan by reporting publicly on the development contributions received/unspent and remaining infrastructure required
- include risks associated with development contributions and infrastructure asset delivery in council's risk register—these risks need to be actively assessed and managed
- prepare a cash flow forecast of at least five years to better manage financial impacts of development contributions
- conduct an internal audit review of development contributions on a periodic basis.
4.1 Introduction
Development contributions are cash payments or in-kind capital works provided by developers towards the supply of infrastructure to support new land developments.
Development contributions are mainly used to provide:
- development infrastructure—such as roads, bicycle paths, drainage and public open space
- community infrastructure—such as buildings and facilities for community or social purposes.
4.2 Conclusion
Local councils receiving development contributions generally maintained appropriate policies to deal with them.
Improvements could be made to strengthen the framework around risk identification and management, monitoring and reporting.
4.3 Legislative framework
There are three Acts that govern the development contributions system—the Planning and Environment Act 1987 (PE Act), the Subdivision Act 1988 and the Local Government Act 1989.
Planning and Environment Act 1987
The PE Act is the main statute covering development contributions. Under this Act, local councils may collect contributions as part of development contributions plans (DCP), voluntary agreements and the planning and building permit processes.
Development contributions plans
For new and large-scale urban development, councils can use formal DCPs to set out the type of infrastructure that is to be developed for a defined area, and the specific levies that developers will be required to pay. These levies are development infrastructure levies and community infrastructure levies.
Development infrastructure levies can be indexed annually to be consistent with costs, and are collected through the planning permit process. Community infrastructure levies are fixed for the life of the DCPs and are also collected during the building permit process.
DCPs are generally prepared by local councils as the responsible authority. However, if the council is within the Urban Growth Zone, the Metropolitan Planning Authority will prepare the DCPs on council's behalf.
The PE Act also requires local councils to maintain proper accounts of DCP levies paid in accordance with the Local Government Act 1989, to use the funds for the purposes intended, and to refund unspent levies or seek ministerial approval to use them for another purpose.
Voluntary agreements
Section 173 of the PE Act provides the mechanism for formalising a voluntary agreement between the local council, landowners and other parties on matters relating to the use and development of land. These agreements can also include obligations for development contributions, and set out the time frames and responsibilities for the provision of associated infrastructure.
Collection of contributions resulting from section 173 agreements also occurs as a condition of the planning permit.
Subdivision Act 1988
The Subdivision Act 1988 authorises councils to collect contributions from developers for purchasing and developing public open space.
When a site is being subdivided into two or more lots, councils can levy developers for a land or cash contribution of up to 5 per cent of the site value. These contributions are collected through conditions imposed on subdivision permits.
Local Government Act 1989
The Local Government Act 1989 requires councils to implement sound financial management, including management of the financial risks associated with development contributions. It also directs councils to collect all the funds that are due to them, provide quarterly financial reporting to open council meetings and have adequate internal control systems in place.
Future changes
The state government passed the Planning and Environment Amendment (Infrastructure Contributions) Act 2015 in September 2015 which creates a new option for councils when land is under development. The new Infrastructure Contributions Plans will start in early 2016 for new growth areas and strategic development areas. Councils will be able to set a standard levy to fund local infrastructure which may be indexed annually. A new additional supplementary levy will be applied when the standard levy cannot adequately fund the required infrastructure.
The updated legislation also includes annual reporting provisions on the amount and use of levies collected by local councils to the Minister for Planning.
4.4 Development contributions
The local government sector received development contributions of approximately $815 million in 2014–15 (approximately $696 million in 2013–14). Figure 4A shows the value and proportion of development contributions received by type in 2014–15 and 2013–14.
Figure 4A
Value of development contributions revenue by type
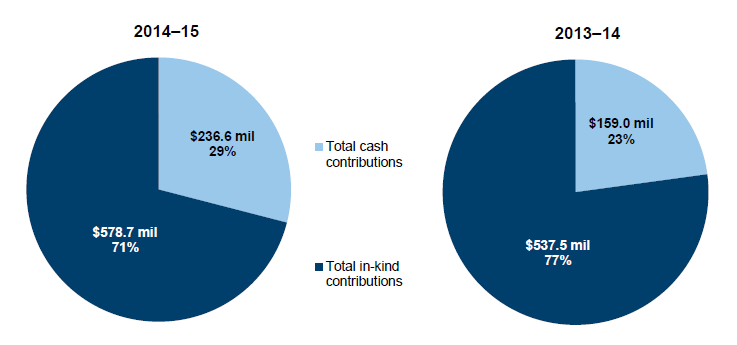
Source: Victorian Auditor-General's Office.
Most of the development contributions are in-kind contributions. As it is council's decision to accept cash contributions or in-kind contributions, this indicates an overall preference by councils for in-kind contributions. This decision can be influenced by a number of factors including the level of cash available to council, a cost-benefit assessment of receiving in-kind contributions over cash contributions, the stage of development and size of the developer's expected contribution.
Type of development contributions received
Local councils often use cash development contributions to purchase land for open spaces, or to construct infrastructure. However, where a developer is providing multiple infrastructure assets in the same area, there is the opportunity to spread initial set-up costs over more jobs.
Figure 4B shows the top 10 local councils that received the largest amounts of development contributions in 2014–15, accounting for 66 per cent of all local council contributions received. These local councils are mostly situated in the growth corridors of Melbourne and have a section of the Urban Growth Zone within their boundaries with the exception of Melbourne City Council.
Figure 4B
Top 10 local councils with development contributions greater than $1 million
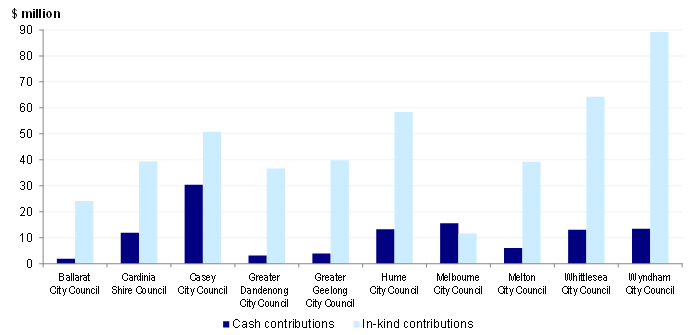
Source: Victorian Auditor-General's Office.
4.5 Snapshot of reviewed local councils
Fifty-nine local councils individually collected development contributions greater than $1 million during the year through formal DCPs or section 173 agreements. Of these, 23 used formal DCPs and 57 used section 173 agreements.
We have selected three local councils for a more detailed review of local councils that received contributions exceeding $1 million, with a focus on DCPs. Figure 4C provides a brief overview of each of the three councils.
Figure 4C
Overview of local councils reviewed
|
Melton City Council covers an area of 527 km2 with an estimated population of 133 752. The council is experiencing significant urban growth and this places increased pressure on it to provide the necessary supporting infrastructure such as roads, community facilities and open space. Melton currently has six DCPs that have been incorporated into their planning scheme and a further seven being prepared. The value of development contributions expected to be raised by both current and planned DCPs is in excess of $1.0 billion. City of Whittlesea is located in Melbourne's north, about 20 kilometres from the Central Business District with an area of 490 km2 and an estimated resident population of 194 500 which has grown by an average of 8 500 annually in the past four years. This growth is expected to continue as the existing DCPs continue to be developed. There are currently eight DCPs and it is expected three new DCPs and one Infrastructure Contributions Plan will be approved within the year. Greater Geelong City Council is located in south-western Victoria with an area of 1 247 km2 and an estimated population of 225 000. Development contributions are mostly levied through DCPs for all new large scale development areas, section 173 agreements for all medium sized development and planning permit conditions for small scale developments. The council currently has seven DCPs, totalling $482.0 million over a 20-year period. |
Source: Victorian Auditor-General's Office.
4.6 Development contribution plans
A DCP details a minimum level of development and community infrastructure that must be built and funded through development and community infrastructure levies, which are set in the DCP. It does not fund additional infrastructure, community facilities or asset expansion not listed in the DCP. For example, if a local council wants to add a skate ramp or basketball court to a park, it must self-fund these works.
Local councils face the challenge of meeting higher costs associated with the delivery of assets over time yet the community infrastructure levies are not indexed to keep up with the cost of the project. When levies are not enough to cover the final cost of infrastructure, local councils need to find alternative funding sources to cover any shortfall. The new Infrastructure Contributions Plans starting in early 2016 will provide local councils with an additional supplementary levy on top of the standard levy to fund the required infrastructure, however, this will not be available for existing developments.
4.7 Development contribution management framework
Local councils received approximately $815 million of development contributions in 2014–15. Due to the high value of development contributions, an effective framework needs to be in place to ensure the most efficient, effective and appropriate use of these funds. A strong framework includes maintaining a relevant and current policy, implementing effective management practices and having appropriate governance, monitoring and reporting.
Figure 4D shows the interrelated nature and elements of an effective development contributions management framework.
Figure 4D
Key elements of an effective development contribution management framework
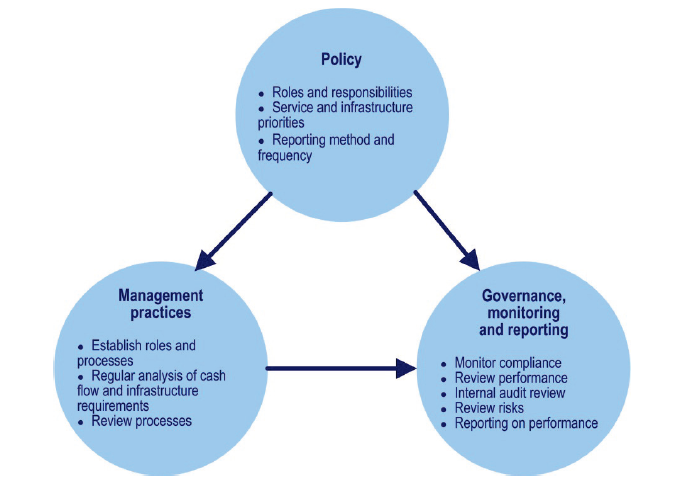
Source: Victorian Auditor-General's Office.
4.7.1 Policy
Local councils need to follow legislation as well as government policy. Setting clear and relevant internal policies that cover significant council activities is necessary to ensure requirements are well understood and incorporated in the development contribution activities.
This is essential for local councils to meet their obligations in a transparent, accountable and cost-effective manner. Our review identified that 33 local councils (60 per cent) did not have documented policies covering development contributions. Of those with policies, only 15 (58 per cent) had been reviewed in the past four years while 11 (42 per cent) had not been reviewed on a regular basis.
4.7.2 Management practices
To ensure compliance with council policies, maintain appropriate internal controls and deliver planned local infrastructure, management need to coordinate sufficient resources to manage all development contribution activities.
Our review of management practices identified:
- forty local councils (68 per cent) appointed a staff member to coordinate, monitor and report on development contributions, consequently 19 local councils did not
- managing contributed funds was the responsibility of the finance department at 36 local councils (61 per cent), with the remainder under planning or infrastructure departments.
When councils have not appointed a staff member to coordinate, monitor and report on development contributions, or establish clear responsibilities, there are increased risks to realising efficient, effective and appropriate use of these funds.
Internal and external reporting
Regular internal reporting on DCPs to senior management and council concerning their status, forecasts and outcomes should be provided at least annually or when needed. Twenty-two local councils (37 per cent) did not provide acquittal reports on development contributions to senior management and/or councillors. Figure 4E provides an example of better practice of internal reporting to council.
Figure 4E
Case study: Internal reporting to council
|
Greater Geelong City Council Management prepares a report on DCPs annually to provide an update on past activity and estimated impact on the future to council. This includes aggregate figures of all active DCPs for income, expenditure and general performance over the past 12 months and also identifies the gap between the assets required to be delivered under the plans and the total contributions to be collected. The number of development lots that have collected a Community Infrastructure Levy are also listed for each DCP as well as the value received. Details on projects under way or delivered during the year by developers and by council are included, and set out:
A whole-of-life summary is also provided for each DCP and includes:
Council also receives reports on an as-needs basis when a key DCP-related decision needs to be made. This includes the decision to purchase land for open space. Management are in the process of preparing a new half-yearly report for reporting on development contributions to the audit committee. Combining summary reports on an as-needs basis and detailed annual reporting to senior management and council, assists the decision-making process and represents better practice of internal reporting. |
Source: Victorian Auditor-General's Office.
Publicly reporting on DCPs provides increased transparency and accountability. All local councils are required to report development contributions as a revenue item in the annual financial statements. However, as these are general purpose reports and designed to communicate the overall council financial performance and position, they do not provide enough detail for the community to understand progress and performance on each DCP. Only two local councils reported their DCPs on their website.
Managing the timing of cash flows
DCPs result in cash being collected to fund infrastructure projects and land acquisitions. During the life of a DCP, there is a timing difference between when cash is collected by councils and when the cash is spent. This increases the risk of local councils having cash shortfalls or excess cash, that impacts on councils overall financial sustainability. Figure 4F shows the general cash spends and collections over the life cycle of the DCP from inception.
From our review, local councils will face a cash shortfall due to the timing differences from when initial base infrastructure—such as roads—is needed to facilitate the start of developments to when sufficient development contributions revenue is received to pay for construction. Any initial cash shortfalls that a DCP has will need to be covered by other council funding or through borrowings.
Figure 4F
General pattern of DCP cash collected and expenditure by councils
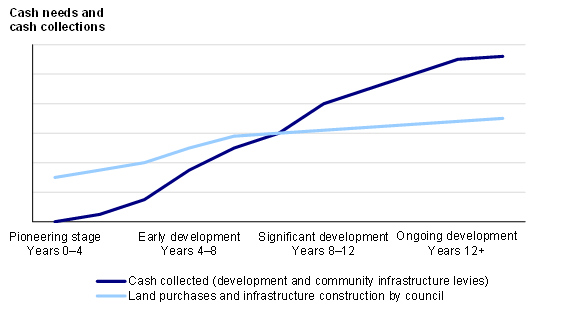
Note: This is an example of a 12-year DCP.
Source: Victorian Auditor-General's Office.
When the DCP reaches the significant development stage, more cash is received and this is when council can continue to build the infrastructure listed in the DCP or repay borrowings.
The timing of the funding gap highlights the importance of councils actively monitoring and managing individual DCP cash levels as well as overall council funds.
Although councils collectively held a total of $516.7 million in open space and development contributions equity reserves at the end of 2014–15 ($440.5 million in 2013–14), the use of these funds is restricted to a specific purpose.
Figure 4G provides an example of a local council that has estimated cash shortfalls with their existing DCPs.
Figure 4G
Case study: Melton City Council estimated cash shortfalls
|
Melton City Council's early forecasts for the next 10 years estimate for four of their six existing DCPs start with positive cash flows before a cumulative cash shortfall of $18.1 million in 2018–19, rising to an aggregate shortfall of $61.0 million by the end of the 10-year forecast period. This is due to expected infrastructure needs to facilitate development and in-kind contributions being received instead of cash in the early stages of the DCPs. It is expected up to seven new DCPs will be approved and commenced in the short to medium term. Maintaining multiple DCPs at the same time will place additional financial pressure on the council. An appropriate balance will be required to manage and monitor individual DCP's cash balances as well as overall council cash levels. |
Source: Victorian Auditor-General's Office.
4.7.3 Governance and monitoring
Risk
A number of risks arise in the delivery of DCPs that require attention from senior management and council, including:
- timing of the collection of cash development contributions and shortfall in cash balances
- asset priorities aligning with the needs of the community
- quality of assets being constructed
- cost-benefit analysis by council of receiving cash or in-kind contributions.
From our review, 40 local councils did not formally manage risks arising from development contributions. When councils do not identify and actively manage and mitigate these risks, the likelihood of adverse outcomes increases.
Figure 4H provides an example of better practice in managing risks.
Figure 4H
Case study: Recognition of risk in risk register
|
Greater Geelong City Council identified risks related to DCPs in both its corporate risk register and a specific DCP risk register. Council had also included plans to mitigate those risks. Including DCP-related risks in the corporate risk register assists senior management to monitor any potential impact on council activities and implement strategies to mitigate the outcomes on a timely basis. |
Source: Victorian Auditor-General's Office.
Of the 37 local councils that provided summary reports to senior management and council, only 19 discussed emerging issues—of those 19, 15 identified budget shortfalls and two identified timing issues for projects. The remaining local councils did not identify any emerging issues that required reporting.
The large number of projects listed for construction in a DCP requires prioritising and delivery depending on triggers from population growth and the number of new dwellings. There were 16 local councils that had infrastructure planned in a DCP that was overdue. The main reasons for not delivering the planned assets included:
- lack of funding to complete project
- changes to the priorities of works
- resourcing and weather delays.
These delays will mean that the infrastructure and facilities will not be delivered on a timely basis as promised and will be unavailable to service the community.
Steering committees
The significant values of development contributions being received and the long life cycle of a DCP require specific and ongoing attention to ensure delivery occurs as planned. Our review identified four local councils that had appointed steering committees to provide oversight and direction for DCPs. Figure 4I provides an example of better practice on key components of a steering committee. While councils can implement other oversight and governance arrangements, steering committees can facilitate organisation-wide involvement of staff from each of the key functions. This helps to mitigate some risks arising from DCPs.
Figure 4I
Case study: Steering committee monitoring and oversight
|
Melton City Council The steering committee meets quarterly to ensure the DCPs and other major development sites are delivered efficiently and effectively. It includes staff from the following key functions within council:
The steering committee is tasked with providing advice and recommendations to both senior management and the council. All three local councils reviewed in detail, have a steering committee in place. This represents a key element of the development contributions management framework. |
Source: Victorian Auditor-General's Office.
Internal audit oversight
Internal audit review to assess councils' development contributions' processes and controls—including compliance with policies and procedures—are necessary for identifying control weaknesses, potential process improvements and training needs.
It is important that internal audit reviews be conducted at various stages of a DCP to assess whether there are any deficiencies in the process, and areas for improvement to be applied to subsequent stages. In addition, this will promote efficient and robust practices and provide an appropriate framework for other DCPs. Internal audit reviews can also provide management and councillors with some assurance over the arrangements; and assist their monitoring and achievement of desired outcomes.
Fifty-two local councils (88 per cent) have not conducted an internal audit review over development contributions in the past three years, while seven local councils did. The most recent internal audit reports at these seven local councils identified the following issues:
- no overall DCP priority list to ensure individual priorities have a direct link to the council plans
- statement of compliance being issued for a permit prior to receiving the required contribution funds
- lack of clarity and documentation of roles and responsibilities, implementation of documented guidelines and financial reporting.
As part of a strong and effective framework, it is important these findings are considered by local councils.
4.8 Longer-term impact of development contributed assets
DCPs provide significant amounts of new infrastructure to a local council once completed assets are transferred. It then becomes the local council's responsibility to maintain and monitor the condition of these assets with local council incurring ongoing maintenance and depreciation expenses.
Of the three local councils reviewed in the case studies, only Whittlesea City Council assessed the longer-term impact of the DCPs and additional assets as part of their 15-year plan. The other local councils only assess the immediate impact in their four-year budgets.
Recommendations
That local councils:
- acquit each development contribution plan by reporting publicly on the development contributions received/unspent and remaining infrastructure required
- include risks associated with development contributions and infrastructure asset delivery in council's risk register—these risks need to be actively assessed and managed
- prepare a cash flow forecast of at least five years to better manage financial impacts of development contributions
- conduct an internal audit review of development contributions on a periodic basis.
Appendix A. Local council cohorts
As detailed in Part 1, to assist with our analysis of the local government sector, the 79 local councils have been split into five cohorts, based broadly on size, demographics and funding.
Figure A1 lists the local councils that make up each category.
Figure A1
Local council cohorts
Local council cohort |
|
|---|---|
Metropolitan – 22 local councils |
|
Banyule City Council |
Manningham City Council |
Bayside City Council |
Maribyrnong City Council |
Boroondara City Council |
Maroondah City Council |
Brimbank City Council |
Melbourne City Council |
Darebin City Council |
Monash City Council |
Frankston City Council |
Moonee Valley City Council |
Glen Eira City Council |
Moreland City Council |
Greater Dandenong City Council |
Port Phillip City Council |
Hobsons Bay City Council |
Stonnington City Council |
Kingston City Council |
Whitehorse City Council |
Knox City Council |
Yarra City Council |
Interface – nine local councils |
|
Cardinia Shire Council |
Nillumbik Shire Council |
Casey City Council |
Whittlesea City Council |
Hume City Council |
Wyndham City Council |
Melton City Council |
Yarra Ranges Shire Council |
Mornington Peninsula Shire Council |
|
Regional city – 10 local councils |
|
Ballarat City Council |
Latrobe City Council |
Greater Bendigo City Council |
Mildura Rural City Council |
Greater Geelong City Council |
Wangaratta Rural City Council |
Greater Shepparton City Council |
Warrnambool City Council |
Horsham Rural City Council |
Wodonga City Council |
Large shire – 19 local councils |
|
Bass Coast Shire Council |
Moira Shire Council |
Baw Baw Shire Council |
Moorabool Shire Council |
Campaspe Shire Council |
Mount Alexander Shire Council |
Colac-Otway Shire Council |
Moyne Shire Council |
Corangamite Shire Council |
South Gippsland Shire Council |
East Gippsland Shire Council |
Southern Grampians Shire Council |
Glenelg Shire Council |
Surf Coast Shire Council |
Golden Plains Shire Council |
Swan Hill Rural City Council |
Macedon Ranges Shire Council |
Wellington Shire Council |
Mitchell Shire Council |
|
Small shire – 19 local councils |
|
Alpine Shire Council |
Mansfield Shire Council |
Ararat Shire Council |
Murrindindi Shire Council |
Benalla Shire Council |
Northern Grampians Shire Council |
Buloke Shire Council |
Pyrenees Shire Council |
Central Goldfields Shire Council |
Borough of Queenscliffe |
Gannawarra Shire Council |
Strathbogie Shire Council |
Hepburn Shire Council |
Towong Shire Council |
Hindmarsh Shire Council |
West Wimmera Shire Council |
Indigo Shire Council |
Yarriambiack Shire Council |
Loddon Shire Council |
|
Source: Victorian Auditor-General's Office.
Appendix B. Management letter risk ratings
Figure B1 shows the risk ratings applied to management letter points raised during an audit review.
Figure B1
Risk definitions applied to issues reported in audit management letters
Rating |
Definition |
Management action required |
|---|---|---|
Extreme |
The issue represents:
|
Requires immediate management intervention with a detailed action plan to be implemented within one month. Requires executive management to correct the material misstatement in the financial report as a matter of urgency to avoid a modified audit opinion. |
High |
The issue represents:
|
Requires prompt management intervention with a detailed action plan implemented within two months. Requires executive management to correct the material misstatement in the financial report to avoid a modified audit opinion. |
Medium |
The issue represents:
|
Requires management intervention with a detailed action plan implemented within three to six months. |
Low |
The issue represents:
|
Requires management intervention with a detailed action plan implemented within six to 12 months. |
Source: Victorian Auditor-General's Office.
Appendix C. Financial sustainability risk indicators
Figure C1 shows the indicators used in assessing the financial sustainability risks of local councils in Part 2 of this report. These indicators should be considered collectively, and are more useful when assessed over time as part of a trend analysis.
Figure C1
Financial sustainability risk indicators
Indicator |
Formula |
Description |
|---|---|---|
Net result (%) |
Net result / Total revenue |
A positive result indicates a surplus, and the larger the percentage, the stronger the result. A negative result indicates a deficit. Operating deficits cannot be sustained in the long term. Net result and total revenue is obtained from the comprehensive operating statement. |
Liquidity (ratio) |
Current assets / Current liabilities |
This measures the ability to pay existing liabilities in the next 12 months. A ratio of one or more means there are more cash and liquid assets than short-term liabilities. |
Internal financing (%) |
Net operating cash flow / Net capital expenditure |
This measures the ability of an entity to finance capital works from generated cash flow. The higher the percentage, the greater the ability for the entity to finance capital works from their own funds. Net operating cash flows and net capital expenditure are obtained from the cash flow statement. |
Indebtedness (%) |
Non-current liabilities / Own-sourced revenue |
Comparison of non-current liabilities (mainly comprised of borrowings) to own-sourced revenue. The higher the percentage, the less able to cover non-current liabilities from the revenues the entity generates itself. Own-sourced revenue is use—rather than total revenue—because it does not include capital grants, which are usually tied to specific projects. |
Capital replacement (ratio) |
Cash outflows for property, plant and equipment / Depreciation |
Comparison of the rate of spending on infrastructure with its depreciation. Ratios higher than 1:1 indicate that spending is faster than the depreciating rate. This is a long-term indicator, as capital expenditure can be deferred in the short term if there are insufficient funds available from operations, and borrowing is not an option. Cash outflows for infrastructure are taken from the cash flow statement. Depreciation is taken from the comprehensive operating statement. |
Renewal gap (ratio) |
Renewal and upgrade expenditure / Depreciation |
Comparison of the rate of spending on existing assets through renewing, restoring, and replacing existing assets with depreciation. Ratios higher than 1:1 indicate that spending on existing assets is faster than the depreciating rate. Similar to the investment gap, this is a long-term indicator, as capital expenditure can be deferred in the short term if there are insufficient funds available from operations, and borrowing is not an option. Renewal and upgrade expenditure are taken from the statement of capital works. Depreciation is taken from the comprehensive operating statement. |
Source: Victorian Auditor-General's Office.
The analysis of financial sustainability risk in this report reflects on the position of each local council.
Financial sustainability risk assessment criteria
The financial sustainability risk of each local council has been assessed using the criteria outlined in Figure C2.
Figure C2
Financial sustainability risk indicators – risk assessment criteria
Risk |
Net result |
Liquidity |
Indebtedness |
Internal financing |
Capital replacement |
Renewal gap |
|---|---|---|---|---|---|---|
High |
Negative 10% or less |
Less than 0.75 |
More than 60% |
Less than 75% |
Less than 1.0 |
Less than 0.5 |
Insufficient revenue is being generated to fund operations and asset renewal. |
Immediate sustainability issues with insufficient current assets to cover liabilities. |
Potentially long-term concern over ability to repay debt levels from own-source revenue. |
Limited cash generated from operations to fund new assets and asset renewal. |
Spending on capital works has not kept pace with consumption of assets. |
Spending on existing assets has not kept pace with consumption of these assets. |
|
Medium |
Negative 10%–0% |
0.75–1.0 |
40–60% |
75–100% |
1.0–1.5 |
0.5–1.0 |
A risk of long‑term run down to cash reserves and inability to fund asset renewals. |
Need for caution with cash flow, as issues could arise with meeting obligations as they fall due. |
Some concern over the ability to repay debt from own-source revenue. |
May not be generating sufficient cash from operations to fund new assets. |
May indicate spending on asset renewal is insufficient. |
May indicate insufficient spending on renewal of existing assets. |
|
Low |
More than 0% |
More than 1.0 |
40% or less |
More than 100% |
More than 1.5 |
More than 1.0 |
Generating surpluses consistently. |
No immediate issues with repaying short-term liabilities as they fall due. |
No concern over the ability to repay debt from own-source revenue. |
Generating enough cash from operations to fund new assets. |
Low risk of insufficient spending on asset renewal. |
Low risk of insufficient spending on asset base. |
Source: Victorian Auditor-General's Office.
Changes to prior year reports
The financial sustainability risk indicators used in this report have changed slightly from prior years. The changes are detailed below:
- the indicators have been calculated from the information in the published financial statements for the local councils, with no adjustments made to these figures
- the net result indicator has replaced the previous underlying result indicator
- the internal financing indicator has replaced the previous self-financing indicator.
Appendix D. Glossary
Accountability
Responsibility on public sector entities to achieve their objectives, with regard to reliability of financial reporting, effectiveness and efficiency of operations, compliance with applicable laws, and reporting to interested parties.
Amortisation
The systematic allocation of the depreciable amount of an intangible asset over its expected useful life.
Asset
A resource controlled by an entity as a result of past events, and from which future economic benefits are expected to flow to the entity.
Audit Act 1994
The Audit Act 1994 establishes the operating powers and responsibilities of the Auditor-General. This includes the operations of his office—the Victorian Auditor‑General's Office (VAGO)—as well as the nature and scope of audits conducted by VAGO.
Audit opinion
Written expression within a specified framework indicating the auditor's overall conclusion on the financial (and performance) reports based on audit evidence obtained.
Capital expenditure
Amount capitalised to the balance sheet for contributions by a public sector entity to major assets owned by the entity, including expenditure on:
- capital renewal of existing assets that returns the service potential or the life of these assets
- expenditure on new assets, including buildings, infrastructure, plant and equipment.
Clear audit opinion
A positive written expression provided when the financial report has been prepared and presents fairly the transactions and balances for the reporting period in accordance with the requirements of the relevant legislation and Australian Accounting Standards—also referred to as an unqualified audit opinion.
Consumer price index
A measure of changes, over time, in retail prices of a constant basket of goods and services representative of consumption expenditure by resident households in an area.
Depreciation
The systematic allocation of the value of an asset over its expected useful life.
Development contributions
Cash payments or assets provided by land developers towards the supply of infrastructure to support new land developments.
Emphasis of matter
A paragraph included in an auditor's report to which draws the users of the financial reports' attention to a particular note or disclosure which, in the auditor's opinion, is fundamental to the user's understanding of the financial report.
Equity or net assets
Residual interest in the assets of an entity after deduction of its liabilities.
Expense
Outflows or other depletions of economic benefits in the form of incurrence of liabilities or depletion of assets of the entity, other than those relating to contributions by owners, that results in a decrease in equity during the reporting period.
Financial report
Structured representation of the financial information, which usually includes accompanying notes, derived from accounting records and intended to communicate an entity's economic resources or obligations at a point in time, or the changes therein for a period in accordance with a financial reporting framework.
Financial sustainability
An entity's ability to manage financial resources so it can meet spending commitments, both at present and into the future.
Financial year
A period of 12 months for which a financial report is prepared.
Governance
The control arrangements in place that are used to govern and monitor an entity's activities in order to achieve its strategic and operational goals.
Interface council
Interface councils are the ten councils that form a ring around metropolitan Melbourne.
Internal control
Internal control is a means by which an entity's resources are directed, monitored and measured. It plays an important role in preventing and detecting error and fraud and protecting the entity's resources.
Liability
A present obligation of an entity arising from past events, the settlement of which is expected to result in an outflow from the entity of resources embodying economic benefits.
Local Government Act 1989
An Act of the State of Victoria that establishes the:
- purpose of councils
- powers that will enable councils to meet the needs of their communities
- accountable system of local government
- reform of law relating to local government in Victoria.
Management letter
A letter issued by the auditor to the governing body, the audit committee and management of an entity outlining weaknesses in controls and other issues identified during the financial audit.
Material error or adjustment
An error that may result in the omission or misstatement of information, which could influence the economic decision of users taken on the basis of the financial statements. Materiality depends on the size and nature of the omission or misstatement judged in the surrounding circumstances.
Net result
The net result is calculated by subtracting an entity's total expenses from the total revenue, to show what the entity has earned or lost in a given period of time.
Performance statement
A statement containing predetermined performance indicators, and actual results achieved for the financial year, with an explanation for any significant variance between the results.
Relevant
Measures or indicators used by an entity are relevant if they have a logical and consistent relationship to its objectives and are linked to the outcomes to be achieved.
Revaluation
Recognising a reassessment of values for non-current assets at a particular point in time.
Revenue
Inflows of funds or other enhancements or savings in outflows of service potential, or future economic benefits in the form of increases in assets or reductions in liabilities of an entity, other than those relating to contributions by owners which result in an increase in equity during the reporting period.
Risk
The chance of a negative impact on the objectives, outputs or outcomes of the entity.
Risk register
A tool to assist an entity in identifying, monitoring and mitigating risks.
Urban Growth Zone
A mandated area outside the regional boundary used for lower density development.
Appendix E. Audit Act 1994 section 16—submissions and comments
Introduction
In accordance with section 16(3) of the Audit Act 1994, a copy of this report, or relevant extracts from the report, was provided to the Department of Environment, Land, Water & Planning and each of the 79 local councils with a request for submissions or comments.
The submissions and comments provided are not subject to audit nor the evidentiary standards required to reach an audit conclusion. Responsibility for the accuracy, fairness and balance of those comments rests solely with the agency head.
Responses were received as follows:
RESPONSE provided by the Secretary, Department of Environment, Land, Water & Planning
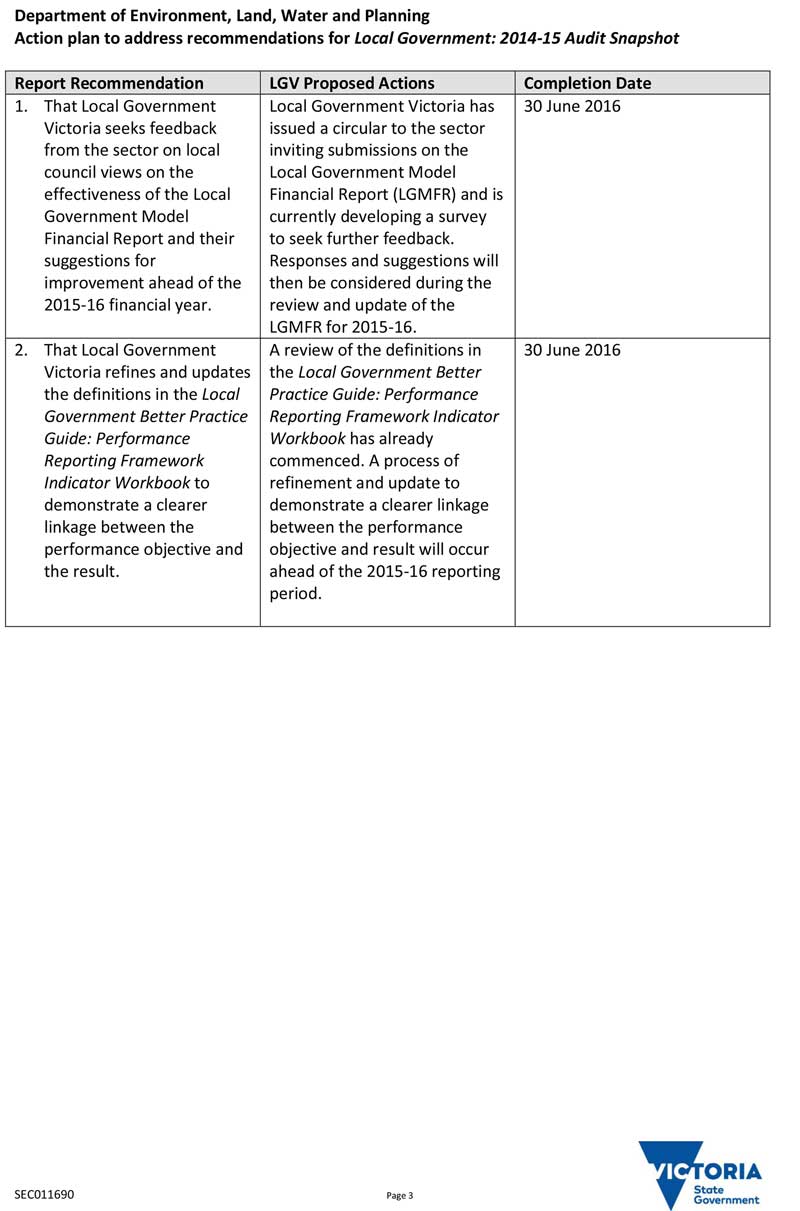
RESPONSE provided by the Chief Executive Officer, Maroondah City Council
RESPONSE provided by the Director Business Services, Wodonga City Council