Portfolio Departments and Associated Entities: Results of the 2010–11 Audits
Overview
The Victorian public sector includes 11 portfolio departments and 201 associated entities through which the government delivers its policy objectives, services and public infrastructure. This report covers the outcomes and observations from the external financial audit of these 212 entities.
At the date of preparation of this report, clear audit opinions had been issued for all 11 portfolio departments and the 183 associated entities who had completed their financial statements.
For the 46 self-funded entities, the most significant challenge facing their financial sustainability is self-financing, with 23 entities generating insufficient cash from operations to fund new assets and asset renewals. Twelve entities were rated as a high financial sustainability risk.
Leave management and grant management practices in the 11 portfolio departments were adequate.
Weaknesses were identified in IT change management at the 11 portfolio departments, CenITex and Shared Business Systems. Similarly, management, governance and oversight of IT security was adequate at the portfolio departments, CenITex and Shared Business Systems. However, IT security policies could be strengthened.
Portfolio Departments and Associated Entities: Results of the 2010–11 Audits: Message
Ordered to be printed
VICTORIAN GOVERNMENT PRINTER November 2011
PP No 85, Session 2010–11
President
Legislative Council
Parliament House
Melbourne
Speaker
Legislative Assembly
Parliament House
Melbourne
Dear Presiding Officers
Under the provisions of section 16AB of the Audit Act 1994, I transmit my report on Portfolio Departments and Associated Entities: Results of the 2010–11 Audits.
Yours faithfully
![]()
D D R PEARSON
Auditor-General
23 November 2011
Audit summary
Background
The Victorian public sector includes 11 portfolio departments and 201 associated entities through which the government delivers its policy objectives, services and public infrastructure. This report covers the outcomes and observations from the external financial audit of these 212 entities.
Each portfolio department and associated entity is required to prepare a financial report to inform Parliament and the community about the level of public resources and assets it holds and manages.
Financial reports should be a reliable and timely source of information for assessing the financial management and health of entities at a point in time. Financial reports should also be underpinned by systems, processes and internal controls that assure an entity of the completeness, accuracy and appropriateness of its transactions and balances.
The external audit of portfolio departments and their associated entities provides an opportunity to compare and analyse the quality of preparation of their financial reports. Our financial audits also include cyclical reviews over areas of internal controls. The common findings from these reviews are included in this report.
Conclusion
At the date of preparation of this report, audit opinions had been issued for all 11 portfolio departments and 183 of the 201 associated entities. All opinions issued were clear.
For the 46 self-funded entities, the most significant challenge facing their financial sustainability is self‑financing. Twenty-three generated insufficient cash from operations to fund new assets and asset renewals, and a further 13 were at risk.
Most of the self-funded entities are governed by a board or trustees accountable for managing and operating significant public sector assets. However, the community nature of these assets can restrict the ability of the entities’ boards and trustees to increase revenue, limiting their oversight to controlling expenditure. Notwithstanding this, the accountability of the boards and trustees is not limited.
Findings
Quality of financial reporting
Clear audit opinions were issued for the 11 portfolio departments and 183 associated entities that had finalised their financial reports. A clear opinion means the financial report is credible and reliable.
Portfolio departments improved preparation of their financial reports in 2010–11. Fifty per cent of them achieved the earlier reporting time lines and minimal material adjustments were required to drafts provided to audit.
Financial sustainability
The financial sustainability of the 46 self-funded entities was assessed using four short- and long-term sustainability indicators. Twelve entities were rated as high financial sustainability risks, meaning short-term or immediate financial concerns exist and need to be addressed. A further 20 were rated as medium risk, indicating a long-term financial sustainability concern.
Three entities were rated high risk solely due to poor liquidity positions when averaged over the past five financial years. Nine were rated as high risk because of large underlying deficits when averaged across the past five financial years.
Most of these nine entities have boards or trusts who control and have responsibility for managing significant public sector assets. However, they do not generate sufficient revenue from operations to maintain and renew those assets. This creates an accountability issue for members of their boards and trusts who are unable to meet their statutory obligations, which includes maintenance of assets, because of financial constraints.
Management of employee leave
Leave management in portfolio departments was adequate. All portfolio departments had leave management policies. However, these could be strengthened by specifying accountabilities and requiring reporting to management on excess leave balances and strategies in place to reduce them.
On average, 5 per cent of staff in portfolio departments had excess recreation leave entitlements at 30 June 2011, consistent with the average of 4.9 per cent reported in 2007–08. Staff in portfolio departments took an average of 7.89 sick leave days during the year. However, staff within the Departments of Justice and Transport took 1.5 days and 2.4 days respectively more than the average.
Grants management
Grants administration policies and practices of the 11 portfolio departments were adequate. Nevertheless improvements can be made to:
- require conflicts of interests declarations to be made by all grant assessors
- consolidate grant management systems at the Departments of Justice, Primary Industries, and Sustainability and Environment, to provide timely access to grants information for decision-making, monitoring and reporting purposes.
Information technology controls
Weaknesses were identified in information technology (IT) change management at the portfolio departments. Written IT change management policies did not exist or were not up to date at five portfolio departments, and were in draft at CenITex. Despite this, we found that CenITex, Shared Business Systems and the portfolio departments had sound management practices in place to process changes to their IT systems.
Management, governance and oversight of IT security was adequate at most portfolio departments, but IT security policies could be strengthened by tailoring them for the risks unique to each portfolio department.
Recommendations
- That the Department of Treasury and Finance work with agencies to address accountability obligations when statutory responsibilities for governance and the funding models are not aligned.
- That portfolio departments prepare and approve leave management plans for all staff with excess annual leave, and actively manage compliance with those plans.
- That portfolio departments report to senior management periodically on sick leave data, including patterns and trends against internal and public sector benchmarks to enable the timely identification of problems, and development of action plans to mitigate risks to staff wellbeing, or underlying issues in the workplace escalating.
- That portfolio departments reinforce the importance of conflicts of interests declarations by all staff undertaking grants assessments.
- That the Departments of Justice, Primary Industries, and Sustainability and Environment leverage the experience and expertise of other portfolio departments to examine the costs and benefits of a consolidated grants management system.
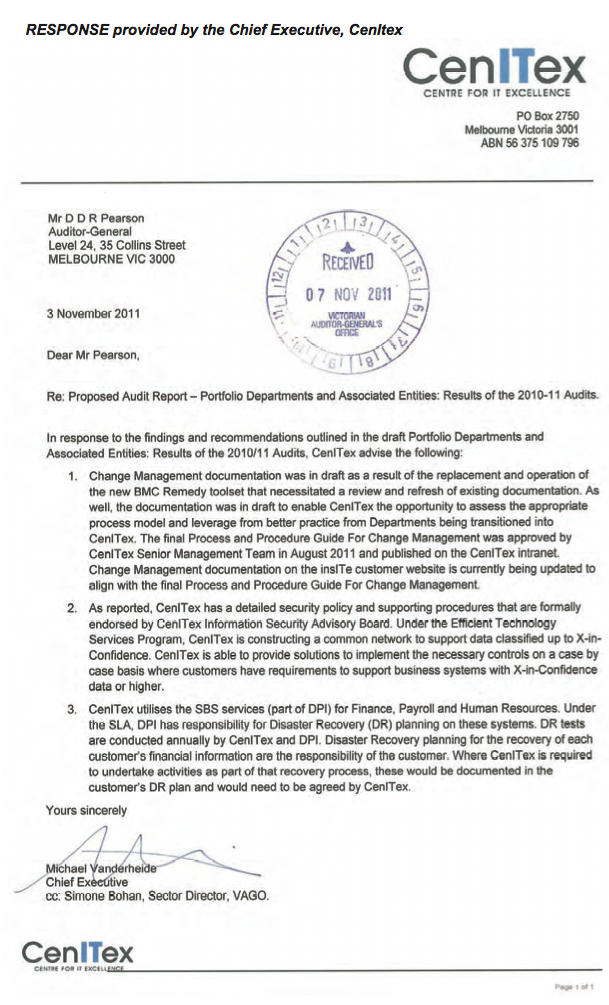
- That CenITex have its change management policy, and process and procedures guide approved and adopted by senior management.
- That portfolio departments develop, approve and implement change management policies and procedures for all financial applications.
- That portfolio departments develop comprehensive policies and procedures over information technology system security which are approved by the secretary and subject to regular review.
- That portfolio departments develop an information security classification policy that outlines criteria for assigning security classifications to information and the required security controls for each classification.
- That portfolio departments develop, approve and implement disaster recovery policies and procedures for all financial applications.
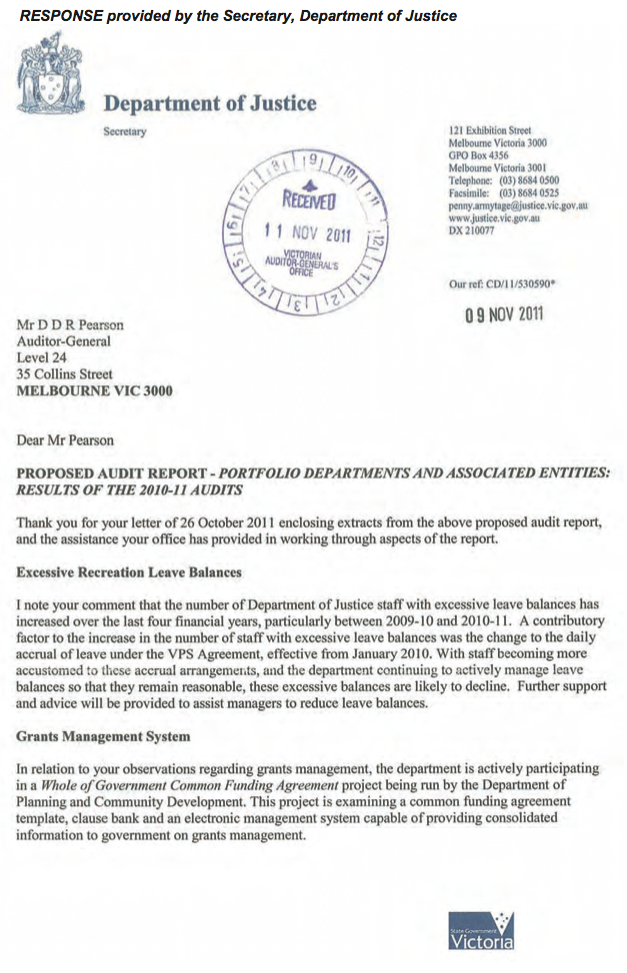
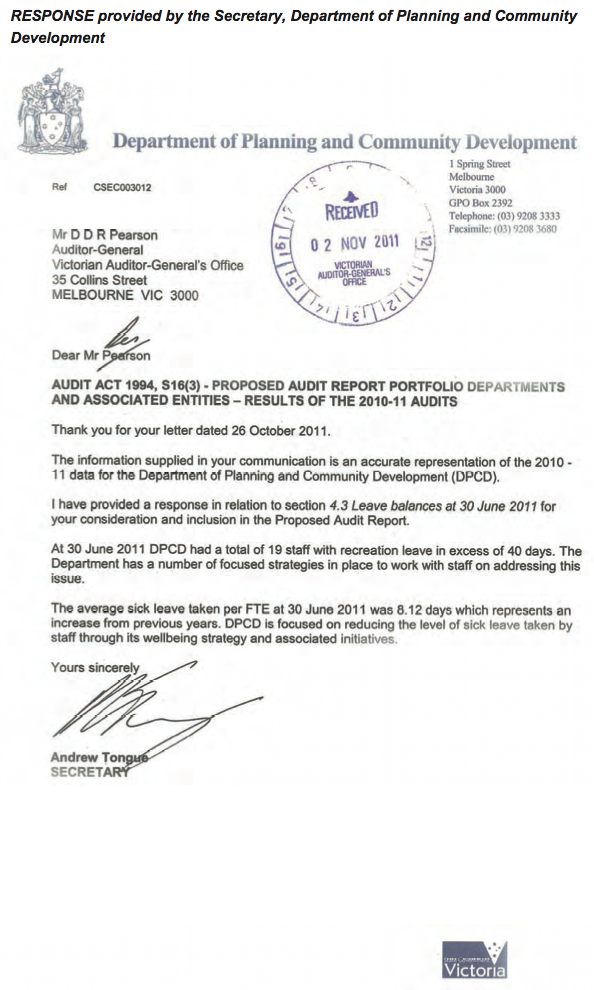
Submissions and comments received
In addition to progressive engagement during the course of the audit, in accordance with section 16(3) of the Audit Act 1994 a copy of this report, or relevant extracts from the report, was provided to all portfolio departments and named agencies with a request for submissions or comments.
The agency views have been considered in reaching our audit conclusions and are represented to the extent relevant and warranted in preparing this report. Their full section 16(3) submissions and comments, however, are included in Appendix E.
1 Background
This is the fourth of six reports to be presented to Parliament covering the results of the 2010–11 financial statement audits. Appendix A lists the six reports and their tabling time frames.
The report comments on the quality of financial reporting, the effectiveness of internal controls, and financial sustainability of self-funded state entities.
1.1 Scope
This report covers 11 portfolio departments and 201 associated entities with 30 June 2011 balance dates. These entities report under a range of legislation, the most common being, the Financial Management Act 1994 (FMA) and the Corporations Act 2001. Figure 1A shows the number of entities per portfolio and related legislative reporting framework.
Figure
1A
Entities by portfolio and legislative reporting framework
Portfolio |
Financial Management Act |
Corporations Act |
Other |
Total |
||||
|---|---|---|---|---|---|---|---|---|
2010–11 |
2009–10 |
2010–11 |
2009–10 |
2010–11 |
2009–10 |
2010–11 |
2009–10 |
|
Parliament |
2 |
2 |
– |
– |
– |
– |
2 |
2 |
Business and Innovation |
7 |
9 |
5 |
7 |
– |
– |
12 |
16 |
Education and Early Childhood Development |
6 |
4 |
3 |
– |
– |
– |
9 |
4 |
Health |
14 |
30 |
– |
– |
– |
– |
14 |
30 |
Human Services |
3 |
2 |
– |
– |
– |
– |
3 |
2 |
Justice |
25 |
25 |
2 |
2 |
1 |
1 |
28 |
28 |
Planning and Community Development |
13 |
15 |
1 |
1 |
– |
– |
14 |
16 |
Premier and Cabinet |
11 |
11 |
1 |
1 |
– |
– |
12 |
12 |
Primary Industries |
10 |
10 |
2 |
2 |
– |
– |
12 |
12 |
Sustainability and Environment |
36 |
37 |
– |
– |
– |
– |
36 |
37 |
Transport |
8 |
9 |
6 |
6 |
0 |
0 |
14 |
15 |
Treasury and Finance |
17 |
17 |
20 |
10 |
19 |
8 |
56 |
35 |
Total |
152 |
171 |
40 |
29 |
20 |
9 |
212 |
209 |
Source: Victorian Auditor-General's Office.
Figure 1A shows the total number of entities subject to audit grew by a net three in 2010–11. A list of all changes is provided in Figure 1B.
Figure
1B
Changes to audited entities
Merged with another entity |
|
|---|---|
Transport |
Port of Hastings Corporation was merged with Port of Melbourne Corporation on 1 September 2010. |
Health |
The Southern Metropolitan Cemetery Trust was created on 1 March 2010 by the merger of:
The Greater Metropolitan Cemeteries Trust was created on 1 March 2010 by the merger of:
|
|
New audits |
|
Treasury and Finance |
The State Electricity Commission of Victoria created a new subsidiary company A.C.N. 151803628 Pty Ltd on 29 June 2011. It was created to hold ownership of 13 companies taken over by State Electricity Commission of Victoria on 30 June 2011. The 13 companies came under VAGO's audit responsibility on 30 June 2011:
Residential Independence Pty Ltd, a controlled entity of the Transport Accident Commission, was constituted on 21 December 2010. The company is the trustee of the Residential Independence Trust constituted on 1 February 2011 and also a controlled entity of the Transport Accident Commission. The Victorian Funds Management Corporation became trustee of VFMC Equity Trust 1 on 23 May 2011 and prepared financial statements for the trust at 30 June 2011. The VFM Multi Strategy Trusts includes the VFM Capital Stable Fund, VFM Balanced Fund and VFM Growth Fund. These trusts were constituted on 22 April 2010 and prepared financial statements at 30 June 2011 for the period since constitution. The trustee of the trusts is the Victorian Funds Management Corporation. Victorian Funds Management Corporation was appointed trustee for the VFMC ESSS Private Equity Trust 2004, VFMC ESSS Private Equity Trust 2006 and VFMC ESSS Private Equity Trust 2007 on 1 December 2010 and prepared financial statements at 30 June 2011. |
Wound up |
|
Sustainability and Environment |
Yarra Bend Park Trust ceased operations on 16 December 2009. A final report was prepared in 2009–10. |
Transferred to Commonwealth |
|
Health |
The following entities were transferred from the Health portfolio to the Australian Health Practitioner Regulation Agency, an agency of the Commonwealth Government, effective 1 July 2010:
|
Transferred between portfolios |
|
Business and Innovation |
NMIT International Limited, TAFE Development Centre Ltd, VCAMM Limited and Victorian Skills Commission transferred from the Business and Innovation portfolio to the Education and Early Childhood Development portfolio. |
Planning and Community Development |
Adult, Community and Further Education Board transferred from the Planning and Community Development portfolio to the Education and Early Childhood Development portfolio. Queen Victoria Women's Centre Trust transferred from the Planning and Community Development portfolio to the Human Services portfolio. |
Treasury and Finance |
The Registrar of Housing Agencies prepared a set of 31 December 2010 financial statements and then moved portfolios. An exemption from reporting separately under the FMA was signed by the Minister for Finance on 23 May 2011; therefore, no 30 June 2011 financial statements were prepared. |
Source: Victorian Auditor-General's Office.
1.2 Reporting framework
Financial statements are required to be prepared in accordance with Australian Accounting Standards, including the Australian Accounting Interpretations, and legislated reporting frameworks. Under the FMA, the Minister for Finance has the authority to issue directions in relation to finance administration and reporting issues.
The FMA requires annual reports to be submitted to the relevant minister, and tabled in Parliament within four months of the end of the financial year. These reports should include financial reports for the entity and any controlled entities, and are required to be prepared and audited within 12 weeks of the end of the financial year.
The entities reporting under the Corporations Act 2001 are required to report to their members within four months of the end of the financial year.
A summary of the FMA and Corporations Act 2001 reporting time frames is provided in Figure 1C.
Figure 1C
Legislated financial reporting time frames
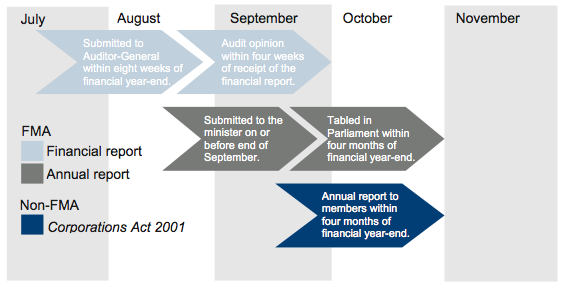
The Premier issued a circular on 18 May 2011 that required all public sector entities to table their annual reports in Parliament on or before 15 September 2011. This shortened the timeframe available for preparing and auditing financial statements.
1.3 Internal controls
Effective internal controls help portfolio departments and associated entities reliably and cost-effectively meet their objectives. Internal controls underpin the reliable, accurate and timely delivery of external and internal reports.
Senior management of an entity is responsible for developing and maintaining adequate systems of internal control to enable:
- preparation of accurate financial records and other information
- timely and reliable external and internal reporting
- appropriate safeguarding of assets
- prevention or detection of errors and other irregularities.
The FMA requires management to implement an effective internal control structure. In establishing effective controls, it should adopt a control framework that has:
- comprehensive policies
- effective management practices
- sound governance and oversight.
In our annual financial audits, we focus on the internal controls relating to financial reporting and assess whether portfolio departments and associated entities have managed the risk that their financial statements will not be complete and accurate. Poor controls diminish management's ability to achieve strategic objectives and to comply with relevant legislation. They also increase the risk of fraud. Any internal control weaknesses identified during our audits are reported to an entity's management and audit committee.
In addition to reviewing general internal controls, a cyclical approach to reviewing internal controls relating to significant annual financial report balances and disclosures, consistent with Australian Auditing Standards, is adopted at portfolio departments.
This report includes the results of cyclical reviews of management of employment leave, grants administration, information technology change management and security.
1.4 Audit conduct
The audits were undertaken in accordance with Australian Auditing Standards.
The total cost of preparing and printing this report was $185 000.
1.5 Structure of this report
This report provides an overview of the results from the 2010–11 financial report audits and the review of targeted internal control areas in portfolio departments and associated entities. The structure of this report is set out in Figure 1D.
Figure 1D
Report structure
Parts |
Description |
|---|---|
Part 2: Quality of financial reporting |
Comments on the quality of financial reports prepared by portfolio departments and associated entities. |
Part 3: Financial sustainability |
A financial sustainability assessment was undertaken for the 46 self-funded state entities. The assessment is based on four financial sustainability indicators that consider both short‑term and long-term sustainability. |
Part 4: Management of employee leave |
Comments on the effectiveness of portfolio departments in managing employee leave including recreation and sick leave. |
Part 5: Grants management |
Assesses the controls portfolio departments have over grants including policies, management practices, governance and oversight. |
Part 6: Information technology controls |
Assesses the controls over information technology change management and security. |
Source: Victorian Auditor-General's Office.
2 Quality of financial reporting
At a glance
Background
This Part covers the results of the 2010–11 audits of the 11 portfolio departments and 183 associated entities that had finalised their financial reports at the date this report was prepared.
Independent audit opinions add credibility to an entity's financial report by providing reasonable assurance that the information reported is reliable. The quality of an entity's reporting can be measured by the timeliness and accuracy of the preparation of the reports. This Part compares financial reporting quality in 2010–11 against 2009–10 performance.
Conclusion
Portfolio departments are to be commended on the quality of their financial reporting in 2010–11.
Findings
- Fifty per cent of portfolio departments finalised their financial reports within seven weeks of year end. This is an improvement on 2009–10 and continues the trend of earlier reporting commenced in that year.
- The small number of adjustments to both financial balances and disclosures required in 2010–11 indicates that portfolio departments are improving their financial report preparation processes and producing better quality reports.
2.1 Introduction
This Part covers the results from the audits of the 11 portfolio departments and 183 associated entities that had finalised their financial reports at the date this report was prepared, for the 2010–11 reporting period.
Quality financial reporting is achieved when reports are reliable, timely and accurate.
2.2 Conclusion
Portfolio departments are commended on the quality of financial reporting achieved in 2010–11. The financial reports were generally prepared earlier than in 2009–10 with improved reliability and accuracy reflected in minimal material adjustments required by audit and no qualified audit opinions issued.
2.3 Reliability
2.3.1 Audit opinions
At the date of preparation of this report, 194 audit opinions on financial reports had been issued, all with clear opinions. Audit opinions for 18 entities had not been issued.
Independent audit opinions add credibility to financial reports by providing assurance that the information is reliable. A clear audit opinion confirms that the financial report has been prepared according to the requirements of relevant accounting standards and legislation.
A qualified audit opinion means that the financial report is materially different to the requirements of the relevant reporting framework, and therefore, is less reliable and useful as an accountability document.
No qualified audit opinions were issued in the 2010–11 financial year (one in 2009–10).
Emphasis of matter
Sometimes an auditor draws a reader's attention to a matter or disclosure in the financial statements that provides important context. This is not a qualification and is known as an emphasis of matter.
Figure 2A lists the five entities where the 2010–11 auditor's report contained an emphasis of matter.
Figure
2A
Opinions with emphasis of matter paragraphs for 2010–11
Entity |
Reason |
|---|---|
Australian Synchrotron Company Ltd |
The operational funding arrangement with the government expires on 30 June 2012. There is a material uncertainty that may affect the Company's ability to continue as a going concern. |
Melton Entertainment Trust |
There is uncertainty regarding the entity's continuation as a going concern as it is dependent on the continuing financial support of its parent entity, Harness Racing Victoria. |
Responsible Gambling Advocacy Centre |
The operational funding arrangement with the government expires on 30 June 2012. There is a material uncertainty that may affect the Centre's ability to continue as a going concern. |
Victorian Commission for Gambling Regulation |
The government announced its intention to merge the operations of the Victorian Commission for Gambling Regulation and the Director of Liquor Licensing into a new entity, Victorian Commission for Gambling and Liquor Regulation. There is a material uncertainty regarding the continuation of the Commission as a going concern. |
Victorian Urban Development Authority |
Legislation was passed in Parliament to abolish the Victorian Urban Development Authority and establish the Urban Renewal Authority. Proclamation of the Victorian Urban Development Authority Amendment (Urban Renewal Authority Victoria) Act 2011 has not yet occurred but will happen no later than July 2012. There is a material uncertainty regarding the continuation of the Authority as a going concern. |
Source: Victorian Auditor-General's Office.
2.4 Timeliness
Recognising the important role that financial reports play in the accountability of the use of public monies, entities should prepare and publish timely financial information. The later the reports are produced and published after year end, the less useful they are for timely decision-making.
The legislated time frame for a portfolio department to finalise its audited financial report is within 12 weeks of the end of the financial year. All portfolio departments except the Department of Treasury and Finance achieved the legislative time frame in 2010–11.
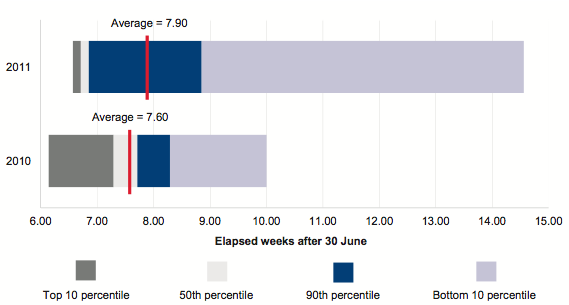
Figure 2B presents, in percentile bands, the time taken for portfolio departments to finalise their audited financial reports after year end.
Figure
2B
Time taken by portfolio departments to finalise financial reports
Source: Victorian Auditor-General's Office.
On average, the time taken by portfolio departments to finalise their financial reports was consistent from 2009–10 to 2010–11. There was improvement in reporting time frames with 50 per cent of portfolio departments reporting one week earlier, finalising their financial reports within seven weeks of year end.
2.5 Accuracy
The frequency and size of errors in the draft financial statements presented to audit that require adjustment are direct measures of accuracy. Ideally, there should be no errors or adjustments required by the auditors.
Overall there are two types of adjustments:
- financial balance adjustments—changes to the balances being reported
- disclosure adjustments—changes to the commentary of financial note disclosure within the financial statements.
The small number of adjustments to both financial balances and disclosures required in 2010–11 indicates that portfolio departments are improving their financial report preparation processes. The stability of the reporting environment, with no significant new accounting standards being introduced during the 2010–11 financial year, assisted this result.
In 2010–11, there was one material financial balance adjustment to the net result reported in the draft financial statements of portfolio departments. The material adjustment was for the Department of Treasury and Finance and related to the recognition of a grant received from the Commonwealth as revenue in 2010–11.
There were three significant disclosure errors that required adjustment in the 2010–11 draft financial statements of portfolio departments. These related to the disclosure of commitments in the financial statements of the Departments of Primary Industry and Sustainability and the Environment.
3 Financial sustainability
At a glance
Background
Financially sustainable entities have the capacity to meet current and future expenditure, and absorb foreseeable changes and risks without significantly changing their revenue and expenditure policies.
A financial sustainability assessment was undertaken for the 46 self-funded state entities as at 30 June 2011. The assessment is based on four financial sustainability indicators that consider both short- and long-term sustainability.
Conclusion
Short-term financial sustainability risks exist in some self-funded state entities.
Findings
- Twenty-three of the 46 entities were at a high risk of not generating sufficient cashflows to fund new assets and renew existing assets. A further 13 were assessed as medium risk.
- Boards and trusts responsible for governing the 46 entities can be financially constrained, putting at risk their ability to fulfil their statutory obligations, when differing funding and governance models are in place.
Recommendation
That the Department of Treasury and Finance work with agencies to address accountability obligations when statutory responsibilities for governance and the funding models are not aligned.
3.1 Introduction
In this Part we provide insight into the financial sustainability of the 46 self-funded entities that primarily generate their own revenue, rather than relying on government funding. This assessment excludes entities where an audit opinion had not been issued on their financial statements at the date of the preparation of this report.
The 11 portfolio departments and 152 associated entities are excluded from the assessment of financial sustainability as they are predominantly Budget-funded or have developed, and already separately report on, sustainability indicators.
The objective of self-funded entities should be to generate a sufficient surplus from operations to meet financial obligations, fund asset replacement and new asset acquisitions. The ability of self-funded entities to do this depends largely on their expenditure management and revenue maximisation practices. This is reflected in the composition and rate of change of their operating revenue and expenses.
3.2 Financial sustainability
By analysing four core financial sustainability indicators over a five-year period, we provide insight into the financial sustainability of self-funded entities. The indicators are: underlying result, liquidity, self-financing and capital replacement, and they reflect each entity's funding and expenditure policies, and indicate whether the policies are sustainable.
Financial sustainability should be viewed from both a short- and long-term perspective. The short-term indicators, in this case, the underlying result and liquidity indicators, measure the entity's ability to maintain a positive operating cash flow and adequate cash holdings, and to generate an operating surplus over time.
The long-term indicators, that is, the self-financing and capital replacement indicators, signify whether adequate funding is available for spending on asset replacement to maintain the quality of service delivery, and to help meet community expectations and the demand for services.
Appendix C describes the sustainability indicators and risk assessment criteria we use in this report.
3.3 Financial sustainability risk assessment results
The five-year average financial sustainability results for the 46 entities that are self‑funded are shown by portfolio in Figure 3A.
Figure
3A
Five-year average financial sustainability risk assessments—self-funded entities at 30 June 2011
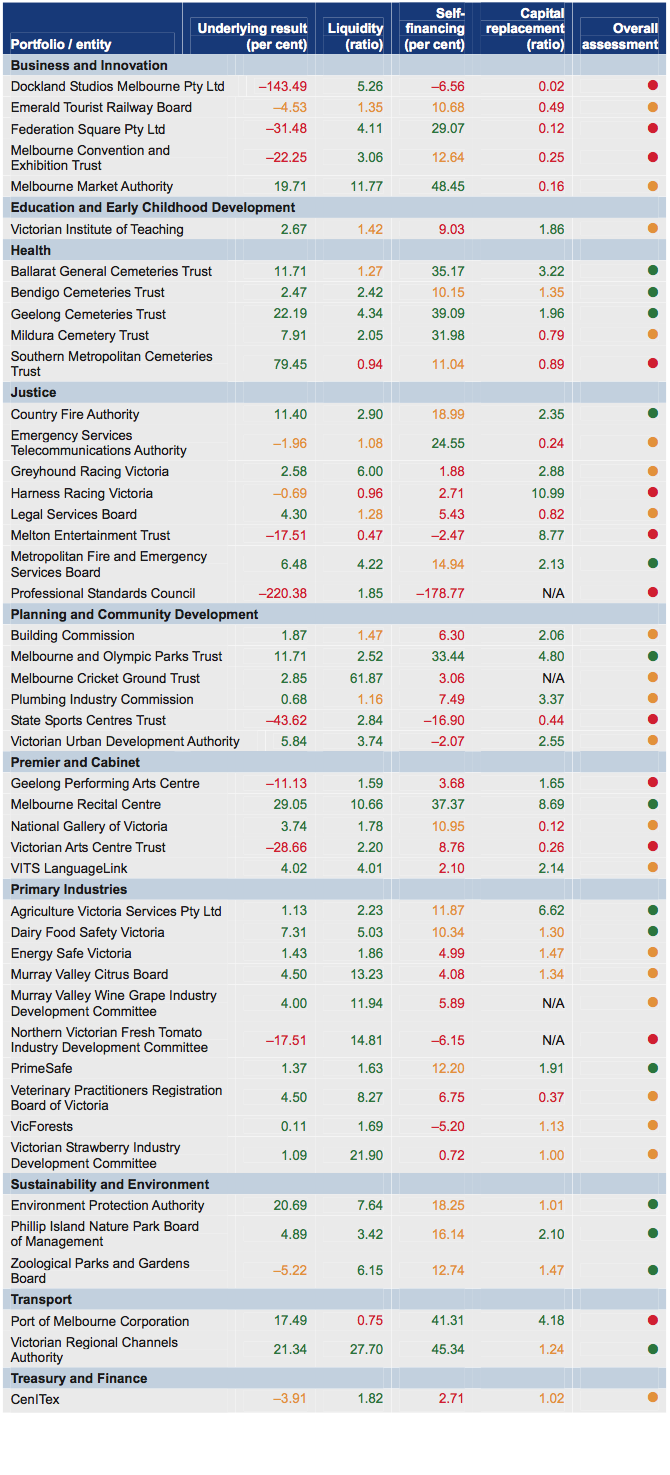
Legend: Red = high risk; Amber = medium risk; Green = low risk.
Source: Victorian Auditor-General's Office.
The results indicate that self-financing was the most significant challenge facing the entities. Self-financing measures an entity's ability to replace its assets using cash generated from operations. Twenty-three entities had generated insufficient cash from operations to fund new assets and asset renewal. A further 13 were at risk of this.
The nature and purpose of the self-funded entities is to deliver services to the public and communities. However, the assets they control do not always produce a revenue stream large enough to cover both the cost of the entity's operations and the maintenance of the assets. Where no funds are available for major asset maintenance, the condition of the assets may deteriorate and effect the entity's ability to continue operating or to generate revenue. This increases reliance on the state to provide funding for maintenance and new assets.
3.4 Accountability for financial management
Most of the 36 entities rated high or medium risk for self-financing are governed by a board or trustees responsible and accountable for managing and operating the business. The community purpose of the entities can restrict the ability of the boards and trustees to increase revenue, and limit their oversight to controlling expenditure. Notwithstanding this, the accountability of the boards and trustees is not limited.
To demonstrate the self-financing challenges and associated financial risks a case study on the State Sports Centre Trust (SSCT) is presented in Figure 3B.
Figure
3B
Case study: State Sports Centre Trust
SSCT is created under the State Sport Centres Act 1994 (the Act). Its functions as defined in the Act include, but are not limited to:
- managing, operating and maintaining the Melbourne Sports and Aquatic Centre (MSAC) and State Netball and Hockey Centre (SNHC)
- the care, improvement, use and promotion of MSAC and SNHC
- the efficient financial management of MSAC and SNHC
- maintaining the land it manages and the facilities on that land.
SSCT started to take on responsibility for Lakeside Stadium as it became completed and operational from September 2011.
We assessed the overall risk to financial sustainability for SSCT as high, underpinned by high risk assessments for the underlying result, self-financing and capital replacement.
Combined, the property, plant and equipment at MSAC and SNHC total $247 million. The annual depreciation of the assets is $8.54 million, which represents the amount of assets consumed by operating year.
In 2010–11, SSCT generated $16.38 million from the sale of goods and services and received $2.80 million in grants. Once operating costs were met, SSCT had $2.27 million available to fund major maintenance and asset renewal.
If the $2.27 million was spent on new, or the renewal of, assets it would be offset against the $8.54 million reduction in assets due to deprecation. The $6.27 million gap between these two figures is the amount by which the condition of the assets deteriorated over the year.
Based on the above, it is unlikely that SSCT is fulfilling the functions under its Act. However, to raise revenue without compromising community access to the facilities is also unlikely. This places the Trust members in the difficult position of being accountable for assets they don't have the financial ability to maintain.
Source: Victorian Auditor-General's Office.
Recommendation
- That the Department of Treasury and Finance work with agencies to address accountability obligations when statutory responsibilities for governance and the funding models are not aligned.
4 Management of employee leave
At a glance
Background
At 30 June 2011, portfolio departments employed approximately 24 730 full-time equivalent staff and had employee leave liabilities of $1 790.5 million.
Conclusion
Overall, leave management policies and practices were adequate. Notwithstanding, there were a range of deficiencies in leave reporting systems, management and oversight arrangements at portfolio departments that could be improved.
Findings
- Across portfolio departments, an average of 5 per cent of staff had annual leave entitlements in excess of 40 days at 30 June 2011. This was consistent with the average of 4.9 per cent reported in 2007–08.
- Documented and approved leave management plans were not in place for 34 of 55 staff (62 per cent) with excess recreation leave, sampled by audit.
- Four portfolio departments did not regularly report on sick leave trends and patterns to management. A further two did not benchmark sick leave data to provide an objective reference point for assessing trends and patterns.
Recommendations
- That portfolio departments prepare and approve leave management plans for all staff with excess annual leave, and actively manage compliance with those plans.
- That portfolio departments report to senior management periodically on sick leave data, including patterns and trends against internal and public sector benchmarks to enable the timely identification of problems, and development of action plans to mitigate risks to staff wellbeing, or underlying issues in the workplace escalating.
4.1 Introduction
Salaries and related costs are the biggest recurrent expenditure items for portfolio departments, totalling $12 389 million and representing 32 per cent of spending in 2010–11 (32 per cent in 2009–10).
At 30 June 2011, portfolio departments employed 24 730 full time equivalent (FTE) staff and had employee leave liabilities of $1 790.5 million ($1 768.6 million in 2009–10). This represented 26 per cent of total liabilities of portfolio departments.
Under the Victorian Public Service Agreement 2006 (VPS agreement) employees, other than casual employees, are entitled to four weeks recreation leave each year. Unless otherwise agreed, the maximum balance an employee may carry forward is 40 days.
Employees, other than casual employees, are also entitled to three weeks paid sick leave each year. Unused sick leave can be accumulated for use in subsequent years, however, the entitlements lapse on resignation or retirement.
Given the quantum of employee costs and related liabilities, portfolio departments need to monitor and effectively manage the financial impacts of these costs, the contributing factors, and the health and wellbeing of their employees.
Effectively managing leave at operational and strategic levels requires policies designed to reduce the accumulation of excess leave and practices that operate to mitigate the risks, thereby avoiding:
- adverse occupational health and safety outcomes
- adverse impacts on employee productivity and opportunities to take leave
- additional financial costs of accumulating excess recreation leave to be paid at higher rates
- the risk that fraud may remain undetected if employees work extended periods without leave.
4.2 Conclusion
Overall, leave management policies and practices were found to be adequate. Notwithstanding, a range of deficiencies in leave reporting systems, management and oversight arrangements remain to be addressed at portfolio departments.
4.3 Leave balances at 30 June
4.3.1 Recreation leave
Figure 4A shows the total number of employees with recreation leave balances in excess of 40 days at 30 June for each of the past four years, and the average days in excess of that amount per FTE for each portfolio department.
Figure
4A
Excess recreation leave balances at 30 June
FTE employees |
Number of staff with excess leave balances |
Average number of days held in excess |
||||||
|---|---|---|---|---|---|---|---|---|
2010–11 |
2007–08 |
2008–09 |
2009–10 |
2010–11 |
2007–08 |
2008–09 |
2009–10 |
2010–11 |
Business and Innovation |
||||||||
769 |
83 |
38 |
43 |
44 |
12.3 |
15.3 |
11.2 |
12.2 |
Education and Early Childhood Development |
||||||||
2 940 |
191 |
234 |
103 |
151 |
13.7 |
15.1 |
14.6 |
12.0 |
Health(a) |
||||||||
1 571 |
N/A |
N/A |
145 |
80 |
N/A |
N/A |
14.1 |
15.8 |
Human Services |
||||||||
3 633 |
278 |
272 |
223 |
298 |
16.8 |
17.3 |
18.7 |
20.2 |
Justice |
||||||||
7 158 |
154 |
181 |
160 |
250 |
10.9 |
12.0 |
12.7 |
11.3 |
Planning and Community Development |
||||||||
973 |
31 |
29 |
18 |
19 |
18.7 |
19.0 |
23.0 |
21.9 |
Premier and Cabinet |
||||||||
462 |
19 |
12 |
22 |
15 |
22.2 |
19.1 |
15.1 |
13.5 |
Primary Industries |
||||||||
2 395 |
127 |
137 |
130 |
162 |
8.4 |
10.7 |
11.1 |
9.9 |
Sustainability and Environment |
||||||||
2 435 |
136 |
97 |
85 |
111 |
13.0 |
10.1 |
11.7 |
9.5 |
Treasury and Finance |
||||||||
1 199 |
71 |
50 |
43 |
52 |
11.6 |
7.2 |
8.7 |
10.3 |
Transport |
||||||||
1 195 |
66 |
65 |
60 |
57 |
24.7 |
24.2 |
24.1 |
18.6 |
Total |
||||||||
24 730 |
1 156 |
1 115 |
1 032 |
1 239 |
15.2 |
15.0 |
15.0 |
14.1 |
(a) The Human Services portfolio was split in August 2009 when the Health portfolio was created. Data for the Health portfolio for 2007–08 and 2008–09 is included in the data for the Human Services portfolio.
Source: Victorian Auditor-General's Office.
The number of employees with excess recreation leave increased from 2007–08 to 2010–11. However, the increase was relative to the increase in FTEs across the portfolio departments in the same period. When the number of staff with excessive recreation leave is taken as a percentage of FTEs, there was little movement over the period with 5 per cent of staff with excessive balances in 2010–11 compared to 4.9 per cent in 2007–08.
The Departments of Human Services (DHS) and Primary Industries (DPI) had higher numbers of staff with excessive recreation leave relative to total FTE employees at 30 June 2011. DHS had 298 staff with excessive recreation leave, 8.2 per cent of its total FTEs of 3 633. DPI had 162 staff with excessive recreation leave, 6.8 per cent of its total FTEs of 2 395. Both departments were above the average for portfolio departments of 5 per cent.
Conversely, the Departments of Planning and Community Development and Premier and Cabinet had relatively small percentages of staff with excessive recreation leave compared to FTEs, being 2 per cent and 3.2 per cent respectfully as at 30 June 2011.
The increasing number of Department of Justice (DOJ) staff with excess leave is an unfavourable trend. Over the past four financial years its number of staff with excessive leave has grown, in particular between 2009–10 and 2010–11 when there was a 56 per cent increase.
4.3.2 Sick leave
Figure 4B shows the average sick leave days taken per FTE portfolio department employee in the past four years.
Figure
4B
Average sick leave days taken per full-time equivalent employee
Portfolio department |
2007–08 |
2008–09 |
2009–10 |
2010–11 |
|---|---|---|---|---|
Business and Innovation |
7.26 |
6.98 |
7.00 |
7.20 |
Education and Early Childhood Development |
6.21 |
7.00 |
6.87 |
7.47 |
Health(a) |
N/A |
N/A |
4.57 |
8.65 |
Human Services |
8.11 |
7.21 |
12.67 |
7.39 |
Justice |
8.53 |
8.61 |
8.48 |
9.35 |
Planning and Community Development |
5.76 |
6.72 |
6.88 |
8.12 |
Premier and Cabinet |
5.76 |
4.63 |
4.37 |
5.09 |
Primary Industries |
4.94 |
5.11 |
6.53 |
6.44 |
Sustainability and Environment |
5.62 |
6.61 |
7.48 |
8.85 |
Treasury and Finance |
7.08 |
8.08 |
8.07 |
8.00 |
Transport |
4.95 |
6.88 |
7.46 |
10.26 |
Total |
6.42 |
6.78 |
7.31 |
7.89 |
(a) The Human Services portfolio was split in August 2009 when the Health portfolio was created. Data for the Health portfolio for 2007–08 and 2008–09 is included in the data for the Human Services portfolio.
Source: Victorian Auditor-General's Office.
The average number of sick leave days taken increased over the past four years. Notwithstanding, an average of 7.89 sick leave days taken (7.31 in 2009–10) was comparable to public service sick leave in New South Wales (8.1 in 2009–10) and Queensland (7.3 in 2009–10).
Staff at DOJ and the Department of Transport (DOT) took more sick leave than the average in 2010–11, with DOJ staff taking 1.5 days (18.5 per cent) and DOT staff taking 2.4 days (30 per cent) more than the average. By our calculations, the higher incidence of sick leave costs DOJ and DOT an extra $4.2 million and $1.1 million per year, respectively.
There was a trend of increasing sick leave taken at the Departments of Planning and Community Development, Sustainability and Environment, and Transport across the four years. The trend needs to be investigated and an approach adopted to manage the leave and the contributing factors.
4.4 Leave management framework
An effective leave management framework enables entities to identify workplace absences and their possible causes, and improve their capacity to implement better practice strategies to address problems. Drawing on the Australian Public Service Commission's 2006 better practice guidelines Fostering an Attendance Culture: A guide for APS agencies, Figure 4C outlines the key elements of an effective leave management framework.
Figure
4C
Key elements of an effective leave management framework
Component |
Key elements |
|---|---|
Policy |
Sets out leave management objectives. Requires compliance with VPS agreement requirements. Details leave entitlements and limitations. Outlines staff responsibilities and leave application requirements. Specifies approval arrangements and delegations. Nominates reporting frequencies and accountabilities. Reviewed and approved by the secretary (or delegate). |
Management practices |
Adhere to leave management policies and VPS agreements. Processing leave applications efficiently and on a timely basis. Monitor leave balances and staff absences. Analyse leave balances and staff absences, including benchmarking. Develop action plans to address areas of concern. Review policies, practices and processes for compliance and quality. |
Governance and oversight |
Comprehensive and regular reporting to executive team and secretary. Monitor compliance with policy. Review leave statistics and benchmark performance. Review leave management policies periodically. Provide direction to management to address areas of concern. Assess risks associated with leave arrangements and outcomes and develop mitigation strategies. Require internal audits to review policy compliance and processes. |
Source: Victorian Auditor-General's Office based on Fostering an Attendance Culture: A guide for APS agencies.
We assessed the leave management framework of the 11 portfolio departments against the elements outlined in Figure 4C.
4.5 Policies
Comprehensive leave management policies assist management to communicate responsibilities, entitlements, and their expectations regarding leave to staff. An effective leave management policy clearly articulates the principles, processes and procedures that apply to all leave, and aligns operations with the strategic activities of portfolio departments.
All 11 portfolio departments had leave management policies approved by their secretary or delegate. The content was generally based on the principles outlined in Figure 4C. However, policies could be strengthened by including:
- details of those specifically accountable for leave management
- requirements for reporting on leave to the secretary.
Leave management policies detailed the responsibility of employees and direct supervisors. However, they consistently did not address:
- the responsibility of senior management to oversight systemic excess recreation leave balances or sick leave absences
- the content and frequency of reporting to senior management.
4.6 Management practices
Practices that encourage compliance with leave management provisions of the VPS agreement include:
- clearly communicating leave entitlements and associated expectations to staff
- direct line managers monitoring and authorising individual employee leave
- training for staff processing leave applications.
Recreation leave
Management at portfolio departments should regularly monitor and assess whether target recreation leave balances are achieved, and review the need for remedial action in light of actual outcomes and trends identified. This enables unfavourable leave outcomes or deficiencies in policies and practices to be addressed in a timely manner.
Business unit managers and/or senior management at all portfolio departments received monthly or quarterly reports monitoring recreation leave balances.
Across the 11 portfolio departments, we reviewed the documented and approved leave management plans for 55 employees with excess recreation leave. Only 21 of the 55 had approved leave management plans.
Instances of excess recreation leave could be further reduced with widespread development of leave plans for employees with excess leave balances, and active management of compliance with them.
Sick leave
Effectively managing sick leave reduces departmental costs associated with avoidable absences, including reduced productivity and the need to engage temporary staff. Senior management should review the adequacy of leave management procedures, assess compliance with relevant internal policies, and monitor leave trends.
Regular leave reports assist senior management in identifying areas of concern, and enable the implementation of appropriate remedial action. Sick leave can be reduced if management:
- monitors sick leave and is responsive to changing trends across the entity
- demonstrates a commitment to staff health and wellbeing
- deals with difficult issues relating to sick leave as they arise, to mitigate the risks that issues escalate to more significant problems.
All portfolio departments use electronic leave management systems to record and process leave applications and approvals, however, there were notable differences in the processes to analyse and report to management. Four portfolio departments did not regularly report to management on sick leave absenteeism, trends or patterns.
Benchmarking sick leave information against reliable and comparable statistics provides an objective reference point for management to establish targets and monitor performance and trends. Benchmarking can also be used to assess whether trends are within 'normal' parameters.
The State Services Authority produces an annual analysis of the public sector workforce, including leave information, which can be used by portfolio departments as an external reference point. The current average for sick days taken is 8.1 days per FTE employee across the whole public sector, compared to 7.89 days at portfolio departments.
Internal benchmarks can also assist management to identify changing patterns and the need for timely intervention strategies.
Of the seven portfolio departments that report sick leave information to management, five reported against a relevant benchmark. Better practice was observed at the Departments of Health and Human Services, where quarterly management reports provided sick leave data by business unit, benchmarked against internally established targets and prior year information.
4.7 Governance and oversight
Senior management should periodically review leave management policies and procedures to determine whether they accurately reflect the operational direction and strategic position of the entity, and to enable areas of emerging concern to be proactively addressed. Reviews should confirm whether policies and procedures are up-to-date following changes in legislative or operational requirements. They also enable business improvements to be identified, for example, more effective reporting procedures or enhanced use of computer software.
All portfolio departments had current leave management policies, reviewed periodically, and updated when required. Management practices and processes were also reviewed in conjunction with policies, however, there was no documentary evidence confirming this.
Recommendations
- That portfolio departments prepare and approve leave management plans for all staff with excess annual leave, and actively manage compliance with those plans.
- That portfolio departments report to senior management periodically on sick leave data, including patterns and trends against internal and public sector benchmarks to enable the timely identification of problems, and development of action plans to mitigate risks to staff wellbeing, or underlying issues in the workplace escalating.
5 Grants management
At a glance
Background
Grants are provided to organisations or individuals to support or contribute to the achievement of government policy outcomes. A total of $8 547 million was paid by the general government sector to entities not included within the Victorian state government.Conclusion
Grants administration policies and practices of the 11 portfolio departments were adequate. There are opportunities for improvement across the portfolio departments.
Findings
- For nine of the 14 grants programs examined, good practice was evident at all stages of the grants approval process. The others lacked conflict of interest declarations (four programs) or financial viability assessments (one).
- The Departments of Justice, Primary Industries, and Sustainability and Environment did not have consolidated grants management systems, which may limit timely access to, and reporting of, grants information.
Recommendations
- That portfolio departments reinforce the importance of conflicts of interests declarations by all staff undertaking grants assessments.
- That the Departments of Justice, Primary Industries, and Sustainability and Environment leverage the experience and expertise of other portfolio departments to examine the costs and benefits of a consolidated grants management system.
5.1 Introduction
Government grants are provided to organisations or individuals to support or contribute to the achievement of government policy outcomes.
In 2010–11, the general government sector made grant payments totalling $8 547 million ($9 175 million in 2009–10) to entities not included within the Victorian state government.
Given the financial significance of grants expenditure, and as part of a cyclical review of controls, we reviewed the management controls and processes over grants administration at portfolio departments. The focus was on grant funding allocated to applicants through a competitive process, and where the final allocation of money was at the discretion of the portfolio department.
The Departments of Health, Human Services, Transport, Treasury and Finance did not distribute discretionary funding during 2010–11 and were therefore not included in the review.
5.2 Conclusion
Overall, grants administration policies and practices were adequate. However, there are opportunities to improve grants program planning, reporting, management and oversight across the portfolio departments.
5.3 Grants management framework
Comprehensive grants management frameworks support the delivery of effective grants programs, conducted in an ethical and transparent manner, that provide value‑for-money. Figure 5A outlines the key elements of an effective grants management framework.
Figure
5A
Key elements of an effective grants management framework
Component |
Key elements |
|---|---|
Policy |
Defines 'grants'. Sets out planning requirements for grants program initiation. Identifies applicant assessment process and selection criteria. Specifies key principles, requirements, roles and responsibilities associated with evaluating applicants. Sets minimum requirements for grants agreements. Lists key reporting requirements. Sets out approval arrangements for grants payments and variations to grants. |
Management practices |
Selection criteria for program developed. Conflicts of interests declared by assessors and managed. Selection criteria applied, and a robust assessment and equity in selection evidenced. Financial viability assessment performed. Decision adequately documented. Funding agreement appropriate and adequate. Funding agreement signed. Segregation of duties adequate. Amount and timing of grants payments in accordance with the funding agreement. |
Governance and oversight |
Grants program information captured and recorded in a system that supports monitoring and oversight. Grants programs monitored. Cash flow forecasts are accurate. Reporting to secretary and/or senior management of progress and outcomes of grant programs is required. Individual grants are monitored by progress and milestones, and acquitted in accordance with funding agreements. Timely corrective action is taken where required. |
Source: Victorian Auditor-General's Office.
5.4 Policies
The Financial Management Act 1994 (FMA) requires portfolio departments to have a policy for the management of discretionary benefits (grants). The elements expected to be in a grants management policy are outlined in Figure 5A.
The policies of the seven portfolio departments that provided discretionary funding were assessed against the criteria outlined in Figure 5A.
Four had comprehensive policies consistent with good practice. Three did not have an overarching grants management policy but had documented general principles and procedures that referred to better practice guidelines.
5.5 Management practices
We reviewed management practices for 14 programs across the seven portfolio departments to determine if they were sufficiently rigorous and transparent, and whether the basis of decisions to award grants was sound. Our assessments were made against the good practice criteria outlined in Figure 5A.
One successful and one unsuccessful applicant from each of the 14 programs were reviewed.
For nine of the 14 programs examined, good practice was evident at all stages of the grant approval process. In particular:
- uniform selection criteria were developed and evaluation processes specified
- conflict of interests declarations were completed by those involved in the selection process
- uniform selection criteria were used to assess both applicants and decisions were adequately documented
- financial viability of the submissions was assessed
- funding agreements were established and signed by both parties
- individuals involved in the selection process were segregated from those approving funding agreements
- performance measures to assess the effectiveness of the funded activity were documented, and communicated to the successful applicant.
However, deficiencies were noted in the assessment and approval processes in five of the 14 programs reviewed, including:
- conflict of interests disclosures were not made by members of the evaluation panel of four programs
- the financial viability of one applicant was not assessed.
The management of risks associated with conflict of interests is fundamental to the integrity of the grants management process. Failure to manage actual, potential or perceived conflicts of interests gives rise to risks of:
- non-compliance with legal requirements
- misconduct, abuse of office or corruption, which can result in inaccurate financial information being disclosed in financial reports
- reputational damage.
A grant applicant's financial viability should be assessed to provide assurance that project outcomes are likely to be delivered, the project will be sustainable and value‑for‑money achieved.
5.6 Governance and oversight
A sound and well implemented governance and accountability framework for grants management is important for assuring programs meet government needs. Throughout the life cycle of a grants program, the outcomes achieved should be evaluated against project-specific and program-related objectives. Performance measures to assess effectiveness should be determined during program planning.
Performance measures were established for most grants programs examined. However, they were not documented for two of the 14 programs.
Four of the seven portfolio departments maintained systems which consolidated details of their grants programs. These portfolio departments provided periodic reports to their secretary or senior management to enable monitoring of key deliverables and grants program outcomes.
The Departments of Justice, Primary Industries, and Sustainability and Environment did not have consolidated grants management systems. They operate stand-alone databases, limiting timely access to consolidated information. As a result, these portfolio departments may have limited access to timely and comprehensive reporting.
Integral to the successful delivery of a grants program, is the routine monitoring of individual grants to make sure agreed milestones or other key requirements of funding agreements are met.
Payment processes at the seven portfolio departments were reviewed to determine if milestones or other key requirements of funding agreements had been satisfied before payments were made. For all of the grant programs reviewed, there was evidence that milestones or other key requirements had been met before all payments were made.
Recommendations
- That portfolio departments reinforce the importance of conflicts of interests declarations by all staff undertaking grants assessments.
- That the Departments of Justice, Primary Industries, and Sustainability and Environment leverage the experience and expertise of other portfolio departments to examine the costs and benefits of a consolidated grants management system.
6 Information technology controls
At a glance
Background
Information technology (IT) controls underpin the production of reliable, accurate and timely information, including financial reports. This Part provides our comments on the review of IT change management and IT security controls that apply to portfolio departments.
Conclusion
The management, governance and oversight of IT change management and security in portfolio departments is generally adequate. However, the related policies need to be strengthened.
Findings
- Four of 11 portfolio departments did not have approved change management policies, procedures and supporting tools for financial applications.
- Three portfolio departments did not have an effective IT security training program to communicate IT security requirements.
- Five portfolio departments did not have documented disaster recovery plans and procedures for financial systems.
Recommendations
- That CenITex have its change management policy, and process and procedures guide approved and adopted by senior management.
- That portfolio departments develop, approve and implement change management policies and procedures for all financial applications.
- That portfolio departments develop comprehensive policies and procedures over information technology system security which are approved by the secretary and subject to regular review.
- That portfolio departments develop an information security classification policy that outlines criteria for assigning security classifications to information and the required security controls for each classification.
- That portfolio departments develop, approve and implement disaster recovery policies and procedures for all financial applications.
6.1 Introduction
Information technology (IT) hardware and software are critical to the effective operation of portfolio departments and underpin the delivery of government services and policy outcomes. IT also plays a pivotal role in the production of reliable, accurate and timely external and internal financial reports.
All portfolio departments except the Department of Education and Early Childhood Development have outsourced their IT hardware and operating environments, that is, the people, policies and procedures that support the management of their IT hardware, to CenITex. CenITex is the government's IT shared services agency.
Shared Business Systems (SBS), a division of the Department of Primary Industries, provides business services to the Departments of Planning and Community Development, Primary Industries, and Sustainability and Environment. SBS manages and maintains the Oracle financial applications supporting the preparation of financial reports for these portfolio departments.
The remaining eight portfolio departments operate and manage their own financial applications.
To gain comfort over the effectiveness of IT controls relied upon in the preparation of departmental financial statements, we assessed hardware and software controls at CenITex, SBS and the 11 portfolio departments during our financial statement audits.
We also reviewed controls relating to IT change management and IT security. The results of our review of controls in the two areas of focus are provided in this Part.
6.2 Information technology change management
IT hardware and software require periodic maintenance, upgrade and replacement to enable continued achievement of service levels, to address emerging risks, or to drive continuous improvement.
Every change to IT needs to be managed in a systematic and controlled manner to mitigate the risk of unauthorised change, damage to systems and data resulting from insufficient user testing of proposed changes before implementation, and incorrect change implementation. Change management is the process by which changes are planned, applied, tested, accepted, dispersed, and tracked.
The Financial Management Act 1994 (FMA) requires portfolio departments to implement IT change management controls for their financial systems. IT change management controls should provide comfort over the integrity and reliability of financial systems and data during any change process.
Given the adverse impact which unauthorised or incorrectly implemented changes can have on the functionality, usability and security of financial systems, we reviewed the management controls and processes supporting IT changes at CenITex, SBS and portfolio departments.
6.2.1 Conclusion
Overall, we identified weaknesses in IT change management at portfolio departments. Written IT change management policies did not exist or were not up-to-date at five portfolio departments, and were in draft at CenITex. Despite the lack of written and approved change management policies, we found that CenITex, SBS and the portfolio departments, had sound management practices in place to process changes to their IT systems.
6.2.2 Information technology change management framework
The key elements of an effective IT change management framework are detailed in Figure 6A.
Figure 6A
Key elements of an effective IT change management framework
|
Component |
Key elements |
|---|---|
|
Policy |
Addresses management of all IT application and infrastructure changes. Includes:
|
|
Management practices |
Appropriately endorse policy. Conduct awareness and training activities designed to create an understanding of the policy and procedures and to maintain operational effectiveness. Identify, record and monitor significant changes. Assess the impact of changes on security. Identify and appropriately segregate change management responsibilities. Plan and test changes in separate environments. Regularly review and update policy and procedures and provide to senior management for endorsement. |
|
Governance and oversight |
Manage and monitor compliance with policies and procedures. Periodically review alignment with industry standards and government requirements. |
Source: Victorian Auditor-General's Office.
We assessed the information technology change management framework of CenITex, SBS and the 11 portfolio departments against the elements outlined in Figure 6A.
6.2.3 Policies
IT change management policies assist agencies to reliably plan, authorise and test changes to their IT software and hardware, before implementation. Policies also provide criteria for assessing the success of introduced changes.
Policies should set out the procedures to be followed for any changes to software or hardware, and be approved by senior management.
The findings from our assessments of policies are provided in Figure 6B.
Figure 6B
Assessment of IT change management policies at CenITex, Shared Business Systems and portfolio departments
|
Entity |
Comment |
|---|---|
|
CenITex |
Draft change management policy and process and procedures guide, detailed and consistent with the better practice criteria. Draft policies and procedures require:
Draft change management user guide developed to assist staff throughout the change management process. Policies in draft at the time of our review. This means that the documents have yet to be adopted as part of the CenITex governance structure. |
|
Shared Business Systems |
Current change management policy is consistent with the better practice criteria outlined in Figure 6A. The policy has been developed to promote a controlled environment in which changes to systems and applications can be made. Policies and procedures require:
|
|
Portfolio departments |
The eight portfolio departments that do not outsource financial applications to SBS, plan, develop, test and monitor any changes made to their applications, including financial applications. Four of these eight had detailed IT change management policies and supporting procedures, consistent with the better practice criteria. However, the policy and supporting procedures handbook at one department had not been reviewed and/or updated since 2007. The remaining four did not have approved change management policies, procedures and supporting tools to manage and approve application changes. In their absence there is a heightened risk that changes will not be appropriately designed, tested and approved prior to implementation. Consequently, unauthorised application changes, and changes that do not meet user requirements could occur. This could lead to financial processing disruption and/or an inability of the entity to produce financial reporting information. |
Source: Victorian Auditor-General's Office.
6.2.4 Management practices
Changes to IT software and hardware need to be managed throughout their life cycle and integrated into the production environment in a rational, systematic and controlled manner.
The findings from our assessments of management practices over IT change management are presented in Figure 6C.
Figure 6C
Assessment of IT change management practices at CenITex, Shared Business Systems and portfolio departments
|
Entity |
Comment |
|---|---|
|
CenITex |
Applies documented draft processes and procedures when implementing changes. Guidelines developed so that change requests are recorded and assessed, and approved changes prioritised, planned, built, tested, implemented and evaluated in a controlled manner. |
|
Shared Business Systems |
Changes to the Oracle financial application are managed and implemented upon request and approval from the three portfolio departments it services. Employees follow documented policies and procedures when assessing requests and implementing approved changes. Although SBS requires all changes to be approved by the SBS General Manager or SBS Governance Board, for a number of changes relevant approval could not be located. This increases the risk that unauthorised changes are made to the financial applications of the three portfolio departments SBS service. |
|
Portfolio departments |
Consistent IT change management practices at portfolio departments, including:
At one portfolio department, the development and test environments were not separated from the operating environment. This increased the risk that changes that have not been validated and tested, are implemented into the operating environment. |
Source: Victorian Auditor-General's Office.
6.2.5 Governance and oversight
Policies and procedures should be regularly reviewed and updated to remain relevant. Consistent processes should be followed for each change, and compliance against policies and procedures should be continually monitored throughout the lifecycle of the change. Strong governance and oversight controls were observed at CenITex, SBS and portfolio departments. The results of our examinations are presented in Figure 6D.
Figure 6D
IT change management governance and oversight controls at CenITex, Shared Business Systems and portfolio departments
|
Entity |
Comment |
|---|---|
|
CenITex |
Two groups oversee IT governance and policy compliance. Senior management team is responsible for overall governance and compliance, and approves the IT change management policy. It meets monthly and reviews reports that contain information on change activity during the period, including the number of:
Change Advisory Board meets weekly and oversees operational change to the environment. Board has technical subject matter experts and business representatives who provide advice on the assessment, prioritisation, scheduling and approval of tabled changes. |
|
Shared Business Systems |
Operations managed by a general manager, accountable to the Department of Primary Industries, through the Chief Information Officer, and responsible for reviewing and approving the IT change management policy. A Change Assessment Board meets weekly to oversee change proposals and provide recommendations to the general manager. The Change Assessment Board is to determine if each change proposal has been appropriately classified, conduct an impact and risk assessment for each change, and determine the priority in relation to other outstanding requests. It monitors employee compliance with documented policies and procedures. |
|
Portfolio departments |
Change management policies and procedures are generally owned by a change manager and endorsed and approved by an IT sub-committee. IT sub-committees are responsible for:
|
Source: Victorian Auditor-General's Office.
6.3 Information technology security
Effective IT system security protects computer applications and infrastructure from threats, in order to promote business continuity, minimise business risk, and reduce the risk of fraud and error.
The information held by portfolio departments can be highly sensitive, and therefore needs to be protected from unauthorised access, theft or manipulation. Inadequate IT security can result in:
- unauthorised access to systems and the information they store
- privacy breaches
- loss of critical business information
- an increase in the risk of material misstatement of financial statements
- disruptions to the delivery of portfolio department outputs
- increased potential for fraud
- damage to reputation.
Given the adverse impact unauthorised access to sensitive information may have, we reviewed the management controls and processes supporting IT security at CenITex, SBS and portfolio departments.
6.3.1 Conclusion
There is adequate management, governance and oversight of IT security at most portfolio departments in relation to financial statement systems. IT security policies need to be tailored for, and consider the risks unique to, each portfolio department.
6.3.2 Information technology security framework
IT security controls are classified into two categories:
- general controls—controls surrounding the environment in which the computer systems operate
- application controls—fully automated controls within the IT system designed to assure completeness and accuracy of processed information.
The key elements of an effective IT security framework are detailed in Figure 6E. The framework draws on the:
- Department of Treasury and Finance's Whole of Victorian Government Information Security Management Framework
- Standing Directions of the Minister for Finance under the Financial Management Act 1994
- International Standard Organisation's ISO27001:2006 Specifications for Information Security Management
- Information Systems and Control Association's best practice guidelines.
Figure 6E
Key elements of an effective information technology security framework
|
Component |
Key elements |
|---|---|
|
Policy |
Documented and addresses:
Sets out a risk based information classification framework. Endorsed by secretary or delegate. |
|
Management practices |
Management should implement:
Maintain an IT risk register addressing security risks and mitigation strategies and regularly report to senior management on programs, activities and achievements. Establish and implement an IT security strategy comprising a plan for the achievement of strategic IT security goals. Conduct awareness raising and training activities to create understanding of the policy, procedures and potential risks. Review alignment with industry standards and government requirements periodically and adjust where necessary. Manage and monitor compliance with policies and procedures. Regularly review and update policy and procedures and provide to senior management for endorsement. |
|
Governance and oversight |
Establish an information security committee that develops and monitors IT security strategies, standards, policies and procedures to address current and future IT security needs. Regularly report risk management strategies to senior management and the secretary to provide assurance that IT security risks are being managed. Establish an information technology steering committee that advises senior management of IT investment requirements and provides guidance on the provision of IT services. |
Source: Victorian Auditor-General's Office.
We assessed the information technology security framework of CenITex, SBS and the 11 portfolio departments against the key elements.
6.3.3 Policies
Portfolio departments process, store and communicate huge volumes of information in electronic format. Effective IT security controls mitigate the risks that information will be inappropriately released and that information will be incomplete, unreliable or inaccurate. IT systems should be supported by security policies and procedures that control user access, and monitor and report compliance with these policies and procedures.
The findings from our assessments of policies are provided in Figure 6F.
Figure 6F
IT Assessment of IT security policies at CenITex, Shared Business Systems and portfolio departments
|
Entity |
Comment |
|---|---|
|
CenITex |
Has a detailed IT security policy and supporting operating procedures formally endorsed by the IT security advisory board. The policy is aligned to government and statutory IT security requirements. Policy applies to all CenITex managed information, and the departmental infrastructure CenITex support. |
|
Shared Business Systems |
Complies with the information and data security policy requirements of the portfolio departments they service. |
|
Portfolio departments |
Eight portfolio departments had documented IT security policies, guidelines and supporting procedures that incorporate elements of good practice, particularly:
However, policies should be strengthened by including:
Three did not have documented policies and procedures tailored to meet their specific IT security requirements. Portfolio departments should have an information security classification policy that outlines criteria for information to be assigned a particular security classification and the required security controls. Four did not have an endorsed information security classification policy. |
Source: Victorian Auditor-General's Office.
6.3.4 Management practices
Training
For IT security policies and procedures to be effective, it is essential that employees receive adequate training in them. This allows policies and procedures to be applied correctly and consistently and can assist management to highlight to staff areas of greatest concern.
Eight portfolio departments recognised the importance of IT security, and the need for regular awareness training. Procedures at these portfolio departments included:
- IT security awareness training provided as part of the induction program for new employees, contractors and third parties
- the existence of a staff awareness strategy
- documented policies, procedures and guidance available to all staff on the intranet
- periodic training reinforcing the importance of IT security.
The remaining three portfolio departments did not have an effective IT security training program to communicate requirements to employees, contractors and third parties.
Monitoring of physical and logical access controls
Physical controls such as physical security barriers at entrances, locking an office at night, storing servers in data centres, and keeping laptop computers in locked cupboards when not being used protect against unauthorised access to IT hardware and operating environments. Physical access controls at CenITex and portfolio departments were adequate.
Logical access controls restrict access to electronic information through methods of identification, authorisation and accountability in computer systems, such as through the use of passwords. They limit access to operating systems to employees with the appropriate authorisation.
Overall, logical access controls at SBS and portfolio departments were adequate. Nevertheless, logical access controls could be strengthened. The commonly identified areas that required improvement were:
- password length, expiry and complexity were not enforced and passwords were not locked out after a specified number of unsuccessful logon attempts
- security activities not adequately logged and monitored
- user access rights not periodically reviewed to determine if rights were commensurate with employee responsibilities
- generic user identification accounts that did not have individual employees assigned to them were being used.
We reported the control weaknesses observed to departmental secretaries and audit committees.
Backup and recovery procedures
To protect important and sensitive information, entities should have appropriate backup and recovery procedures. The procedures should be tested regularly to confirm they are working as intended. It is a requirement of the FMA that portfolio departments maintain up-to-date backups for all financial management systems and data being used.
CenITex, SBS and portfolio departments operated adequate controls to backup information. However, CenITex and five portfolio departments did not have documented plans and procedures detailing how financial information would be recovered in the event that a disaster critically interrupted financial systems.
Management of IT risks
The FMA requires portfolio departments to conduct an assessment of information technology risks and their impact on financial management, and to have this reviewed at least annually. In addition, all public sector agencies are required to identify and manage their risks within the Victorian Government Risk Management Framework.
A risk assessment should identify possible security threats to key information, and enable the development of mitigating controls based on the probability of the risk occurring, the likely impact, and the risk appetite of the entity.
Nine portfolio departments identified, documented and monitored IT risks, including security risks, in a risk register. The remaining two portfolio departments had not identified, and were not monitoring, IT related risks.
6.3.5 Governance and oversight
Portfolio departments should have a sound governance framework over IT security. The establishment of an IT steering committee and IT security committee assists portfolio departments to identify, monitor and manage IT security risks.
The IT steering committee should provide advice to senior management on the IT strategic direction and initiatives of the portfolio department, and guidance on the provision of IT services.
The IT security committee should assist the IT steering committee and senior management to enforce information security governance of departmental information assets. It should set security policies, evaluate and communicate new threats and reduce the risk of intrusion, loss of data integrity and compliance violations.
Ten portfolio departments had established IT steering and IT security committees. Their IT security committees generally monitored and managed compliance with departmental IT security policies and procedures. One portfolio department had also established a specific IT compliance team that perform annual security compliance reviews of IT applications and services.
The Department of Transport's IT steering and IT security committees are currently inactive, leaving a gap in the governance and oversight of security in that department. These committees are scheduled to be reformed in November 2011.
Recommendations
- That CenITex have its change management policy, and process and procedures guide approved and adopted by senior management.
- That portfolio departments develop, approve and implement change management policies and procedures for all financial applications.
- That portfolio departments develop comprehensive policies and procedures over information technology system security which are approved by the secretary and subject to regular review.
- That portfolio departments develop an information security classification policy that outlines criteria for assigning security classifications to information and the required security controls for each classification.
- That portfolio departments develop, approve and implement disaster recovery policies and procedures for all financial applications.
Appendix A. VAGO reports on the results of audits
Figure A1
VAGO reports on the results of the 2010–11 financial audits
Report |
Description |
|---|---|
Auditor-General's Report on the Annual Financial Report of the State of Victoria, 2010–11 |
The result of the audit of the state's annual financial report. It addresses the quality and timeliness of financial reporting, explains significant financial results for the state and makes observations on the status and financial implications of significant projects and developments that occurred during 2010–11 and subsequent to year end. Tabled in Parliament on 9 November 2011. |
Public Hospitals: Results of the 2010–11 Audits |
The results of the audits of approximately 110 entities, addressing the timeliness of their financial reporting, their financial sustainability, and aspects of how they manage procurement and information technology security. Tabled in Parliament on 9 November 2011. |
Water Entities: Results of the 2010–11 Audits |
The results of the audits of 20 water entities addressing the timeliness of their financial and performance reporting, their financial sustainability and aspects of how they manage declarations of interest, asset valuations and outsourcing. Tabled in Parliament on 9 November 2011. |
Portfolio Departments and Associated Entities: Results of the 2010–11 Audits (this report) |
The results of the annual financial statement audits of approximately 210 entities. The report includes comment on the timeliness of financial reporting, financial sustainability and aspects of how grants administration, employee leave, information technology change, and information technology security are managed. |
Local Government: Results of the 2010–11 Audits |
The results of the audits of approximately 100 entities in the local government sector. The report will address the timeliness of their financial and performance reporting, their financial sustainability, their utilisation of internal audit and aspects of how they manage assets and procurement. Proposed to be tabled in Parliament in November 2011. |
Tertiary Education and Other Entities: Results of the 2011 Audits |
The results of the annual financial audits of approximately 120 entities with a financial year other than 30 June 2011. The report will address the timeliness of their financial and performance reporting, their financial sustainability and aspects of how they manage capital projects, information technology security and international student fee revenue. Proposed to be tabled in Parliament in May 2012. |
Source: Victorian Auditor-General's Office.
Appendix B. Acronyms and glossary
Acronyms
| APS | Australian Public Service |
| DHS | Department of Human Services |
| DOJ | Department of Justice |
| DOT | Department of Transport |
| DPI | Department of Primary Industries |
| FMA | Financial Management Act 1994 |
| FTE | Full-time equivalent |
| IT | Information Technology |
| SBS | Shared Business System |
| VFMC | Victorian Funds Management Corporation |
Glossary
Accountability
Responsibility on public sector entities to achieve their objectives, with regard to reliability of financial reporting, effectiveness and efficiency of operations, compliance with applicable laws, and reporting to interest parties.
Acquisition
Acquisition, in relation to assets, means establishing control over the asset, undertaking the risks, and receiving the rights to future benefits, as would be conferred with ownership, in exchange for a cost of acquisition.
Amortisation
The systematic allocation of the depreciable amount of an intangible asset over its expected useful life.
Asset
A resource controlled by an entity as a result of past events, and from which future economic benefits are expected to flow to the entity.
Auditor's opinion
Positive written expression within a specified framework indicating the auditor's overall conclusion on the financial report based on audit evidence obtained. A clear opinion indicates that the financial report has been prepared in accordance with the requirements of relevant legislation and Australian accounting standards.
Audit Act 1994
The Audit Act 1994 establishes the operating powers and responsibilities of the Auditor-General. This includes the operations of his office – the Victorian Auditor‑General's Office (VAGO) as well as the nature and scope of audits conducted by VAGO. The Act also addresses the relationship of the Auditor-General with the Committee as the representative body of Parliament and the Auditor-General's accountability to Parliament for discharge of the position's responsibilities.
Capital expenditure
Amount capitalised to the balance sheet for contributions by a public sector entity to major assets owned by the entity, including expenditure on:
- capital renewal of existing assets that returns the service potential or the life of the asset to that which it had originally
- capital expansion which extends an existing asset at the same standard to a new group of users.
Contributions from the state
Transactions in which one public agency provides goods, services, assets (or extinguishes a liability) or labour to another public agency without receiving approximately equal value in return. Grants can either be of a current or capital nature.
Corporations Act 2001
The Corporations Act 2001 is an act of the Commonwealth of Australia that sets out the laws dealing with business entities in Australia at federal and interstate levels. It focuses primarily on companies, although it also covers some laws relating to other entities such as partnerships and managed investment schemes.
Depreciation
The systematic allocation of the depreciable amount of an asset over its expected useful life.
Emphasis of matter
An auditor's report can include an emphasis of matter paragraph that draws attention to a disclosure or item in the financial report. The addition of an emphasis of matter does not affect the auditor's opinion.
Entity
Is a body whether corporate or unincorporated that has a public function to exercise on behalf of the state or is wholly owned by the state, including: departments, statutory authorities, statutory corporations and government business enterprises.
Expense
Outflows or other depletions of economic benefits in the form of incurrence of liabilities or depletion of assets of the entity, other than those relating to contributions by owners, that results in a decrease in equity during the reporting period.
Financial Management Act 1994
The Financial Management Act 1994 was developed to improve financial administration and accountability and provide for annual reporting to the Parliament by all Victorian public sector agencies.
Financial sustainability
An entity's ability to manage financial resources so it can meet spending commitments, both at present and into the future.
Financial reporting direction
Financial reports are prepared in accordance with Australian Accounting Standards and Interpretations (AAS) as issued by the Australian Accounting Standards Board (AASB). Where an AASB standard provides accounting treatment options, the Department of Treasury and Finance issues Financial Reporting Directions (FRDs) to ensure consistent application of accounting treatment across the Victorian public sector in compliance with that particular standard.
Financial year
The period of 12 months from which a financial report is prepared ending on 30 June each year.
Internal control
A process affected by an entity's structure, work and authority flows, people and management information systems, designed to assist the entity accomplish specific goals and objectives. Internal control is a means by which an entity's resources are directed, monitored and measured. It plays an important role in preventing and detecting fraud and protecting the entity's resources.
Investment
The expenditure of funds intended to result in medium-to long-term service and/or financial benefits arising from the development and/or use of infrastructure or assets by either the public or private sectors.
Liability
A present obligation of the entity arising from past events, the settlement of which is expected to result in an outflow from the entity of resources embodying economic benefits.
Masterfile
A database of entries containing data that does no often change (for example, address and bank account details).
Materiality
Information is material if its omission or misstatement could influence the economic decisions of users taken on the basis of the financial report. Materiality depends on the size of the item or error judged in the particular circumstances of its omission or misstatement. Thus, materiality provides a threshold or cut-off point rather than being a primary qualitative characteristic which information must have if it is to be useful.
Material entity
Material entities represent those entities which are collectively deemed to have a significant effect on the transactions and balances reported in the state's annual report. The selection of these entities follows a detailed analysis of the financial operations of all controlled entities and takes into account any major risk factors that are attached to specific entities or portfolios.
Modified audit report
The types of modified audit reports and the basis for issuing these reports are as follows:
- A 'qualified opinion' is expressed when the auditor concludes that an unqualified opinion cannot be expressed due to a disagreement with management, a conflict between applicable financial reporting frameworks or a scope limitation; however the effect is not so material and pervasive as to require an adverse opinion or a disclaimer of opinion. The qualified opinion is expressed as being 'except for' the effects of the matter to which the qualification relates.
- A 'disclaimer of opinion' is expressed when a limitation of scope of the auditor's work exists and the possible effect of the limitation on scope is so material and pervasive that the auditor has not been able to obtain sufficient appropriate audit evidence and accordingly is unable to express an opinion on the financial statements.
- An 'adverse opinion' is expressed when the effect of a disagreement with management or a conflict between applicable financial reporting frameworks is so material or pervasive to the financial statements that the auditor concludes that a qualification is not adequate to disclose the misleading or incomplete nature of the financial statements.
-
An 'emphasis of matter' is expressed in certain circumstances to
draw attention to, or emphasise, a matter that is included in the note to the
financial statements that is relevant to the users of the auditor's report but
is not of such nature that is affects the auditor's opinion (i.e. the auditor's
opinion remains unmodified). The circumstances in which an emphasis of matter
is used are specified and include:
- when a significant uncertainty exists, the resolution of which depends upon future events and which may materially affect the financial statements;
- when information in a document containing the audited financial statements is materially inconsistent with the financial statements; and
- when financial statements and the auditor's report have been issued and a fact is discovered that leads to revised financial statements and a new auditor's report being prepared.
Other contributions
Transactions in which one non-government agency provides goods, services, assets (or extinguishes a liability) or labour to another non-government agency without receiving approximately equal value in return. Grants can either be of a current or capital nature.
Revenue
Inflows or other enhancements or savings in outflows of service potential, or future economic benefits in the form of increases in assets or reductions in liabilities of the entity, other than those relating to contributions by owners which results in an increase in equity during the reporting period.
Risk
The chance of a negative impact on the objectives, outputs or outcomes of the entity.
Sale of goods and services
Refers to revenue from the direct provision of goods and services and includes fees and charges for services rendered, sale of goods and services, fees from regulatory services, work done as an agent for private enterprises. It is also rental income under operating leases and on produced assets such as buildings and entertainment, but excludes rent income from the use of non produced assets such as land. User charges includes sale of goods and services revenue.
Unprocessed leave
Leave requests submitted, but not yet processed against individual leave balances.
Unqualified audit report
An unqualified audit report is provided when the financial statements give a true and fair view of the matters required by the Financial Management Act 1994, including Australian Accounting Standards and Interpretations, so as to present a view which is consistent with the entity's financial position, its financial performance and its cash flows.
Appendix C. Financial sustainability indicators and criteria
Figure C1
Four core indicators of financial sustainability
Indicator |
Formula |
Description |
|---|---|---|
Underlying result (%) |
Adjusted net surplus/total underlying revenue |
A positive result indicates a surplus, and the larger the percentage the stronger the result. A negative result indicates a deficit. Operating deficits cannot be sustained in the long term. Net result and total revenue is obtained from the operating statement and is adjusted to take into account large one-off (non-recurring) transactions. |
Liquidity |
Current assets/current liabilities |
This measures the entity's ability to pay existing liabilities in the next 12 months. A ratio of one or more means that there are more cash and liquid assts than short term liabilities. Current liabilities have been adjusted to exclude long term employee provisions and on costs that have been disclosed as current liabilities in their financial statements. |
Self-financing (%) |
Net operating cash flows/ underlying revenue |
Measures the ability to replace assets using cash generated by operations. The higher the percentage the more effectively this can be done. Net operating cash flows are obtained from the cash flow statement. |
Capital replacement |
Cash outflows for property, plant, equipment and intangibles/ depreciation and amortisation |
Comparison of the rate of spending on infrastructure, property, plant and equipment and intangibles with its depreciation. This is a long-term indicator, as capital expenditure can be deferred in the short-term if there are insufficient funds available from operations, and borrowing is not an option. Cash outflows for property, plant, equipment, infrastructure and intangibles are taken from the cash flow statement. Depreciation and amortisation is taken from the operating statements. |
Source: Victorian Auditor-General's Office.
Financial sustainability risk assessment
The financial sustainability of entities has been assessed using the risk assessment criteria outlined in Figure C2.
Figure C2
Financial sustainability indicators – risk assessment criteria
Risk |
Underlying result |
Liquidity |
Self-financing |
Capital replacement |
|---|---|---|---|---|
High |
Negative 10% or less |
Equal to or less than 1.0 |
Less than 10% |
Equal to or less than 1.0 |
Insufficient revenue is being generated to fund operations and asset renewal. |
Insufficient current assets to cover liabilities. |
Insufficient cash from operations to fund new assets and asset renewal. |
Spending on capital works has not kept pace with consumption of assets. |
|
Medium |
Negative 10% to zero |
1.0–1.5 |
10–20% |
1.0–1.5 |
A risk of long‑term run down to cash reserves and inability to fund asset renewals. |
Need for caution with cash flow, as issues could arise with meeting obligations as they fall due. |
May not be generating sufficient cash from operations to fund new assets. |
May indicate spending on asset renewal is insufficient. |
|
Low |
More than zero |
More than 1.5 |
20% or more |
More than 1.5 |
Generating surpluses consistently. |
No immediate issues with repaying short-term liabilities as they fall due. |
Generating enough cash from operations to fund assets. |
Low risk of insufficient spending on asset renewal. |
Source: Victorian Auditor-General's Office.
The overall financial sustainability risk assessment is calculated using the ratings determined for each indicator as outlined in Figure C3.
Figure C3
Overall financial
sustainability risk assessment
|
High risk of short-term and immediate sustainability concerns indicated by either:
|
|
Medium risk of longer-term sustainability concerns indicated by either:
|
|
Low risk of financial sustainability concerns—there are no high-risk indicators. |


Source: Victorian Auditor-General's Office.
Appendix D. Audit status
Parliament
Entity |
Reporting framework |
Financial reports |
Finalised within statutory time frame |
|||
|---|---|---|---|---|---|---|
FMA |
Non-FMA |
Clear opinion issued |
Audit report signed |
Met |
Not met |
|
COMPLETED AUDITS WITH 30 JUNE 2011 BALANCE DATES |
||||||
Parliament of Victoria(a) |
Yes |
Yes |
16 Aug 11 |
Yes |
||
Victorian Auditor-General's Office(b) |
Yes |
Yes |
11 Aug 11 |
Yes |
||
2010–11 Total number of entities = 2 |
2 |
0 |
|
|
2 |
0 |
|
|
|
|
Per cent |
100 |
0 |
2009–10 Total number of entities = 2 |
2 |
0 |
|
|
2 |
0 |
|
|
|
|
Per cent |
100 |
0 |
(a) The Parliament of Victoria is an audit by arrangement pursuant to section 16G of the Audit Act 1994 and is not required to prepare a general purpose financial report, however does so in accordance with the Financial Management Act 1994.
(b) The Victorian Auditor-General's Office was audited by a private sector auditor, pursuant to section 7B of the Audit Act 1994.
Source: Victorian Auditor-General's Office.
Business and Innovation
Entity |
Reporting framework |
Financial reports |
Finalised within statutory time frame |
|||
|---|---|---|---|---|---|---|
FMA |
Non-FMA |
Clear opinion issued |
Auditor-General's report signed |
Met |
Not met |
|
COMPLETED AUDITS WITH 30 JUNE 2011 BALANCE DATES |
||||||
Department of Business and Innovation |
Yes |
Yes |
19 Aug 11 |
Yes |
||
INNOVATION, SERVICES and SMALL BUSINESS |
||||||
Australian Synchrotron Company Limited |
C |
Yes |
26 Aug 11 |
Yes |
||
Australian Synchrotron Holding Company Proprietary Limited |
C |
Yes |
26 Aug 11 |
Yes |
||
Federation Square Pty Ltd |
C |
Yes |
2 Sep 11 |
Yes |
||
Film Victoria |
Yes |
|
Yes |
31 Aug 11 |
Yes |
|
Docklands Studios Melbourne Pty Ltd |
C |
Yes |
12 Sep 11 |
Yes |
||
TOURISM AND MAJOR EVENTS |
||||||
Australian Grand Prix Corporation |
Yes |
Yes |
2 Sep 11 |
Yes |
||
Emerald Tourist Railway Board |
Yes |
Yes |
17 Aug 11 |
Yes |
||
Melbourne Convention and Exhibition Trust |
Yes |
Yes |
29 Aug 11 |
Yes |
||
Melbourne Market Authority |
Yes |
Yes |
29 Aug 11 |
Yes |
||
Tourism Victoria |
Yes |
Yes |
11 Aug 11 |
Yes |
||
Victorian Major Events Company Ltd |
C |
Yes |
15 Sep 11 |
Yes |
||
2010–11 Total number of entities = 12 |
7 |
5 |
|
|
12 |
0 |
|
|
|
|
Per cent |
100 |
0 |
2009–10 Total number of entities = 16 |
9 |
7 |
|
|
14 |
2 |
|
|
|
|
Per cent |
88 |
12 |
Note: Non-FMA audit types: C – Corporations Act 2001.
Source: Victorian Auditor-General's Office.
Education and Early Childhood Development
Entity |
Reporting framework |
Financial reports |
Finalised within statutory time frame |
|||
|---|---|---|---|---|---|---|
FMA |
Non-FMA |
Clear opinion issued |
Auditor-General's report signed |
Met |
Not met |
|
COMPLETED AUDITS WITH 30 JUNE 2011 BALANCE DATES |
||||||
Department of Education and Early Childhood Development |
Yes |
Yes |
17 Aug 11 |
Yes |
||
Adult, Community and Further Education Board |
Yes |
Yes |
25 Aug 11 |
Yes |
||
NMIT International Limited |
C |
Yes |
4 Oct 11 |
Yes |
||
TAFE Development Centre Ltd |
C |
Yes |
23 Sep 11 |
Yes |
||
VCAMM Limited |
C |
Yes |
20 Oct 11 |
Yes |
||
Victorian Curriculum and Assessment Authority |
Yes |
Yes |
2 Aug 11 |
Yes |
||
Victorian Institute of Teaching |
Yes |
Yes |
6 Sep 11 |
Yes |
||
Victorian Registration and Qualifications Authority |
Yes |
Yes |
26 Aug 11 |
Yes |
||
Victorian Skills Commission |
Yes |
Yes |
26 Aug 11 |
Yes |
||
2010–11 Total number of entities = 9 |
6 |
3 |
|
|
9 |
0 |
|
|
|
Per cent |
100 |
0 |
|
2009–10 Total number of entities = 4 |
4 |
0 |
|
|
2 |
2 |
|
|
|
Per cent |
50 |
50 |
|
Note: Non-FMA audit types: C – Corporations Act 2001.
Source: Victorian Auditor-General's Office.
Health
Entity |
Reporting framework |
Financial reports |
Finalised within statutory time frame |
|||
|---|---|---|---|---|---|---|
FMA |
Non-FMA |
Clear opinion issued |
Auditor-General's report signed |
Met |
Not met |
|
COMPLETED AUDITS WITH 30 JUNE 2011 BALANCE DATES |
||||||
Department of Health |
Yes |
Yes |
23 Aug 11 |
Yes |
||
AMBULANCE SERVICES AND ASSOCIATED ENTITIES |
||||||
Ambulance Victoria |
Yes |
Yes |
16 Aug 11 |
Yes |
||
MAJOR CEMETERIES |
||||||
Ballarat General Cemeteries Trust |
Yes |
Yes |
25 Aug 11 |
Yes |
||
Bendigo Cemeteries Trust |
Yes |
Yes |
31 Aug 11 |
Yes |
||
Geelong Cemeteries Trust |
Yes |
|
Yes |
18 Aug 11 |
Yes |
|
Greater Metropolitan Cemeteries Trust (c) |
Yes |
N/A |
N/A |
Yes |
||
Mildura Cemetery Trust |
Yes |
|
Yes |
30 Aug 11 |
Yes |
|
Southern Metropolitan Cemetery Trust |
Yes |
Yes |
25 Aug 11 |
Yes |
||
OTHER PUBLIC BODIES |
||||||
Chinese Medicine Registration Board of Victoria |
Yes |
Yes |
10 Aug 11 |
Yes |
||
Health Purchasing Victoria |
Yes |
Yes |
26 Aug 11 |
Yes |
||
Medical Radiation Practitioners Board of Victoria |
Yes |
Yes |
8 Sep 11 |
Yes |
||
Victorian Health Promotion Foundation |
Yes |
Yes |
25 Aug 11 |
Yes |
||
Victorian Assisted Reproductive Treatment Authority |
Yes |
Yes |
29 Aug 11 |
Yes |
||
Victorian Institute of Forensic Mental Health |
Yes |
|
Yes |
26 Aug 11 |
Yes |
|
2010–11 Total number of entities = 14 |
14 |
0 |
|
|
13 |
1 |
|
|
|
|
Per cent |
93 |
7 |
2009–10 Total number of entities = 30 |
30 |
0 |
|
|
30 |
0 |
|
|
|
|
Per cent |
100 |
0 |
(c) At the date of this report, the financial audit of the entity was not complete.
Note: N/A – Not assessed.
Source: Victorian Auditor-General's Office.
Human Services
Entity |
Reporting framework |
Financial reports |
Finalised within statutory time frame |
|||
|---|---|---|---|---|---|---|
FMA |
Non-FMA |
Clear opinion issued |
Auditor-General's report signed |
Met |
Not met |
|
COMPLETED AUDITS WITH 30 JUNE 2011 BALANCE DATES |
||||||
Department of Human Services |
Yes |
Yes |
31 Aug 11 |
Yes |
||
OTHER PUBLIC BODIES |
||||||
Registrar of Housing Agencies(d) |
Yes |
Yes |
29 July 11 |
Yes |
||
WOMEN'S AFFAIRS |
||||||
Queen Victoria Women's Centre Trust |
Yes |
Yes |
22 Aug 11 |
Yes |
||
2010–11 Total number of entities = 3 |
|
|
3 |
0 |
||
|
3 |
0 |
|
Per cent |
100 |
0 |
2009–10 Total number of entities = 2 |
|
|
2 |
0 |
||
|
2 |
0 |
|
Per cent |
100 |
0 |
(d) Financial statements prepared up until 31 December 2011 then transferred to Department of Treasury and Finance.
Source: Victorian Auditor-General's Office.
Justice
Entity |
Reporting framework |
Financial reports |
Finalised within statutory time frame |
|||
|---|---|---|---|---|---|---|
FMA |
Non-FMA |
Clear opinion issued |
Auditor-General's report signed |
Met |
Not met |
|
COMPLETED AUDITS WITH 30 JUNE 2011 BALANCE DATES |
||||||
Department of Justice |
Yes |
Yes |
16 Aug 11 |
Yes |
||
ATTORNEY-GENERAL |
||||||
Judicial College of Victoria |
Yes |
Yes |
29 Aug 11 |
Yes |
||
Legal Practitioners' Liability Fund |
Yes |
Yes |
8 Sep 11 |
Yes |
||
Legal Services Board |
Yes |
Yes |
2 Sep 11 |
Yes |
||
Legal Services Commissioner |
Yes |
|
Yes |
2 Sep 11 |
Yes |
|
Office of Public Prosecutions |
Yes |
Yes |
31 Aug 11 |
Yes |
||
Office of the Victorian Privacy Commissioner |
Yes |
Yes |
18 Aug 11 |
Yes |
||
Professional Standards Council |
Yes |
Yes |
22 Sep 11 |
Yes |
||
Senior Master of the Supreme Court(e) |
O |
Yes |
10 Aug 11 |
Yes |
||
Sentencing Advisory Council |
Yes |
Yes |
26 Aug 11 |
Yes |
||
Victorian Electoral Commission |
Yes |
Yes |
31 Aug 11 |
Yes |
||
Victorian Equal Opportunity and Human Rights Commission |
Yes |
Yes |
2 Sep 11 |
Yes |
||
Victorian Institute of Forensic Medicine |
Yes |
|
Yes |
7 Sep 11 |
Yes |
|
Victorian Law Reform Commission |
Yes |
Yes |
6 Sep 11 |
Yes |
||
Victoria Legal Aid |
Yes |
Yes |
25 Aug 11 |
Yes |
||
CONSUMER AFFAIRS |
||||||
Residential Tenancies Bond Authority |
Yes |
Yes |
17 Aug 11 |
Yes |
||
GAMING |
||||||
Responsible Gambling Advocacy Centre Ltd |
C |
Yes |
23 Sep 11 |
Yes |
||
Victorian Commission for Gambling Regulation |
Yes |
|
Yes |
8 Aug 11 |
Yes |
|
POLICE AND EMERGENCY SERVICES |
||||||
Country Fire Authority |
Yes |
Yes |
10 Aug 11 |
Yes |
||
Emergency Services Telecommunications Authority |
Yes |
Yes |
7 Oct 11 |
Yes |
||
Metropolitan Fire and Emergency Services Board |
Yes |
Yes |
10 Aug 11 |
Yes |
||
Office of Police Integrity |
Yes |
|
Yes |
31 Aug 11 |
Yes |
|
Victoria Police |
Yes |
Yes |
15 Aug 11 |
Yes |
||
Victoria State Emergency Service Authority |
Yes |
Yes |
6 Sep 11 |
Yes |
||
RACING |
||||||
Greyhound Racing Victoria |
Yes |
Yes |
31 Aug 11 |
Yes |
||
Harness Racing Victoria |
Yes |
Yes |
31 Aug 11 |
Yes |
||
HRV Management Limited |
C |
Yes |
31 Aug 11 |
Yes |
|
|
Melton Entertainment Trust |
Yes |
Yes |
20 Sep 11 |
Yes |
||
2010–11 Total number of entities = 28 |
25 |
3 |
|
|
27 |
1 |
|
|
|
|
Per cent |
96 |
4 |
2009–10 Total number of entities = 28 |
25 |
3 |
|
|
28 |
0 |
|
|
|
|
Per cent |
100 |
0 |
(e) The Senior Master of the Supreme Court is an audit by arrangement pursuant to section 16G of the Audit Act 1994 and is not required to prepare a general purpose financial report, however does so in accordance with the Financial Management Act 1994.
Note: Non-FMA audit types: C – Corporations Act 2001, O – Australian Accounting Standards.
Source: Victorian Auditor-General's Office.
Planning and Community Development
Entity |
Reporting framework |
Financial reports |
Finalised within statutory time frame |
|||
|---|---|---|---|---|---|---|
FMA |
Non-FMA |
Clear opinion issued |
Auditor-General's report signed |
Met |
Not met |
|
COMPLETED AUDITS WITH 30 JUNE 2011 BALANCE DATES |
||||||
Department of Planning and Community Development |
Yes |
Yes |
15 Aug 11 |
Yes |
||
PLANNING |
||||||
Architects' Registration Board of Victoria(f) |
Yes |
N/A |
N/A |
|||
Building Commission |
Yes |
Yes |
24 Aug 11 |
Yes |
||
Growth Areas Authority |
Yes |
Yes |
2 Aug 11 |
Yes |
||
Heritage Council |
Yes |
|
Yes |
1 Sep 11 |
Yes |
|
Plumbing Industry Commission |
Yes |
Yes |
25 Aug 11 |
Yes |
||
Victorian Urban Development Authority |
Yes |
Yes |
23 Aug 11 |
Yes |
||
SPORT AND RECREATION AND YOUTH AFFAIRS |
||||||
Melbourne and Olympic Parks Trust |
Yes |
Yes |
25 Aug 11 |
Yes |
||
State Sport Centres Trust |
Yes |
Yes |
26 Aug 11 |
Yes |
||
Victorian Institute of Sport Limited |
Yes |
C |
Yes |
4 Oct 11 |
Yes |
|
Victorian Institute of Sport Trust |
Yes |
Yes |
4 Oct 11 |
Yes |
||
VETERAN'S AFFAIRS |
||||||
Shrine of Remembrance Trustees |
Yes |
Yes |
29 Aug 11 |
Yes |
||
Victorian Veteran's Council |
Yes |
Yes |
18 Aug 11 |
Yes |
||
Melbourne Cricket Ground Trust |
Yes |
Yes |
30 May 11 |
Yes |
|
|
2010–11 Total number of entities = 14 |
13 |
1 |
|
|
11 |
2 |
|
|
|
|
Per cent |
85 |
15 |
2009–10 Total number of entities = 16 |
15 |
1 |
|
|
16 |
0 |
|
|
|
|
Per cent |
100 |
0 |
(f) At the date of this report, the financial audit of the entity was not complete and was not included as part of the statutory time frame metric.
Note: N/A – Not assessed, Non-FMA audit types: C – Corporations Act 2001.
Source: Victorian Auditor-General's Office.
Premier and Cabinet
Entity |
Reporting framework |
Financial reports |
Finalised within statutory time frame |
|||
|---|---|---|---|---|---|---|
FMA |
Non-FMA |
Clear opinion issued |
Auditor-General's report signed |
Met |
Not met |
|
COMPLETED AUDITS WITH 30 JUNE 2011 BALANCE DATES |
||||||
Department of Premier and Cabinet |
Yes |
Yes |
15 Aug 11 |
Yes |
||
ARTS |
||||||
Australian Centre for the Moving Image |
Yes |
Yes |
6 Sep 11 |
Yes |
||
Council of Trustees of the National Gallery of Victoria |
Yes |
|
Yes |
25 Aug 11 |
Yes |
|
Geelong Performing Arts Centre Trust |
Yes |
Yes |
19 Aug 11 |
Yes |
||
Library Board of Victoria |
Yes |
|
Yes |
1 Sep 11 |
Yes |
|
Melbourne Recital Centre Ltd |
Yes |
C |
Yes |
26 Aug 11 |
Yes |
|
Museums Board of Victoria |
Yes |
Yes |
1 Sep 11 |
Yes |
||
State Library of Victoria Foundation |
Yes |
Yes |
1 Sep 11 |
Yes |
||
Victorian Arts Centre Trust |
Yes |
Yes |
31 Aug 11 |
Yes |
||
OTHER |
||||||
Office of the Ombudsman |
Yes |
Yes |
6 Sep 11 |
Yes |
||
State Services Authority |
Yes |
Yes |
1 Sep 11 |
Yes |
||
MULTICULTURAL AFFAIRS AND CITIZENSHIP |
||||||
VITS Languagelink |
Yes |
Yes |
19 Aug 11 |
Yes |
||
2010–11 Total number of entities = 12 |
11 |
1 |
|
|
12 |
0 |
|
|
|
|
Per cent |
100 |
0 |
2009–10 Total number of entities = 12 |
11 |
1 |
|
|
12 |
0 |
|
|
|
|
Per cent |
100 |
0 |
Note: Non-FMA audit types: C – Corporations Act 2001.
Source: Victorian Auditor-General's Office.
Primary Industries
Entity |
Reporting framework |
Financial reports |
Finalised within statutory time frame |
|||
|---|---|---|---|---|---|---|
FMA |
Non-FMA |
Clear opinion issued |
Auditor-General's report signed |
Met |
Not met |
|
COMPLETED AUDITS WITH 30 JUNE 2011 BALANCE DATES |
||||||
Department of Primary Industries |
Yes |
Yes |
19 Aug 11 |
Yes |
||
AGRICULTURE AND FOOD SECURITY |
||||||
Agriculture Victoria Services Pty Ltd |
|
C |
Yes |
23 Aug 11 |
Yes |
|
Phytogene Pty Ltd |
C |
Yes |
23 Aug 11 |
Yes |
||
Dairy Food Safety Victoria |
Yes |
|
Yes |
25 Aug 11 |
Yes |
|
Murray Valley Citrus Board |
Yes |
|
Yes |
31 Aug 11 |
Yes |
|
Murray Valley Wine Grape Industry Development Committee |
Yes |
Yes |
31 Aug 11 |
Yes |
||
Northern Victorian Fresh Tomato Industry Development Committee |
Yes |
Yes |
25 Aug 11 |
Yes |
||
PrimeSafe |
Yes |
|
Yes |
17 Aug 11 |
Yes |
|
Veterinary Practitioners Registration Board of Victoria |
Yes |
Yes |
19 Aug 11 |
Yes |
||
VicForests |
Yes |
Yes |
22 Aug 11 |
Yes |
||
Victorian Strawberry Industry Development Committee |
Yes |
Yes |
25 Aug 11 |
Yes |
||
ENERGY AND RESOURCES |
||||||
Energy Safe Victoria |
Yes |
Yes |
29 Aug 11 |
Yes |
||
2010–11 Total number of entities = 12 |
10 |
2 |
|
|
12 |
0 |
|
|
|
|
Per cent |
100 |
0 |
2009–10 Total number of entities = 12 |
10 |
2 |
|
|
12 |
0 |
|
|
|
|
Per cent |
100 |
0 |
Note: Non-FMA audit types: C – Corporations Act 2001.
Source: Victorian Auditor-General's Office.
Sustainability and Environment
Entity |
Reporting framework |
Financial reports |
Finalised within statutory time frame |
|||
|---|---|---|---|---|---|---|
FMA |
Non-FMA |
Clear opinion issued |
Auditor-General's report signed |
Met |
Not met |
|
COMPLETED AUDITS WITH 30 JUNE 2011 BALANCE DATES |
||||||
Department of Sustainability and Environment |
Yes |
Yes |
24 Aug 11 |
Yes |
||
ENVIRONMENT AND CLIMATE CHANGE |
||||||
Alpine Resorts Co-ordinating Council |
Yes |
Yes |
11 Aug 11 |
Yes |
||
Barwon Regional Waste Management Group |
Yes |
Yes |
19 Aug 11 |
Yes |
|
|
Calder Regional Waste Management Group |
Yes |
Yes |
14 Sep 11 |
Yes |
||
Central Murray Regional Waste Management Group |
Yes |
Yes |
18 Aug 11 |
Yes |
||
Commissioner for Environmental Sustainability |
Yes |
Yes |
22 Aug 11 |
Yes |
||
Corangamite Catchment Management Authority |
Yes |
Yes |
22 Aug 11 |
Yes |
||
Desert Fringe Regional Waste Management Group |
Yes |
Yes |
19 Aug 11 |
Yes |
||
East Gippsland Catchment Management Authority |
Yes |
Yes |
29 Aug 11 |
Yes |
||
Environment Protection Authority |
Yes |
Yes |
2 Sep 11 |
Yes |
||
Gippsland Regional Waste Management Group |
Yes |
Yes |
1 Sep 11 |
Yes |
||
Glenelg Hopkins Catchment Management Authority |
Yes |
Yes |
26 Aug 11 |
Yes |
||
Goulburn Broken Catchment Management Authority |
Yes |
Yes |
19 Aug 11 |
Yes |
||
Goulburn Valley Regional Waste Management Group |
Yes |
Yes |
9 Sep 11 |
Yes |
||
Grampians Regional Waste Management Group |
Yes |
Yes |
19 Aug 11 |
Yes |
||
Highlands Regional Waste Management Group |
Yes |
Yes |
30 Aug 11 |
Yes |
||
Mallee Catchment Management Authority |
Yes |
Yes |
25 Aug 11 |
Yes |
||
Metropolitan Waste Management Group |
Yes |
Yes |
5 Sep 11 |
Yes |
||
Mildura Regional Waste Management Group |
Yes |
Yes |
30 Aug 11 |
Yes |
||
Mornington Peninsula Regional Waste Management Group |
Yes |
Yes |
12 Sep 11 |
Yes |
||
North Central Catchment Management Authority |
Yes |
Yes |
24 Aug 11 |
Yes |
||
North East Catchment Management Authority |
Yes |
Yes |
15 Aug 11 |
Yes |
||
North East Victorian Regional Waste Management Group |
Yes |
Yes |
22 Aug 11 |
Yes |
||
Parks Victoria |
Yes |
Yes |
22 Aug 11 |
Yes |
||
Phillip Island Nature Parks |
Yes |
Yes |
31 Aug 11 |
Yes |
||
Port Phillip and Westernport Catchment Management Authority |
Yes |
Yes |
19 Aug 11 |
Yes |
||
Royal Botanic Gardens Board |
Yes |
Yes |
17 Aug 11 |
Yes |
||
Smart Water Fund |
Yes |
Yes |
6 Sep 11 |
Yes |
||
South Western Regional Waste Management Group |
Yes |
Yes |
19 Aug 11 |
Yes |
||
State Owned Enterprise for Irrigation Modernisation in Northern Victoria |
Yes |
Yes |
29 Aug 11 |
Yes |
||
Surveyors Registration Board of Victoria |
Yes |
Yes |
2 Sep 11 |
Yes |
||
Sustainability Victoria |
Yes |
|
Yes |
16 Aug 11 |
Yes |
|
Trust for Nature (Victoria) |
Yes |
Yes |
5 Sep 11 |
Yes |
||
West Gippsland Catchment Management Authority |
Yes |
Yes |
24 Aug 11 |
Yes |
||
Wimmera Catchment Management Authority |
Yes |
Yes |
19 Aug 11 |
Yes |
||
Zoological Parks and Gardens Board |
Yes |
Yes |
1 Sep 11 |
Yes |
||
2010–11 Total number of entities = 36 |
36 |
0 |
|
|
36 |
0 |
|
|
|
|
Per cent |
100 |
0 |
2009–10 Total number of entities = 37 |
37 |
0 |
|
|
37 |
0 |
|
|
|
|
Per cent |
100 |
0 |
Source: Victorian Auditor-General's Office.
Transport
Entity |
Reporting framework |
Financial reports |
Finalised within statutory time frame |
|||
|---|---|---|---|---|---|---|
FMA |
Non-FMA |
Clear opinion issued |
Auditor-General's report signed |
Met |
Not met |
|
COMPLETED AUDITS WITH 30 JUNE 2011 BALANCE DATES |
||||||
Department of Transport |
Yes |
Yes |
17 Aug 11 |
Yes |
||
PUBLIC TRANSPORT |
||||||
Transport Ticketing Authority |
Yes |
Yes |
9 Sep 11 |
Yes |
||
Victorian Rail Track |
Yes |
Yes |
17 Aug 11 |
Yes |
||
|
C |
Yes |
17 Aug 11 |
Yes |
||
|
C |
Yes |
17 Aug 11 |
Yes |
||
|
C |
Yes |
17 Aug 11 |
Yes |
||
|
C |
Yes |
17 Aug 11 |
Yes |
||
|
C |
Yes |
17 Aug 11 |
Yes |
||
V/Line Passenger Corporation |
Yes |
Yes |
12 Aug 11 |
Yes |
||
V/Line Passenger Pty Ltd |
C |
Yes |
12 Aug 11 |
Yes |
||
ROADS AND PORTS |
||||||
Linking Melbourne Authority |
Yes |
Yes |
16 Aug 11 |
Yes |
||
Port of Melbourne Corporation |
Yes |
Yes |
12 Aug 11 |
Yes |
||
Roads Corporation |
Yes |
Yes |
12 Aug 11 |
Yes |
||
Victorian Regional Channels Authority |
Yes |
Yes |
5 Aug 11 |
Yes |
||
2010–11 Total number of entities = 14 |
8 |
6 |
|
|
14 |
0 |
|
|
|
|
Per cent |
100 |
0 |
2009–10 Total number of entities = 15 |
9 |
6 |
|
|
15 |
0 |
|
|
|
|
Per cent |
100 |
0 |
Note: Non-FMA audit types: C – Corporations Act 2001.
Source: Victorian Auditor-General's Office.
Treasury and Finance
Entity |
Reporting framework |
Financial reports |
Finalised within statutory time frame |
|||
|---|---|---|---|---|---|---|
FMA |
Non-FMA |
Clear opinion issued |
Auditor-General's report signed |
Met |
Not met |
|
COMPLETED AUDITS WITH 30 JUNE 2011 BALANCE DATES |
||||||
Department of Treasury and Finance |
Yes |
Yes |
10 Oct 11 |
Yes |
||
FINANCE |
||||||
Essential Services Commission |
Yes |
Yes |
7 Sep 11 |
Yes |
||
Vicfleet Pty Ltd |
C |
Yes |
7 Oct 11 |
Yes |
||
Victorian Managed Insurance Authority |
Yes |
Yes |
26 Aug 11 |
Yes |
||
|
Yes |
Yes |
26 Aug 11 |
Yes |
||
|
Yes |
|
Yes |
1 Jul 11 |
Yes |
|
ASSISTANT TREASURER |
||||||
Emergency Services Superannuation Scheme |
Yes |
Yes |
26 Aug 11 |
Yes |
||
Emergency Services Superannuation Board |
Yes |
Yes |
26 Aug 11 |
Yes |
|
|
Parliamentary Contributory Superannuation Fund |
Yes |
Yes |
26 Aug 11 |
Yes |
||
Transport Accident Commission |
Yes |
Yes |
26 Aug 11 |
Yes |
||
|
C |
N/A |
N/A |
|||
|
T |
N/A |
N/A |
N/A |
||
|
O |
Yes |
11 Oct 11 |
N/A |
|
|
Victorian WorkCover Authority |
Yes |
Yes |
29 Aug 11 |
Yes |
||
|
Yes |
Yes |
30 Aug 11 |
Yes |
||
TREASURER |
||||||
CenITex |
Yes |
Yes |
17 Aug 11 |
Yes |
||
Rural Finance Corporation of Victoria |
Yes |
Yes |
8 Aug 11 |
Yes |
||
State Electricity Commission of Victoria(f) |
Yes |
N/A |
N/A |
|||
|
C |
N/A |
N/A |
|||
|
C |
N/A |
N/A |
|||
|
C |
N/A |
N/A |
|
||
|
C |
N/A |
N/A |
|||
|
C |
N/A |
N/A |
|||
|
C |
N/A |
N/A |
|||
|
C |
N/A |
N/A |
|||
|
C |
N/A |
N/A |
|||
|
C |
N/A |
N/A |
|||
|
C |
N/A |
N/A |
|||
|
C |
N/A |
N/A |
|||
|
C |
N/A |
N/A |
|||
|
C |
N/A |
N/A |
|||
|
C |
N/A |
N/A |
|||
State Trustees Limited |
C |
Yes |
26 Aug 11 |
Yes |
||
inveST Funds
|
T |
Yes |
26 Aug 11 |
N/A |
||
State Trustees Limited Common Funds comprising:
|
T |
Yes |
26 Aug 11 |
N/A |
|
|
STL Financial Services Limited |
C |
Yes |
26 Aug 11 |
Yes |
||
Treasury Corporation of Victoria |
Yes |
Yes |
11 Aug 11 |
Yes |
||
Victorian Funds Management Corporation |
Yes |
Yes |
6 Sep 11 |
Yes |
||
Queensland Pipeline Pty Ltd |
C |
Yes |
5 Sep 11 |
Yes |
||
VFM Equity Trusts comprising
|
T |
Yes |
1 Sep 11 |
N/A |
||
VFMC Australian Share Trust |
T |
Yes |
1 Sep 11 |
N/A |
||
VFMC Cash Trust |
T |
Yes |
1 Sep 11 |
N/A |
||
VFMC Equity Trust I |
T |
Yes |
1 Sep 11 |
N/A |
||
VFMC Finance Trust |
T |
Yes |
1 Sep 11 |
N/A |
||
VFMC Investment Trust I |
T |
Yes |
1 Sep 11 |
N/A |
||
VFMC Investment Trust II |
T |
Yes |
5 Oct 11 |
N/A |
||
VFMC Investments Pty Ltd |
C |
Yes |
5 Sep 11 |
Yes |
||
VFMC Ontario Inc |
O |
Yes |
5 Sep 11 |
N/A |
||
VFMC Private Equity 1 A Trust |
T |
Yes |
1 Sep 11 |
N/A |
|
|
VFMC Private Equity 1 B Trust |
T |
Yes |
1 Sep 11 |
N/A |
||
VFMC ESSS Private Equity Trust 2004 |
|
T |
Yes |
1 Sep 11 |
N/A |
|
VFMC ESSS Private Equity Trust 2006 |
T |
Yes |
1 Sep 11 |
N/A |
||
VFMC ESSS Private Equity Trust 2007 |
T |
Yes |
1 Sep 11 |
N/A |
||
VFMC UK Investment Trust |
T |
Yes |
1 Sep 11 |
N/A |
||
VFM Multi Strategy Trust comprising
|
T |
Yes |
1 Sep 11 |
N/A |
||
Victorian Plantations Corporation |
Yes |
|
Yes |
17 Oct 11 |
Yes |
|
2010–11 Total number of entities = 56 |
17 |
39 |
|
|
19 |
2 |
|
|
|
|
Per cent |
90 |
10 |
2009–10 Total number of entities = 35 |
17 |
18 |
|
|
30 |
0 |
|
|
|
|
Per cent |
100 |
0 |
(f) At the date of this report, the financial audits of the entities were not complete and was not included as part of the statutory time frame metric.
Note: N/A – Not assessed, Non-FMA audit types: C – Corporations Act 2001, O – Australian Accounting Standards (no statutory time frame), T – Trust Constitution (no statutory time frame).
Source: Victorian Auditor-General's Office.
Appendix E. Audit Act 1994 section 16—submissions and comments
Introduction
In accordance with section 16(3) of the Audit Act 1994 a copy of this report, or relevant extracts from the report, was provided to all portfolio departments and named agencies with a request for comments or submissions.
Responses were received as follows:
- The Department of Treasury and Finance
- The Department of Health
- The Department of Justice
- The Department of Planning and Community Development
- CenITex
The comments and submissions provided for publication are not subject to audit nor the evidentiary standards required to reach an audit conclusion. Responsibility for the accuracy, fairness and balance of those comments rests solely with the agency head.
Submissions and comments received