Public Hospitals: 2015–16 Audit Snapshot
Overview
In this report, we comment on the matters arising from the 2015–16 financial report audits of the 87 public hospitals that make up the hospital sector. We also assess the sector’s financial performance during 2015–16 and its sustainability risks as at 30 June 2016.
We comment on key matters that arose during our audits and an analysis of information in public hospitals’ financial reports. This is one of a set of parliamentary reports on the results of our 2015–16 financial audits.
The following data has been extracted from the published audited consolidated financial statements of the 87 public hospitals in Victoria.
This data has been used to calculate the financial sustainability risk indicators, and should be read in conjunction with Appendix B of the published report.
If you require further information on the financial statements of any Victoria public hospitals, please refer to their website or contact them directly.
- Metropolitan hospitals – extracted data 2015–16 (xlsx)
- Regional hospitals – extracted data 2015–16 (xlsx)
- Rural hospitals – extracted data 2015–16 (xlsx)
- Small rural hospitals – extracted data 2015–16 (xlsx)
Public Hospitals: 2015–16 Audit Snapshot: Message
Ordered to be published
VICTORIAN GOVERNMENT PRINTER November 2016
PP No 223, Session 2014–16
President
Legislative Council
Parliament House
Melbourne
Speaker
Legislative Assembly
Parliament House
Melbourne
Dear Presiding Officers
Under the provisions of section 16AB of the Audit Act 1994, I transmit my report Public Hospitals: 2015–16 Audit Snapshot.
Yours faithfully

Andrew Greaves
Auditor-General
24 November 2016
Audit overview
In this report, we comment on the matters arising from the 2015–16 financial report audits of the 87 public hospitals in the public hospital sector. We also assess the sector's financial performance during 2015–16 and its sustainability risks as at 30 June 2016.
We comment on key matters that arose during our audits and analyse the information in public hospitals' financial reports. This is one of a set of Parliamentary reports on the results of our 2015–16 financial audits.
Conclusion
In the year ended 30 June 2016, the public hospital sector generated a net deficit of $115.9 million—an improvement on the results from 2014–15.
We continue to assess the public hospital sector overall as having a medium financial sustainability risk level.
A challenge remains for some public hospitals to generate positive net results, and to replace assets faster than they use them.
Findings
Financial audit outcomes
Victoria's public hospital sector is made up of 87 public hospitals and 22 controlled entities. All of these hospitals and entities received clear audit opinions on their financial reports for the financial year ended 30 June 2016. Parliament and the Victorian community can have confidence in those reports.
The public hospital sector overall had a net deficit of $115.9 million in 2015–16—less than the $135.8 million net deficit in 2014–15. Increases in capital funding and revenue from private patients and residents drove this improvement.
Through our financial audits, we reviewed the relevant internal control frameworks of each public hospital, and found 236 control weaknesses and financial reporting matters that public hospitals need to address. Public hospitals have acted to remediate matters raised in previous audits—resolving 70 per cent of such matters in 2015–16. However some high and medium risk rated problems remain.
Financial sustainability
Overall the public hospital sector was assessed as having a medium risk to financial sustainability for the year ending 30 June 2016. However, some hospitals continue to face short-term challenges to meet their financial obligations over the next 12 months. This is consistent with our assessments in the previous five years. Capital replacement also remains a moderately rated financial sustainability risk for the sector overall.
Capital funding
In 2015–16, public hospitals received $901 million of capital and specific purpose income in the form of grants, donations and bequests, and capital contributions from the state and other parties. These funds are used by public hospitals to renew and upgrade existing assets, and acquire new assets.
Individual hospitals face challenges in generating sufficient income to renew assets at the pace they are consuming them. To address this, public hospitals continue to use short- to medium-term measures such as selling surplus assets or relying on donations as a means of funding. This is not sustainable in the long-term to address the shortfall between available capital funding and the sector's asset replacement needs for individual hospitals.
Recommendation
- We recommend that public hospitals promptly address matters raised in this year's and previous audits to prevent their potential reoccurrence and rectify any weaknesses in their internal control environment to mitigate the risk of their financial statements having material errors (see Part 2).
Responses to recommendation
We have consulted with all of the public hospitals and the Department of Health & Human Services (DHHS) throughout the course of our audits, and we considered their views when reaching our audit conclusions. As required by section 16(3) of the Audit Act 1994, we gave a draft copy of this report, or relevant extracts, to those agencies and asked for their submissions and comments.
Three agencies provided responses for inclusion in this report. These responses are summarised below and the full responses are included in Appendix A.
DHHS notes that the report provides a reasonable analysis of the issue of public hospital financial sustainability, from the indicators used. It notes that the capital funding for public hospitals is managed through a central government allocation process, and that the department monitors hospital cash requirements on an ongoing basis.
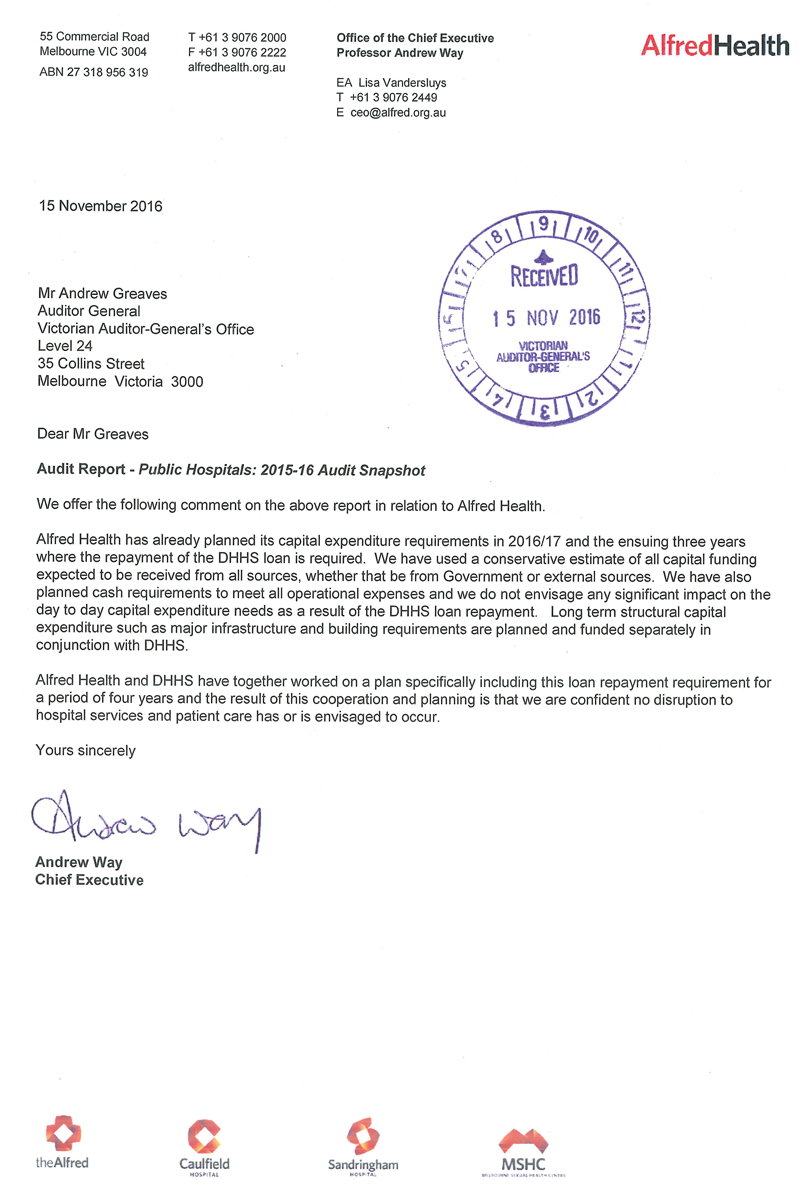
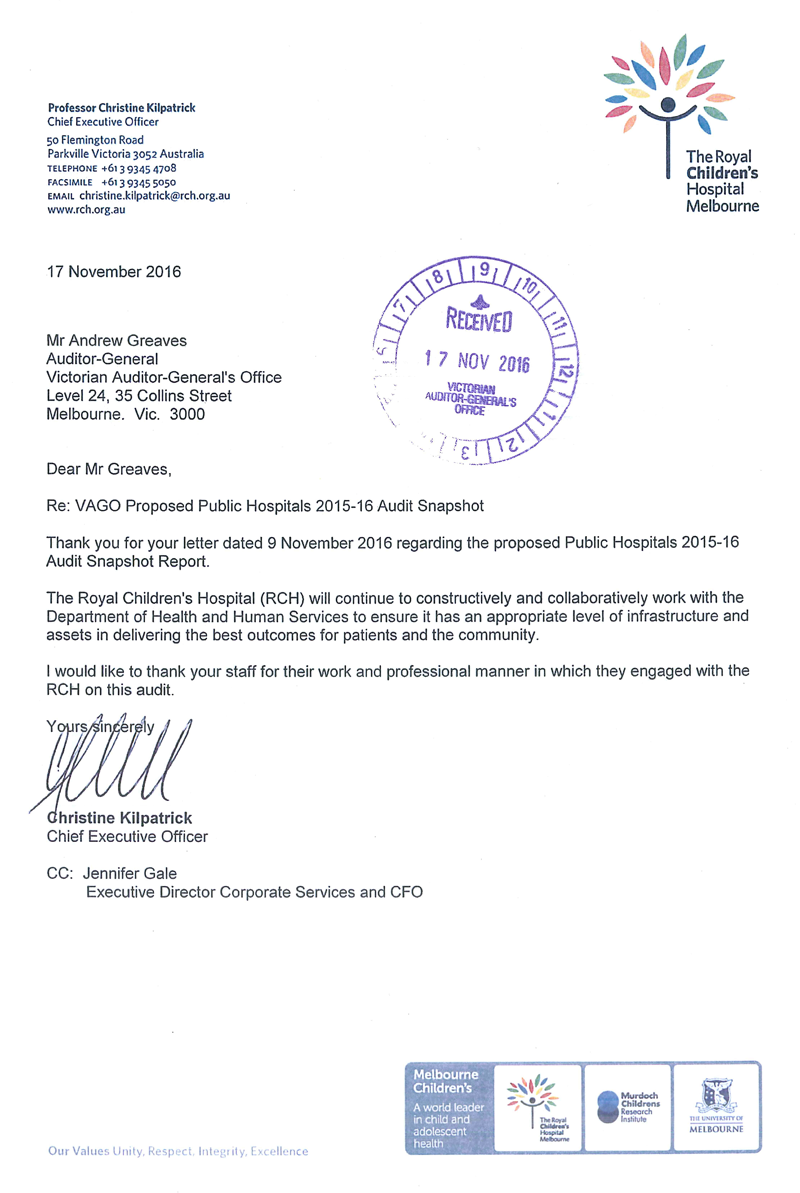
Alfred Health and the Royal Children's Hospital highlighted that they will continue to work with DHHS on the items raised, and Alfred Health provided information on their capital plans, outlined in the case study in Part 4.
1 Context
1.1 Victoria's public hospital sector
Victoria's public hospital sector is made up of 87 public hospitals and 22 controlled entities. The financial results of the controlled entities are consolidated into their parent entities' financial statements, and we do not discuss them separately in this report.
The Victorian public hospital sector provides health care services to all Victorians, and is primarily funded by the state and Commonwealth governments. Funding amounts vary, depending on the types of patients that hospitals treat and the services they provide.
A board governs each public hospital, in line with the Health Services Act 1988 and the terms and conditions of its funding. Each board is responsible to the Minister for Health for setting the strategic direction of the hospital, within the government's framework, and ensuring that the hospital:
- is managed effectively and efficiently
- provides high quality care and service delivery
- meets the needs of the community
- meets its financial and non-financial performance targets.
We have classified the 87 public hospitals into four groups—metropolitan, regional, rural and small rural—based on location, size and the funding they receive.
1.2 Funding public hospitals
1.2.1 Operating funding
Public hospitals must ensure their operations comply with the requirements of various agreements between the Commonwealth and state. These agreements include the National Health Reform Agreement, which, since July 2012, has provided for joint funding of public hospital services.
The National Health Reform Agreement outlines the responsibilities for public hospitals. It establishes a national framework for funding public hospital services using an activity-based funding (ABF) model—a system of funding based on the number of services provided to patients and the amount to be paid for delivering those services.
The state and Commonwealth also provide block grants for services provided by hospitals that may not be practicable to fund through ABF, such as teaching, training and research. Block funding is also provided for small rural hospitals.
Figure 1A shows the flow of funds from government to Victorian public hospitals.
Figure 1A
Funding flows from the Commonwealth and state to Victoria's public hospitals
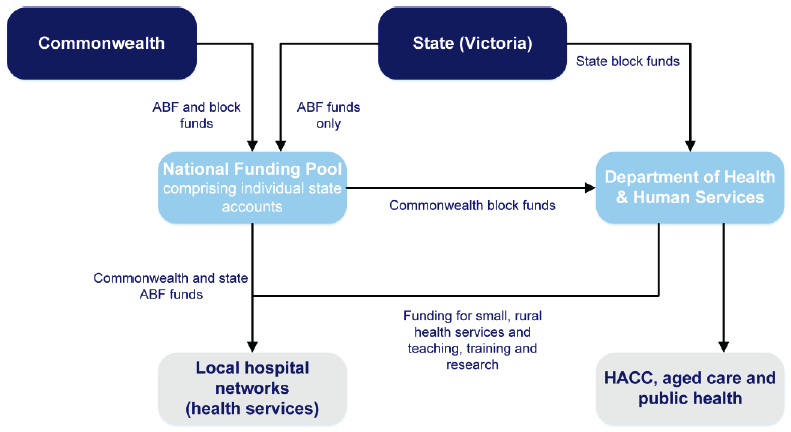
Note: HACC is home and community care, a program that provides home support services so people can live independently at home for longer.
Source: Department of Health & Human Services.
1.2.2 Capital funding
At 30 June 2016, public hospitals controlled $13.5 billion in physical assets including buildings, furniture and fittings, minor plant and medical equipment.
Part 4 of this report contains further details on the capital funding for public hospitals.
1.3 What we cover in this report
In this report, we present a summary of the 2015–16 financial audits of Victoria's 87 public hospitals.
We identify and discuss the key matters arising from our audits and analyse information included in public hospitals' financial reports.
Figure 1B
Report structure
|
Part |
Description |
|---|---|
|
2: Results of audits |
Comments on the results of the financial report audits and the financial outcomes of the 87 public hospitals for 2015−16. Discusses our findings from our review of internal control and/or financial reporting matters identified during the 2015−16 financial audits and previous audits. |
|
3: Financial sustainability |
Provides an insight into the public hospital sector's financial sustainability risks, based on trends in financial sustainability risk indicators in a five-year period. |
|
4: Capital funding |
Comments on capital funding at public hospitals, and some of the challenges they face renewing and replacing property, plant and equipment. |
The financial audits of the 109 entities included in this report were carried out in accordance with section 15 of the Audit Act 1994 and Australian Auditing Standards. Each entity paid for the cost of being audited. The total cost of preparing this report was $235 000, which is funded by Parliament.
2 Results of audits
In this Part, we comment on the results of our financial report audits of Victoria's 87 public hospitals and the financial outcomes for 2015–16.
We also comment on the internal control and financial reporting matters we found, and provide an update on matters raised in previous audits.
2.1 Conclusion
We issued clear audit opinions on all 87 public hospital financial reports for the financial year ended 30 June 2016. Parliament and the Victorian community can have confidence in those reports.
We found the internal controls that support public hospitals' financial reporting were adequate, to the extent we tested them.
The public hospital sector had a net deficit of $115.9 million in 2015–16—less than the $135.8 million net deficit in 2014–15. Increases in capital funding and revenue from private patients and residents drove this improvement.
The financial position of the public hospital sector improved, driven by a $93.7 million increase in the value of public hospital net assets in 2015–16.
2.2 Audits for the year ended 30 June 2016
Auditors' independent opinions on financial statements add credibility to those statements by providing reasonable assurance that the information they contain is reliable and accurate.
A clear audit opinion confirms that the financial report presents fairly the transactions and balances for the reporting period, in keeping with the requirements of relevant accounting standards and applicable legislation.
We conducted our financial audits of the public hospitals in accordance with the Australian Auditing and Assurance Standards.
Clear audit opinions were issued for all 87 public hospital and 22 controlled entities' financial reports for the financial year ended 30 June 2016.
2.3 The public hospital sector's financial results
We measure an entity's financial performance by its net result—the difference between its revenues and expenses. We measure an entity's financial position by looking at the difference between its total assets and total liabilities.
Figure 2A provides an overview of the financial performance and position of Victoria's public hospital sector for 2015–16 and 2014–15, by metropolitan, regional, rural and small rural groups.
Figure 2A
Financial overview of the public hospital sector, 2014–15 and 2015–16
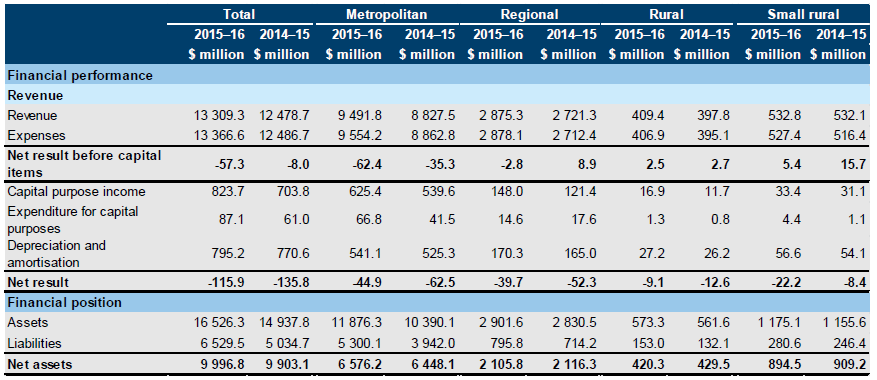
Source: VAGO.
In 2015–16, the public hospital sector generated a net deficit of $115.9 million—an improvement of $19.9 million, or 14.7 per cent, on 2014–15. All groups except small rural hospitals reported better net results for 2015–16 than for 2014–15.
Revenue
In 2015–16, the 87 public hospitals generated revenue of $14.1 billion, including capital purpose income—an increase of $950.5 million, or 7.2 per cent, on 2014–15.
Activity-based funding and commonwealth block grants increased by $493 million, or 6.3 per cent, on 2014–15[1]. There were also increases in capital funding and revenue from private patients and residents in 2015–16 compared to 2014–15.
Expenses
In 2015–16, the sector spent a total of $14.2 billion, an increase of $930.6 million, or 7.0 per cent, on 2014–15. This was due to employee benefits increasing by $496 million, or 5.8 per cent, and spending on supplies and consumables increasing by $285 million, or 16 per cent, on 2014–15.
2.3.1 Financial position
Assets and liabilities
At 30 June 2016, the sector controlled $16.5 billion in assets, an increase of $1.6 billion, or 10.6 per cent, since 30 June 2015. The sector also reported liabilities of $6.5 billion, an increase of $1.5 billion, or 29.7 per cent, since 30 June 2015.
This increase in both assets and liabilities was due mainly to the first-time recognition in the financial reports of the $1.3 billion private≠–public partnership asset of the Victorian Comprehensive Cancer Centre, which houses the new Peter MacCallum Cancer Centre, and the corresponding finance lease liability of $1.1 billion.
2.4 General internal controls and financial reporting
Effective internal controls help entities to reliably meet their objectives, and are a prerequisite for delivering reliable, accurate and timely external and internal financial reports. Poor internal controls make it more difficult for entities to comply with relevant legislation and increase the risk of fraud and error.
In our annual financial audits, we consider the internal controls relevant to financial reporting, and assess whether entities have managed the risk that their financial reports will be incomplete and inaccurate.
The board of each public hospital is responsible for setting up and maintaining internal controls that help to:
- prepare and maintain accurate financial records
- report promptly and reliably, externally and internally
- appropriately safeguard assets
- prevent and detect errors and other irregularities.
In this section, we discuss:
- internal control weaknesses and financial reporting problems common in the 87 public hospitals in 2015–16
- the status of control weaknesses and financial reporting problems that previous audits have found.
2.4.1 Common internal control weaknesses and financial reporting problems
During our financial audits, we found that public hospitals' internal controls, to the extent we tested them, were adequate for ensuring that financial reports were reliable. However, we found some instances where hospitals need to strengthen internal controls or address financial reporting matters.
During 2015–16, our audit teams reported 236 internal control weaknesses and financial reporting problems to management, boards and audit committees. Figure 2B shows the number of issues identified, by risk rating, excluding matters rated as low risk. We define each risk rating in Appendix C.
Figure 2B
Management letter matters by subject area and risk rating, 2015–16
|
Subject area |
Risk rating |
|||
|---|---|---|---|---|
|
Extreme |
High |
Medium |
Total |
|
|
Financial reporting matters |
– |
2 |
26 |
28 |
|
Expenditure and accounts payable matters |
– |
4 |
19 |
23 |
|
Information technology |
– |
11 |
13 |
24 |
|
Fixed assets |
– |
1 |
7 |
8 |
|
Payroll |
– |
3 |
15 |
18 |
|
Revenue, cash and accounts receivable |
– |
1 |
10 |
11 |
|
Other |
– |
– |
6 |
6 |
|
Total |
– |
22 |
96 |
118 |
Note: Figure 2B excludes 118 low-risk matters raised.
Source: VAGO.
Financial reporting matters
A financial report is prepared from data contained in a financial system that is supported by transaction-level data in sub-systems, such as accounts payable, fixed assets, cash and payroll systems.
A reconciliation of the sub-system and main-system balances confirms that information is complete and accurate. A timely, independent review of such reconciliations reduces the risk of inaccurate information, undetected errors and non-resolution of errors.
Nineteen public hospitals had reconciliation issues because no independent reviews took place, they were not prompt, or the differences between the systems were not explained or corrected.
Expenditure and accounts payable matters
In 2015–16, public hospitals paid suppliers $2 billion. Proper controls should be in place to ensure payments are correct. At 12 public hospitals, we found problems with the authorisation and processing of payments.
Public hospitals sometimes use corporate credit cards to pay suppliers. Effective controls ensure that all transactions are appropriate and approved. Thirteen public hospitals have weak controls over how staff use corporate credit cards. We found no supporting documents for credit card payments or reconciliation of corporate credit card transactions.
Information technology controls
Information technology controls protect computer applications, infrastructure and information assets from many threats to security and access. Effective information technology controls:
- promote business continuity
- minimise business risk
- reduce the risk of fraud and error
- help meet business objectives.
Public hospitals rely extensively on information technology. In the Financial Systems Controls Report: 2015–16, tabled in November 2016, we noted that, as in 2015, common matters raised across government were also found in the public hospital sector during 2015–16. They were mostly about users' access and authentication controls.
Continuing internal control weaknesses and financial reporting problems
Management letters inform management, boards, and audit committees about the status of internal control weaknesses and financial reporting problems found in previous audits. We monitor these weaknesses and problems to ensure that entities act promptly to resolve them.
Figure 2C shows the internal control weakness and financial reporting problems raised in previous audits, with the resolution status, by risk rating.
Figure 2C
Internal control weaknesses and financial reporting problems—resolution status by risk rating
| Issue status |
Risk rating |
|||
|---|---|---|---|---|
|
Extreme |
High |
Medium |
Total |
|
|
Unresolved |
– |
10 |
38 |
48 |
|
Resolved |
– |
18 |
92 |
110 |
|
Total |
– |
28 |
130 |
158 |
Note: Figure 2C excludes low-risk matters raised.
Source: VAGO.
At the start of 2015–16, 158 issues remained open. Seventy per cent of these matters were resolved during 2015–16.
However, 10 high-risk and 38 medium-risk problems raised in previous years remain unresolved. Failure to resolve these problems reduces the effectiveness of the internal control environment. This could lead to public hospitals being unable to achieve their objectives, comply with relevant legislation or identify material misstatements.
Appendix C includes information about time lines for resolution of internal control weaknesses and financial reporting problems.
Footnote
1: Department of Health & Human Services 2015–16 financial statements.
3 Financial sustainability
In this Part, we provide an insight into the financial sustainability risks to the 87 public hospitals, using a set of financial indicators.
To be financially sustainable, hospitals need to be able to fund their current and future costs. They also need to be able to absorb the financial effects of economic changes and financial risks, without significantly changing their revenue and expenditure policies.
We assess financial sustainability risks from both short- and long-term perspectives. Short-term indicators provide information about how well a hospital can keep positive operating cash flows or generate an operating surplus over the short term. Long-term indicators focus on a hospital's ability to fund asset replacement.
We also discuss current challenges to public hospitals' financial sustainability and the trends over a five-year period. To do this, we assess whether hospitals generate enough surplus funds from operations to maintain essential services and renew assets.
3.1 Conclusion
For the year ending 30 June 2016, we have assessed the public hospital sector as facing a medium risk to financial sustainability. This is consistent with our assessments in the previous five years.
3.2 Challenges to financial sustainability
We use four financial sustainability risk indicators for a five-year period to assess the risks that public hospitals face. The financial sustainability risk indicators are based on the consolidated financial statements of each public hospital. Appendix B describes the financial sustainability indicators, risk assessment criteria and benchmarks we have used, and provides detailed analysis of each public hospital.
Forming a definitive view of an entity's financial sustainability requires an analysis that moves beyond historical financial considerations to include the entity's financial forecasts, strategic plans, operations and environment. We do not examine these additional considerations in this report.
3.2.1 Overall assessment
Figure 3A provides a snapshot of the four financial sustainability indicators by group against the sector average for the past five years.
For the year ended 30 June 2016, after considering all the indicators, we have assessed the public hospital sector as facing a medium risk to financial sustainability.
Figure 3A
Public hospitals' financial sustainability
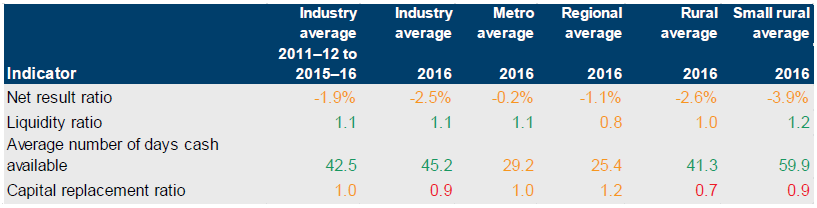
Note: Red indicates an assessment rated as high risk, orange indicates medium risk and green indicates low risk.
Source: VAGO.
3.2.2 Short-term indicators
Short-term indicators—net result, liquidity and available cash days—focus on a public hospital's ability to maintain operating cash flows and adequate cash holdings, and to generate an operating surplus over the short term.
The hospital sector has improved its performance and reduced the risk of financial issues in the short term. Although the sector generated a low liquidity risk and reasonably consistent average number of cash days available overall, 24 hospitals continue to face challenges to meet their financial obligations over the next 12 months. These hospitals sought written confirmation from the Department of Health & Human Services that adequate cash-flow support would be available, if required, to allow them to meet current and future operational obligations when they fall due.
Net result
Figure 3B shows the average net result indicator for the sector and by group for a five‑year period.
Figure 3B
Average net result indicator, 2011–12 to 2015–16
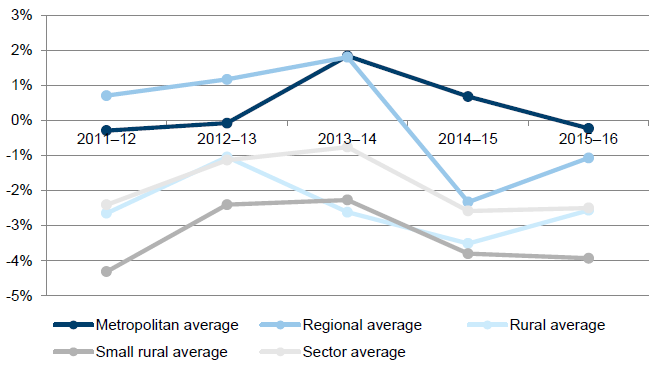
Source: VAGO.
The sector depends heavily on grant funding from the state and Commonwealth governments. Under the funding model, public hospitals receive predetermined activity and block funding based on the operational services they agree to deliver during the financial year.
3.2.3 Longer-term indicator
Public hospitals should be maintaining existing assets, and providing new assets, to enable them to provide the quality of services required by the community. The longer‑term indicator of capital replacement assesses the ability of public hospitals to replace or renew fixed assets at the rate they use them. Annual expenditure used to calculate the capital replacement ratio includes spending on replacing existing assets as well as spending on new assets. The ratio can therefore be distorted over the short term by large projects that require acquisition of new assets.
Capital replacement
Overall, the sector has a medium risk for capital replacement across a five-year period. However, as shown in Figure 3C, each group shows fluctuations in capital expenditure. Rural and small rural hospitals, in particular, struggle to sustain capital spending for renewing or replacing assets at the rate they depreciate.
The noticeable peaks in Figure 3C on the average capital replacement indicator result in each group over five years relate to specific key events:
- metropolitan group—spending to construct the Victorian Comprehensive Cancer Centre (through the Peter MacCallum Cancer Centre) in 2014–15
- regional group—the capital expenditure for stage 1 of the redevelopment of Echuca Regional Health in 2013–14
- rural group—the capital expenditure by Gippsland Southern Health Service for the Leongatha hospital redevelopment project in 2012–13
- small rural group—the capital expenditure mainly by four hospitals in central and northern Victoria to expand and redevelop hospitals in 2014–15.
Figure 3C
Average capital replacement indicator for public hospitals, 2011–12 to 2015–16
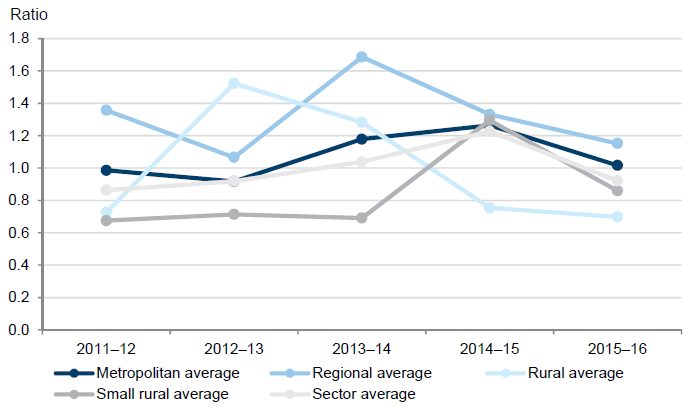
Source: VAGO.
Public hospitals generally receive capital funding from both the state and Commonwealth. Therefore, the timing and extent of a public hospital's major capital works affects the outcome of this indicator. Public hospitals need to assess the longer‑term risks of not replacing assets as quickly as they are consumed.
4 Capital funding
In 2015–16 public hospitals controlled $13.5 billion in physical assets.
These assets, which include medical infrastructure, property, plant and equipment, need to be periodically renewed, upgraded or replaced to meet increasing safety and care standards.
In this Part, we examine the capital funding model for public hospitals and some of the challenges they face renewing and replacing property, plant and equipment. We also present case studies to illustrate the actions taken by public hospitals when capital funding is insufficient.
4.1 Conclusion
At an overall sector level, public hospitals appear to have adequate capital funding to cover depreciation. However, individual hospitals face challenges in generating sufficient income for capital works to keep pace with their consumption of assets.
To address this, public hospitals continue to use short- to medium-term measures such as selling surplus assets or relying on donations as a means of funding. These are not sustainable in the long term to address the shortfall between available capital funding and the need for asset replacement in individual hospitals.
4.2 Public hospitals capital funding
In 2015–16, public hospitals received $901 million of capital and specific purpose income in the form of grants, donations and bequests, and capital contributions from the state and other parties. These funds are used by public hospitals to renew and upgrade existing assets, and acquire new assets.
Figure 4A shows the total capital funding received by public hospitals across a five‑year period, classified by group.
Figure 4A
Capital funding received, 2011–12 to 2015–16
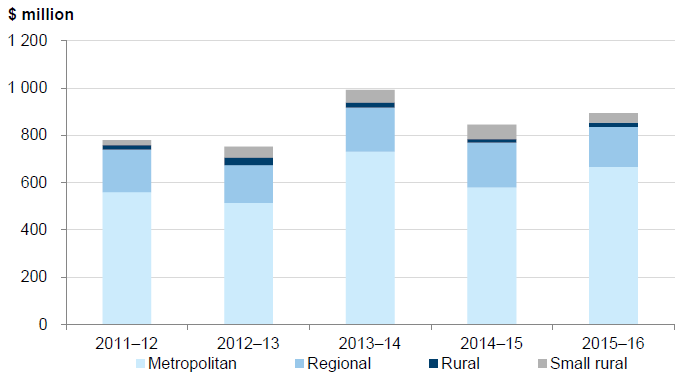
Source: VAGO.
Capital funding received by the public hospital sector has been relatively consistent over the last five years—averaging $852 million annually. Metropolitan and regional groups receive most of the capital funding as they manage $12.4 billion of the sector's $13.5 billion of assets.
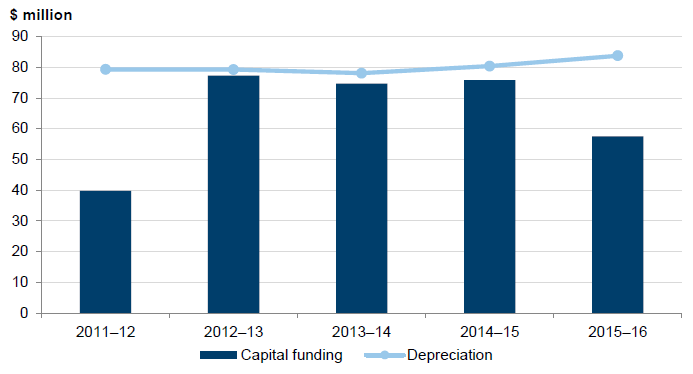
Figure 4B shows total capital funding compared with total depreciation, over a five‑year period.
Figure 4B
Total capital funding and depreciation, 2011–12 to 2015–16
|
2011–12 |
2012–13 |
2013–14 |
2014–15 |
2015–16 |
|
|---|---|---|---|---|---|
|
Total capital funding |
779.3 |
751.3 |
991.8 |
844.9 |
893.7 |
|
Total depreciation |
689.1 |
706.3 |
720.1 |
770.6 |
795.2 |
Source: VAGO.
At a sector level, total capital funding covers depreciation—which is a measure of the consumption of assets in a given year. However, capital funding is used not only to renew and upgrade existing assets, but also to acquire new assets. Large projects for new assets receive significant capital funding—for example, the Victorian Comprehensive Cancer Centre. Consequently the inclusion of new asset capital funding means that funding for existing assets may not equate to the depreciation of existing assets.
There are individual hospitals across the sector that are not replacing assets at the rate they are being used, as measured by depreciation. This is most prevalent in the rural and small rural hospital groups, who reported the least amount of capital funding relative to the metropolitan and regional hospitals.
Figure 4C shows the capital funding against depreciation for the rural and small rural groups.
Figure 4C
Total capital funding and depreciation for rural and small rural hospitals, 2011–12 to 2015–16
Source: VAGO.
Figure 4C shows, over a five-year period, that capital funding is lower than depreciation. As a result, public hospitals need to look at alternative sources of income to supplement their capital funding. This is consistent with our capital replacement indicator result in Figure 3A.
4.3 Case studies
We looked at four public hospitals to provide an insight into the challenges that hospitals face in funding asset renewal and replacement, and the actions they take to overcome those challenges. The four types of action these public hospitals took were to:
- identify and sell surplus assets
- use donations, usually given to a public hospital's charitable foundation
- seek additional funding streams, such as a loan from the Department of Health &Human Services (DHHS) or funds generated by subsidiaries
- work with DHHS to ensure that a redevelopment of the public hospital will provide funding for new equipment.
4.3.1 Selling surplus assets
Figure 4D shows a case where a small rural hospital sold surplus assets and applied other strategies to fund the purchase of assets or defer replacement.
Figure 4D
Case study: Castlemaine Health
|
Background Castlemaine Health (CH) is a 200‑bed hospital with more than 660 staff. CH provides medical, surgical, midwifery, rehabilitation, residential aged care and allied health services to a population of 17 000 people. Fixed assets and funding replacement assets As at 30 June 2016, CH had $47 million ($49 million in 2014–15) of fixed assets, made up of property, plant and equipment. In 2015–16, CH had a capital budget of $1.3 million to fund new or replacement assets. This included $720 000 in discretionary funding from DHHS. To fund the gap between the CH budget and funding from DHHS: CH applied for an additional $310 000 from DHHS to fund a new Nurse Call System. The current Nurse Call System is more than 40 years old and no longer fit for purpose. CH identified other funding sources to cover the remaining $280 000 gap, which was allocated for minor projects. These funding sources included interest on aged care accommodation bonds, community initiatives and targeted philanthropic bequests. Issues affecting delivery of capital program During 2015–16, CH faced several events that affected its ability to deliver its capital works program: CH has limited cash reserves to contribute to a capital program and relies heavily on DHHS for capital funding. CH's computed tomography (CT) scanner malfunctioned during 2015–16 requiring the machine to be decommissioned. As the CT scanner was not owned by CH, DHHS advised CH that it was unable to apply for funding to replace the scanner. Therefore, CH paid to transport patients to Bendigo for these services. Members of the community had no access to CT services that had previously been provided locally. DHHS delayed announcing the outcome of an application for funding of the Nurse Call System by five months, until March 2016. After DHHS announced the funding outcome, the money was not received until late in 2015–16. This delayed the project until 2016–17. Meanwhile, CH had identified other projects that could be delayed to fund the Nurse Call System, which was deemed to be a high-risk issue for operations. These other projects were also delayed until DHHS finalised the funding decisions. Solutions to funding issues At first, CH considered the option of leasing a new CT scanner, but this option was not pursued because of constraints that prevented CH entering a leasing arrangement. The CH's board identified surplus assets that could be liquidated to pay for the CT scanner and reallocated these funds from other purposes. In June 2016, CH agreed to sell a residential property, with settlement in July 2016. CH received $435 000 from the sale of the property and allocated the proceeds for the CT scanner and additional accommodation for staff and students. CH continues to investigate which surplus assets may be sold to fund future operational and capital costs. Implications for the hospital Although the sale of surplus assets provided short-term funding for the hospital to resolve a particular need for equipment, there are a limited number of assets that a hospital can identify as surplus and liquidate. Other funding options will be required to enable any unexpected maintenance and asset replacement costs to be met. The lack of a vital piece of equipment can complicate the efficient and effective diagnosis and treatment of a patient, and in this case resulted in patients being unable to access local services and having to travel. The delay in DHHS announcing funding affected CH's ability to deliver its capital program. While the board took contingency actions as soon as possible, the delay in resulted in the board not being able to deliver their capital program as planned. |
Source: VAGO.
4.3.2 Donations
In 2015–16, the sector received $61.4 million in donations. Donations and fundraising activities are often used by public hospitals for health research, educational programs and as supplementary capital funding.
Figure 4E outlines the recent challenges faced by the Royal Children's Hospital (RCH) to fund new equipment that was not replaced when it moved into new premises in 2011. RCH received no significant extra capital funding between 2014−15 and 2015−16. It instead sought additional support from the Royal Children's Hospital Foundation (the foundation), to replace and upgrade equipment.
Figure 4E
Case study: Royal Children's Hospital
|
Background RCH is a paediatric hospital that provides care to patients from Victoria other states and overseas. It offers a full range of clinical and tertiary care, and health promotion and prevention programs. RCH is a nationally funded centre for cardiac transplantation, liver transplantation, lung transplantation with another public hospital, and hypoplastic left heart syndrome. In 2011, RCH moved to a new facility in Parkville. Fixed assets and funding replacement assets As at 30 June 2016, RCH had $1 181 million ($1 195 million in 2014–15) of property, plant and equipment. Of the property, plant and equipment balance at 30 June 2016, 86 per cent, or $1 018 million, were leased buildings, fittings, equipment and cultural assets—noting that the building and assets under the public–private partnership (PPP) arrangements are recorded in the RCH's accounts on behalf of the state. The PPP arrangement gives RCH access to $250 000 indexed funding per year for minor building works. This funding is capped at $10 000 per minor works and includes whole-of-life costs. As part of the move to a new facility, much of RCH's clinical and information and communications technology equipment has been transferred from the old premises and continues to be used. This has led to some assets being used beyond their economic life (assets worth $32 million as at 30 June 2016, or 19 per cent of non-leased assets) and increased maintenance costs to keep these assets operational. Issues affecting the replacement of assets RCH has applied to DHHS for capital funds to replace assets from the Central Capital and the Information Technology (IT) funding pools. In 2014–15 and 2015–16 it received no funding from the Central Capital pool. In 2015–16, RCH received $100 000 IT funding to replace a server supporting its pharmacy system. RCH has to fund capital changes to the current premises, including design, initial installation costs and ongoing operational costs, such as whole-of-life costs for the term of the PPP arrangement. Solutions to funding issues RCH receives donations from the foundation, which helps fund research, education, training and equipment for the hospital. In 2015–16, the foundation provided $45 million ($25 million in 2014–15) to RCH. The foundation does not fund operational equipment, which it expects DHHS to provide. The foundation has its own criteria and rules for deciding how to spend untied donations, noting that it honours all conditions that donors specify. Implications for the hospital Even though it is operating from new premises, RCH continues to face challenges providing modern, up-to-date care to patients when assets are used beyond their economic life. Continuing to rely on donation revenue is not sustainable. This type of funding is not consistent year-on-year and depends on the generosity of the public, and the allocation from an independent foundation. |
Source: VAGO.
4.3.3 External support
In some instances, public hospitals have sought to generate additional income streams to help replace assets. This has included income from subsidiaries that are generating surpluses and freeing up cash by seeking an interest-free loan from DHHS to fund operations.
In the case study in Figure 4F, we discuss the loan made to Alfred Health (AH) and the effect this loan will have on the hospital's ability to fund assets over the next four financial years as it is repaid and the revenue received by the hospital from its subsidiary Whole Time Medical Specialists Private Practice Trust (WT).
Figure 4F
Case study: Alfred Health
|
Background AH is a major tertiary referral hospital, servicing a population of over 680 000 in southern and bayside Melbourne from precincts in Prahran, Caulfield and Sandringham. In June 2014, AH received an interest free loan of $10 million from DHHS to fund cash commitments. This loan is to be repaid at $2.5 million a year starting in June 2017. Fixed assets As at 30 June 2016, AH reported $944 million ($936 million in 2014–15) of property, plant and equipment. Issues affecting the replacement of assets To repay the $10 million loan from DHHS, AH will need operating activities to generate positive cash flows. If AH is unable to generate enough cash from its operating activities, it will be less able to fund other capital works requirements. Solutions to funding issues Subsidiary
Non-core services
Management
Implications for the hospital The loan from DHHS will need to be serviced, which will limit the funds available for other asset replacement. AH will continue to rely on the alternate revenue streams from WT, private practice arrangements and medical treatment provided on behalf of other hospitals to make up any shortfall. This has risks because future revenue depends largely on external parties. |
Source: VAGO.
4.3.4 Future redevelopments
In 2015–16, the government allocated $1 million to planning for the redevelopment of Goulburn Valley Health (GVH).
As at 30 June 2016, GVH held $102 million in fixed assets, of which $15.3 million are operating past their economic lives, and GVH must provide short-term solutions to keep these assets operational, as described in Figure 4G. GVH is working with DHHS to ensure that funding for new assets is part of the redevelopment plan for their public hospital.
Figure 4G
Case study: Goulburn Valley Health
|
Background GVH is the major hospital of the Hume Region and services a population of 107 000 people. Services include emergency care, intensive care, community rehabilitation, aged care, mental health care and palliative care. The population of the region is projected to grow to 116 000 by 2021. GVH's buildings and facilities at the Shepparton site were built in the 1960s, and have been upgraded and modified through to the 2000s. Although the site's condition was rated adequate or above in the state's master plan, its compliance, functionality and efficiency was rated as poor to very poor, and its physical facilities deemed inadequate to provide the required clinical services. Fixed assets and funding replacement assets As at 30 June 2016, GVH had $102 million ($103 million in 2014–15) of property, plant and equipment. In 2015, $1 million from the State Budget was allocated for planning the GVH redevelopment and a masterplan was commissioned by DHHS in March 2015. In the 2016–2017 State Budget an allocation of $168.5 million was made for the GVH redevelopment, with an expected completion date of 2020. The whole hospital will be redeveloped, including an expanded emergency department, three new operating theatres and the refurbishment of existing wards. Issues affecting the replacement of assets GVH has $15.3 million of aged infrastructure and equipment fully depreciated at 30 June 2016. This has resulted in increasing maintenance costs to keep these assets operational and functioning. GVH needs to prioritise which assets to repair or replace. Although the redevelopment will not be completed until 2020, GVH must continue to deliver full services to the public. After the redevelopment, GVH will have to use aged equipment because the funding for the redevelopment will not be enough to replace all of the existing medical equipment.
Solutions to funding issues
Implications for the hospital Although the GVH redevelopment will help to replace aged infrastructure and equipment, it currently does not address the underlying issue of equipment being used beyond its economic life. GVH's operating leases might be a short-term solution—long-term leases remain an impost to GVH's available cash because the expenditure is fixed for several years to come. |
Source: VAGO.
Appendix A. Audit Act 1994 section 16—submissions and comments
We have consulted with all of the public hospitals and the Department of Health & Human Services (DHHS) throughout the course of our audits, and we considered their views when reaching our audit conclusions. As required by section 16(3) of the Audit Act 1994, we gave a draft copy of this report, or relevant extracts, to those agencies and asked for their submissions and comments.
Responsibility for the accuracy, fairness and balance of those comments rests solely with the agency head.
Responses were received as follows:
RESPONSE provided by the Secretary, Department of Health & Human Services
RESPONSE provided by the Chief Executive, Alfred Health
RESPONSE provided by the Chief Executive Officer, The Royal Children's Hospital Melbourne
Appendix B. Financial sustainability risk indicators
Figure B1 shows the indicators used in assessing the financial sustainability risks of public hospitals. These indicators should be considered collectively, and are more useful when assessed over time as part of a trend analysis.
Figure B1
Financial sustainability risk indicators
|
Indicator |
Formula |
Description |
|---|---|---|
|
Net result (%) |
Net result / Total revenue |
A positive result indicates a surplus, and the larger the percentage, the stronger the result. A negative result indicates a deficit. Operating deficits cannot be sustained in the long term. Net result and total revenue is obtained from the comprehensive operating statement. |
|
Liquidity (ratio) |
Current assets / Current liabilities |
This measures the ability to pay existing liabilities in the next 12 months. A ratio of one or more means there are more cash and liquid assets than short-term liabilities. |
|
Average number of days cash available (ratio) |
Unrestricted cash / (Total annual operating cash outflows / 365 days) |
This measures the number of days of operating expenses that a hospital could pay with its current available cash. Unrestricted cash available includes cash equivalents that can be easily converted to cash and excludes cash held where the use has been restricted—such as accommodation care bonds/deposits. |
|
Capital replacement (ratio) |
Cash outflows for property, plant and equipment / Depreciation |
Comparison of the rate of spending on infrastructure with its depreciation. Ratios higher than 1:1 indicate that spending is faster than the depreciating rate. This is a long-term indicator, as capital expenditure can be deferred in the short term if there are insufficient funds available from operations, and borrowing is not an option. Cash outflows for infrastructure are taken from the cash flow statement. Depreciation is taken from the comprehensive operating statement. |
Source: VAGO.
The analysis of financial sustainability risk in this report reflects on the position of each consolidated public hospital.
Financial sustainability risk assessment criteria
The financial sustainability risk of each public hospital has been assessed using the criteria outlined in Figure B2.
Figure B2
Financial sustainability risk indicators – risk assessment criteria
|
Risk |
Net result |
Liquidity |
Average number of cash days available |
Capital replacement |
|---|---|---|---|---|
|
High |
Less than negative 10% |
Less than 0.75 |
Less than 7 days |
Less than 1.0 |
|
Insufficient revenue is being generated to fund operations and asset renewal. |
Immediate sustainability issues with insufficient current assets to cover current liabilities. |
Insufficient cash held to fund operations. |
Spending on capital works has not kept pace with consumption of assets. |
|
|
Medium |
Negative 10%–0% |
0.75–1.0 |
7–30 days |
1.0–1.5 |
|
A risk of long‑term run down to cash reserves and inability to fund asset renewals. |
Need for caution with cash flow, as issues could arise with meeting obligations as they fall due. |
May indicate insufficient cash available to fund operations. |
May indicate spending on asset renewal is insufficient. |
|
|
Low |
More than 0% |
More than 1.0 |
More than 30 days |
More than 1.5 |
|
Generating surpluses consistently. |
No immediate issues with repaying short‑term liabilities as they fall due. |
Low risk of insufficient cash available to fund operations. |
Low risk of insufficient spending on asset renewal. |
Source: VAGO.
Metropolitan public hospitals
Figure B3
Net result, 2012 to 2016
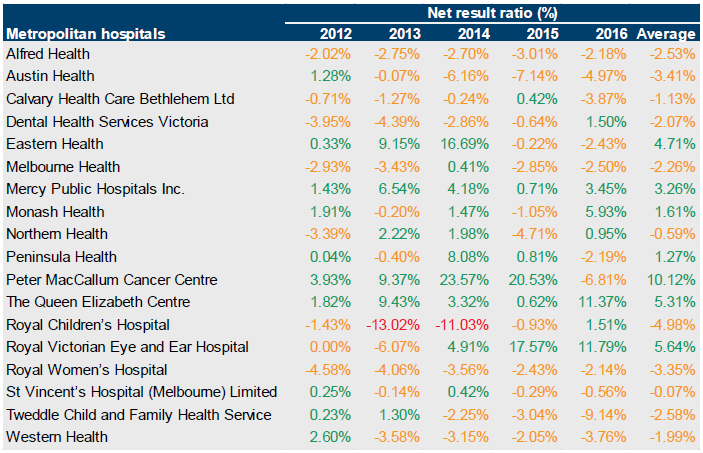
Source: VAGO.
Figure B4
Liquidity, 2012 to 2016
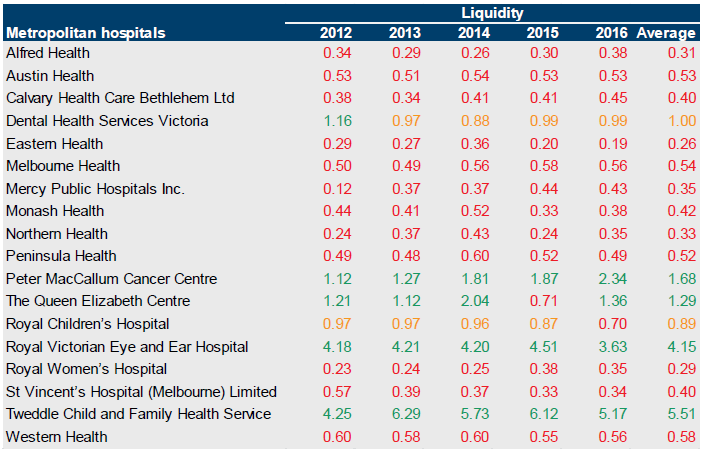
Source: VAGO.
Figure B5
Average number of days cash available, 2012 to 2016
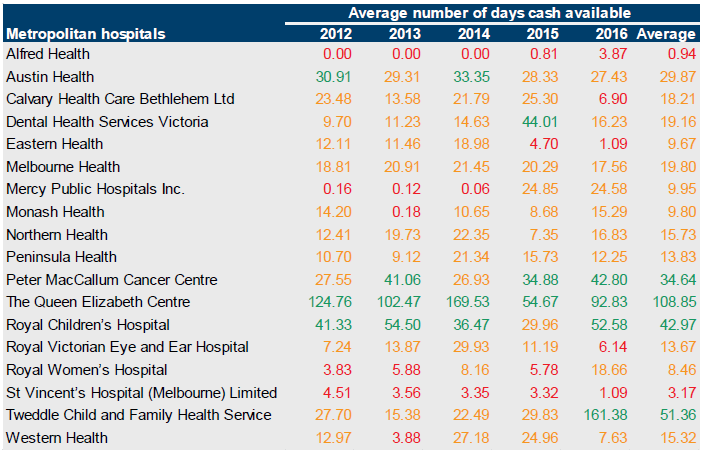
Source: VAGO.
Figure B6
Capital replacement, 2012 to 2016
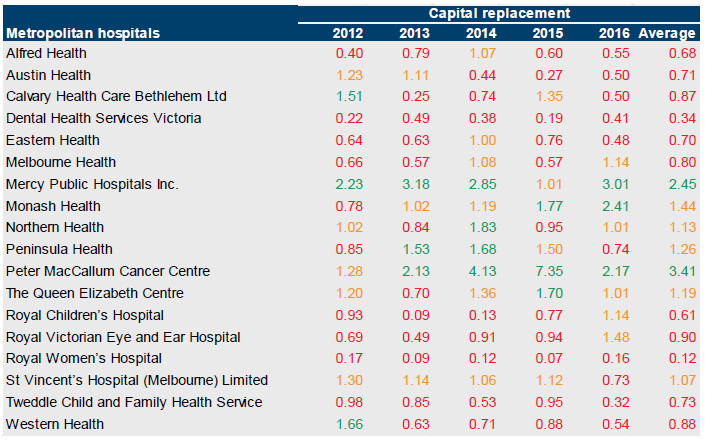
Source: VAGO.
Regional public hospitals
Figure B7
Net results, 2012 to 2016
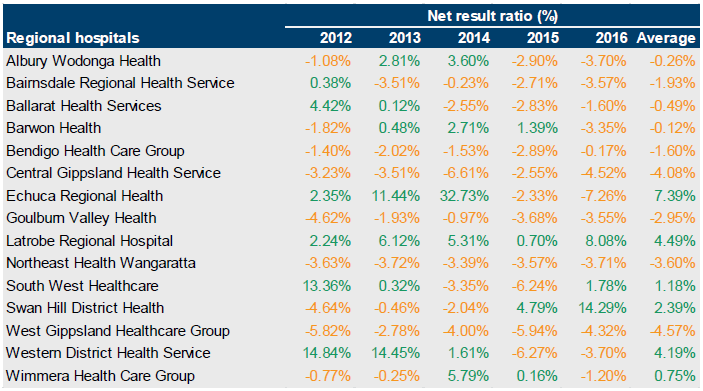
Source: VAGO.
Figure B8
Liquidity, 2012 to 2016
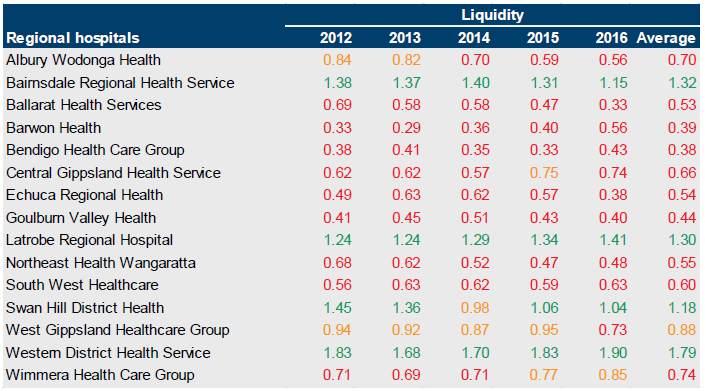
Source: VAGO.
Figure B9
Average number of days cash available, 2012 to 2016
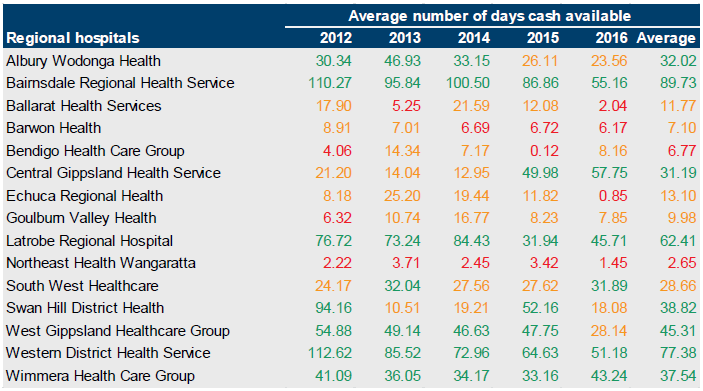
Source: VAGO.
Figure B10
Capital replacement, 2012 to 2016
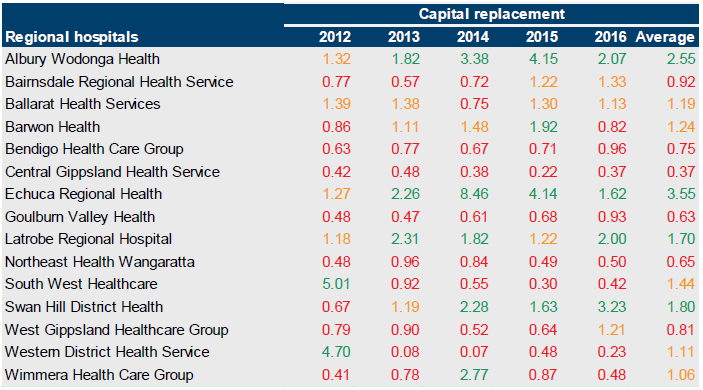
Source: VAGO.
Rural public hospitals
Figure B11
Net result, 2012 to 2016
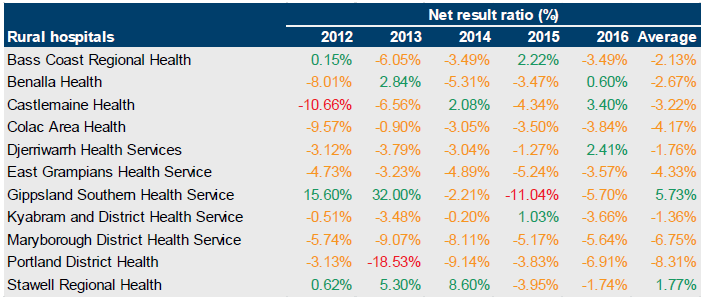
Source: VAGO.
Figure B12
Liquidity, 2012 to 2016
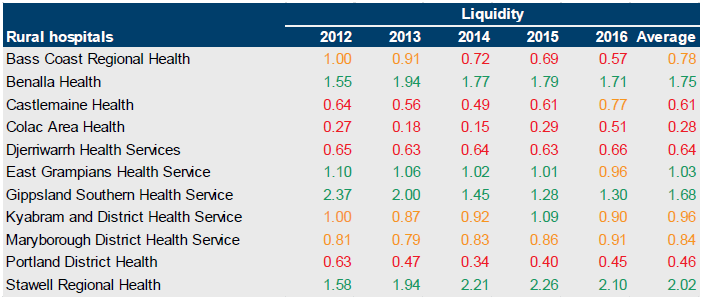
Source: VAGO.
Figure B13
Average number of days cash available, 2012 to 2016
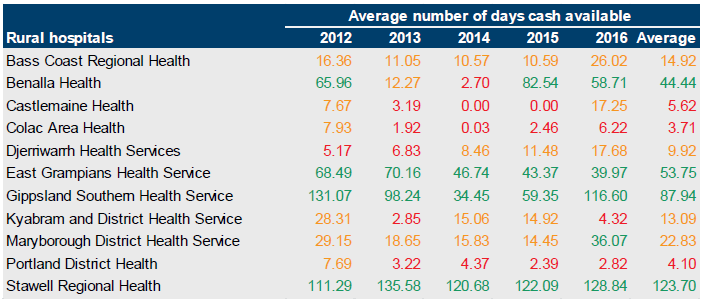
Source: VAGO.
Figure B14
Capital replacement
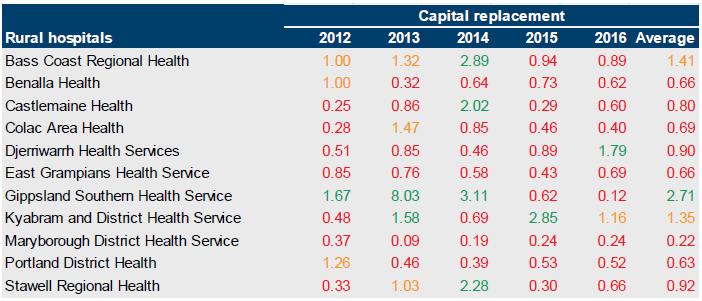
Source: VAGO.
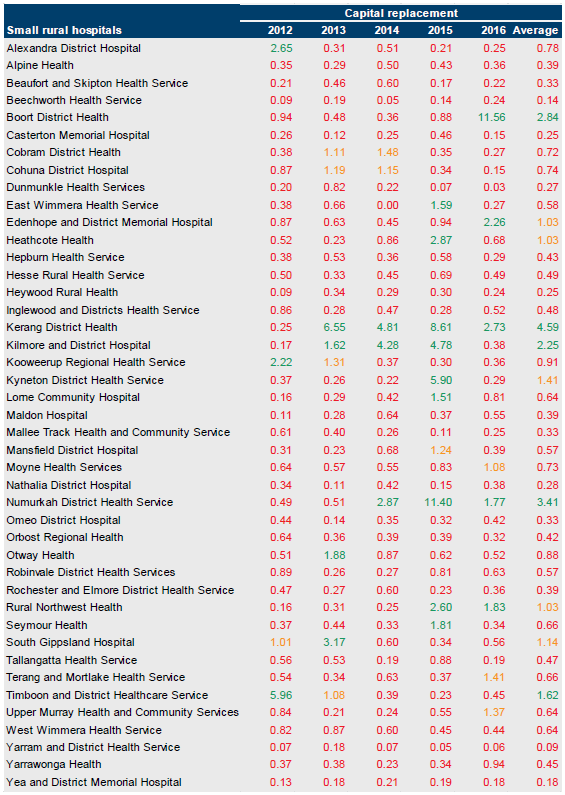
Small rural public hospitals
Figure B15
Net result, 2012 to 2016

Source: VAGO.
Figure B16
Liquidity, 2012 to 2016
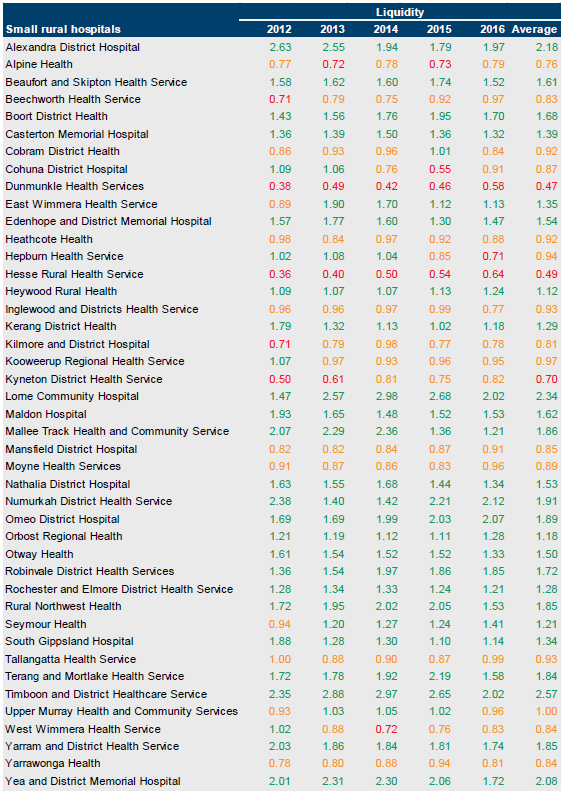
Source: VAGO.
Figure B17
Average number of days cash available, 2012 to 2016
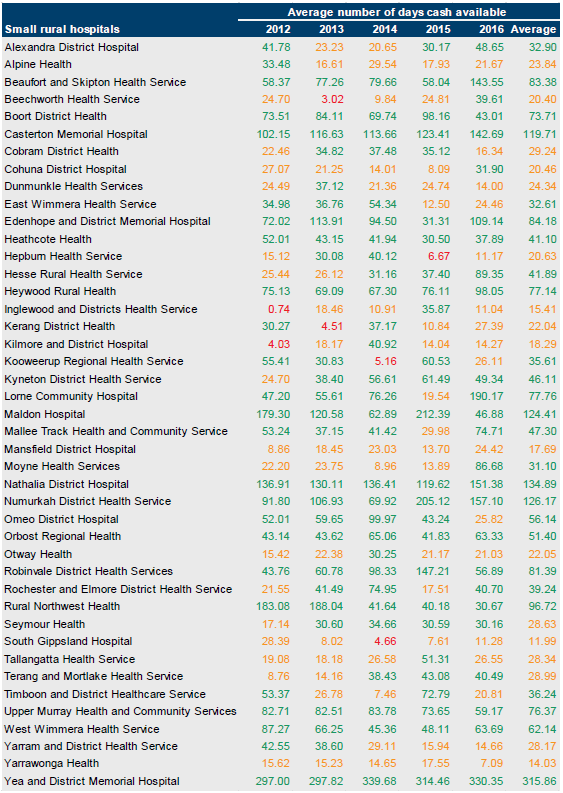
Source: VAGO.
Figure B18
Capital replacement, 2012 to 2016
Source: VAGO.
Appendix C. Control issues risk ratings
Figure C1 shows the risk ratings applied to issues raised in management letters, what it represents and the expected time taken to correct the issue.
Figure C1
Risk definitions applied to issues reported in audit management letters
Rating |
Definition |
Management action required |
|---|---|---|
Extreme |
The issue represents:
|
Requires immediate management intervention with a detailed action plan to be implemented within one month. Requires executive management to correct the material misstatement in the financial report as a matter of urgency to avoid a modified audit opinion. |
High |
The issue represents:
|
Requires prompt management intervention with a detailed action plan implemented within two months. Requires executive management to correct the material misstatement in the financial report to avoid a modified audit opinion. |
Medium |
The issue represents:
|
Requires management intervention with a detailed action plan implemented within three to six months. |
Low |
The issue represents:
|
Requires management intervention with a detailed action plan implemented within six to 12 months. |
Source: VAGO.
Appendix D. Glossary
Activity-based funding
Method of allocating funding based on unit prices for each activity undertaken and the volume of that activity an entity is to perform.
Adverse opinion
An audit opinion expressed if the auditor has sufficient appropriate audit evidence and concludes that misstatements, individually and in aggregate, are both material and pervasive in the financial report.
Aged care
Range of in-home, specialist geriatric, residential care and community-based programs and support services that are targeted at older people, people with a disability, and their carers.
Asset
An item or resource controlled by an entity that will be used to generate future economic benefits.
See also current asset, intangible asset, non-current asset and physical asset.
Audit Act 1994
Victorian legislation establishing the Auditor-General's operating powers and responsibilities and detailing the nature and scope of audits that the Auditor-General may carry out.
Audit opinion
A written expression, within a specified framework, indicating the auditor's overall conclusion about a financial (or performance) report based on audit evidence.
See also modified opinion and unmodified opinion.
Basic Asset Management Plan
Asset information required for asset management (identifying asset type, location, age, condition and risks, costs and planned replacement over a four-year horizon) that public hospitals compile. The information includes replacement requirements (and critical risk levels) of items that are in scope under the Securing Our Health System initiative.
Block funding
A system of funding public hospital functions and services based on population and previous funding.
Capital expenditure
Money an entity spends on:
- new physical assets, including buildings, infrastructure, plant and equipment
- renewing existing physical assets to extend the service potential or life of the asset.
Capital grant / capital purpose income
Government funding for an agency to acquire or build capital assets such as buildings, land or equipment.
Corporations Act 2001
Commonwealth legislation governing corporations, including their financial reporting framework.
Current [S.P.1] asset
An asset that will be sold or realised within 12 months of the end of the financial year being reported on, such as term deposits maturing in three months or stock items available for sale.
Current liability
A liability that will be settled within 12 months of the end of the financial year being reported on, such as payment of a creditor for services provided to the entity.
Depreciation
Systematic allocation of the value of an asset over its expected useful life, recorded as an expense.
Disclaimer of opinion
Conclusion expressed if the auditor is unable to obtain sufficient appropriate audit evidence on which to base an audit opinion, and the auditor concludes that the possible effects on the financial (or performance) report of undetected misstatements, if any, could be both material and pervasive.
Emphasis of matter
A paragraph included in an audit opinion that refers to a matter appropriately presented or disclosed in the financial report that, in the auditor's judgement, is of such importance that it is fundamental to users' understanding of the financial report.
Expense
The outflow of assets or the depletion of assets an entity controls during the financial year, including expenditure and the depreciation of physical assets. An expense can also be the incurrence of liabilities during the financial year, such as increases to a provision.
Financial Management Act 1994
Victorian legislation governing public sector entities, as determined by the Minister for Finance, including their financial reporting framework.
Financial report
A document reporting the financial outcome and position of an entity for a financial year, which contains an entity's financial statements, including a comprehensive income statement, a balance sheet, a cash flow statement, a comprehensive statement of equity and notes.
Financial Reporting Direction
Issued by the Minister for Finance for entities reporting under the Financial Management Act 1994, with the aim of:
- achieving consistency and improved disclosure in financial reporting for Victorian public entities by eliminating or reducing divergence in accounting practices
- prescribing the accounting treatment and disclosure of financial transactions in circumstances where there are choices in accounting treatment, or where existing accounting procurements have no guidance or requirements.
Financial sustainability
An entity's ability to manage financial resources so it can meet its current and future spending commitments, while maintaining assets in the condition required to provide services.
Financial year
A period of 12 months for which a financial report is prepared, which may be a different period to the calendar year.
Going concern
An entity that is expected to be able to pay its debts when they fall due, and continue in operation without any intention or necessity to liquidate or otherwise wind up its operations.
Governance
The control arrangements used to govern and monitor an entity's activities to achieve its strategic and operational goals.
Home and community care
A program that provides a range of basic maintenance and home support services so people can live independently at home for longer.
Impairment (loss)
The amount by which the value of an entity's asset exceeds its recoverable value.
Income
The inflow of assets or decrease of liabilities during the financial year, including receipt of cash and the reduction of a provision.
Intangible asset
An identifiable non-financial asset, controlled by an entity, that cannot be physically seen, such as software licences or a patent.
Internal audit
A function of an entity's governance framework that examines and reports to management on the effectiveness of the entity's risk management, internal control and governance processes.
Internal control
A method of directing, monitoring and measuring an entity's resources and processes to prevent and detect error and fraud.
Issues
Weaknesses or other concerns in the governance structure of an entity identified during a financial audit, which are reported to the entity in a management letter.
Letter of comfort
Assurance that the Department of Health & Human Services will provide financial support to a public hospital for at least the next 12 months for it to continue operating.
Liability
A present obligation of the entity arising from past events, the settlement of which is expected to result in an outflow of assets from the entity.
See also current liability and non-current liability.
Machinery-of-government changes
Changes made to the administrative structure of government.
Management letter
A letter the auditor writes to the governing body, the audit committee and management of an entity outlining issues identified during the financial audit.
Materiality
Information is material if its omission, misstatement or non-disclosure has the potential to affect the economic decisions of users of the financial report, or the discharge of accountability by management or those charged with governance. The size, value and nature of the information and the circumstances of its omission or misstatement help in deciding how material it is.
Mental Health Services (Mental Health)
All specialised mental health services providing a range of inpatient, community based residential, rehabilitation and ambulatory services that treat and support people with a mental illness and their families and carers.
Modified opinion
The auditor's expressed qualified opinion, adverse opinion or disclaimer of opinion.
Net result
The value that an entity has earned or lost over the stated period (usually a financial year), calculated by subtracting an entity's total expenses from the total revenue for that period.
Non admitted care
Medical procedures, such as day surgery, on a patient who is not admitted to hospital.
Non-current asset
An asset that will be sold or realised later than 12 months after the end of the financial year being reported on, such as investments with a maturity date of two years or physical assets the entity holds for long-term use.
Non-current liability
A liability that will be settled later than 12 months after the end of the financial year being reported on, such as repayments on a five-year loan that are not due in the next 12 months.
Other comprehensive income
Revenues, expenses, gains and losses under Australian Accounting Standards that are excluded from net income on the income statement and are instead listed after net income.
Physical asset
A non-financial asset that is a tangible item an entity controls, and that will be used by the entity for more than 12 months to generate profit or provide services, such as building, equipment or land.
Primary health
A range of home-based, community-based health services, such as health promotion and counselling, physiotherapy, speech therapy, podiatry and occupational therapy, and a range of dental health services.
Qualified audit opinion
An opinion issued when the auditor concludes that an unqualified opinion cannot be expressed because of:
- disagreement with those charged with governance or
- conflict between applicable financial reporting frameworks or
- limitation of scope.
A qualified opinion is considered to be unqualified except for the effects of the matter to which the qualification relates.
Residential Aged Care including Mental Health
Psychogeriatric residential services comprising those Commonwealth-licensed residential aged care services that receive supplementary funding from the department under the mental health program.
Restricted cash
Cash that cannot be used for hospital operations and includes patients' money held in trust, aged-care accommodation bonds and restricted capital funds and donations.
Revaluation
The restatement of a value of non-current assets at a particular point in time.
Risk
The chance of a negative or positive impact on the objectives, outputs or outcomes of an entity.
Risk register
A tool an entity uses to help identify, monitor and mitigate risks. The register may appear in the form of a plot graph or a table.
Specific purpose funds / specific purpose grants
Grant funding provided by the Commonwealth to the state government for a particular area or service.
Statement of Priorities
Key accountability agreements between public health services and the Minister for Health. These help to deliver or make substantial progress towards key shared objectives of financial viability, improved access and quality of service provision, and include funding and targets confirmed at the time of signing.
Sub-acute admitted care
Specialised multidisciplinary care whose main objective is to provide the best quality of life for the patient.
Tertiary referral hospital
A hospital that provides tertiary care—health care from specialists in a large hospital after referral from primary care and secondary care.
Unmodified opinion
The audit opinion that the auditor expresses when concluding that the financial (or performance) report is prepared, in all material respects, in keeping with the applicable reporting framework.
Whole-of-life cost
The cost to buy or construct an asset, plus the cost of maintaining the asset over its life.