Public Hospitals: Results of the 2010–11 Audits
Overview
This report covers the results of the financial audits of 112 entities within the public hospital sector, comprising 87 public hospitals and the 25 entities they control. It informs Parliament about significant issues arising from the audits and augments the assurance provided through audit opinions included in the entities’ annual reports.
The report recommends that public hospitals assess their policies and procedures against the commonly identified control weaknesses, and that comprehensive policies and procedures over procurement, tendering and information technology system security be developed and regularly reviewed.
Public Hospitals: Results of the 2010–11 Audits: Message
Ordered to be printed
VICTORIAN GOVERNMENT PRINTER November 2011
PP No 84, Session 2011–12
President
Legislative Council
Parliament House
Melbourne
Speaker
Legislative Assembly
Parliament House
Melbourne
Dear Presiding Officers
Under the provisions of section 16AB of the Audit Act 1994, I transmit my report on Public Hospitals: Results of the 2010–11 Audits.
Yours faithfully
![]()
D D R PEARSON
Auditor-General
9 November 2011
Audit summary
Background
This report covers the results of our financial audits of 112 entities within the public hospital sector, comprising 87 public hospitals and the 25 entities they control. It informs Parliament about significant issues arising from the audits and augments the assurance provided through audit opinions included in the entities’ annual reports.
This report comments on the quality and timeliness of financial reporting, the financial sustainability of public hospitals and the effectiveness of procurement practices and information technology security.
Conclusion
Clear audit opinions were issued on all completed public hospital and associated entities’ financial statements for the financial year ended 30 June 2011.
The operating result for hospitals improved significantly from a deficit of $156 million in 2009–10 to a deficit of $102 million in 2010–11, mainly due to additional capital grants provided to regional hospitals during the year.
The overall risk to financial sustainability for each public hospital category was assessed as moderate for 2010–11. However, the risk was assessed as high for 33 per cent of public hospitals (29 of 87) mainly because they generated insufficient cash to adequately fund their operations. It is concerning that 61 per cent of public hospitals, including 25 major metropolitan and regional hospitals, had cash holdings equivalent to less than 30 days operating cash outflows. Some hospitals had cash holdings of less than seven days
Twenty-nine public hospitals did not meet the going concern test of the Australian Accounting Standards at 30 June 2011. The 29 relied upon a letter of comfort from the Department of Health that stated it would provide adequate cash flows to enable them to meet their financial obligations if required.
The above data demonstrates that while public hospitals have their own boards of management that are responsible for the day-to-day oversight of the entities, the financial sustainability of hospitals is significantly affected by funding decisions made by the department. The current departmental funding model limits the ability of governing bodies and management to make decisions around asset maintenance and replacement. The funding arrangements have implications for governing boards of public hospitals and their ability to fulfil their legislative responsibilities.
Findings
Audit opinions and the quality of reporting
Clear audit opinions were issued on 111 entities, comprising the 87 public hospitals and 24 of the entities they controlled. The audit of one of the controlled entities was still to be finalised. The financial reports were prepared in accordance with the applicable reporting framework. This continued the positive result from 2009–10 when no modified audit opinions were issued.
Quality of reporting
Overall, the financial report preparation processes of public hospitals and their controlled entities were adequate and produced accurate, complete and reliable information, but there are opportunities for improvement in:
- establishing financial report preparation plans outlining the processes, resources, milestones and quality assurance practices required
- preparing and providing timely shell financial statements to enable issues to be identified and resolved earlier
- preparing materiality assessments to identify potential errors in the financial statements
- undertaking periodic compliance reviews to identify non-compliance or changes to legislation that impact the financial report.
The average time taken by public hospitals and their controlled entities to finalise their financial statements increased from 7.9 weeks in 2009–10 to 8 weeks in 2010–11. Although a slight increase, this result maintained the significant improvement on 2008–09 when it took an average of 10 weeks to finalise financial statements.
Financial sustainability
To be financially sustainable, public hospitals need to be able to meet current and future expenditure as it falls due. They must also be able to absorb foreseeable changes and financial risks as they materialise.
The five financial sustainability indicators, analysed for the five years from 2006–07 to 2010–11 were:
- the underlying result
- liquidity
- average days cash available
- self-financing
- capital replacement.
The results of our analysis of the 87 public hospitals, at the hospital category level, are summarised in Figure A.
Figure
A
Financial sustainability risk assessment by hospital category
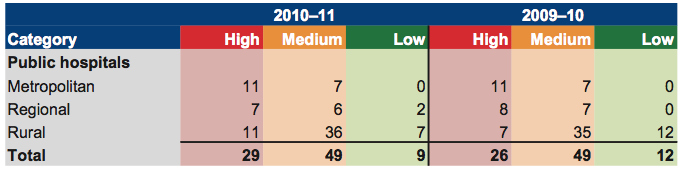
Source: Victorian Auditor-General's Office.
An analysis of five financial sustainability indicators over a five-year trend period found that the public hospital sector, on average, has an overall medium-risk financial sustainability assessment consistent with 2009–10. The trends showed a slightly improved capacity for hospitals to meet their short-term commitments. However, they are under continuing pressure to meet their long-term commitments from the proceeds of their own operations, particularly to maintain and replace their assets as and when necessary.
The overall risk to the financial sustainability for public hospitals is medium. However:
- Twenty-nine public hospitals were considered high risk at 30 June 2011 (26in2009–10), most commonly because they were assessed as generating insufficient cash to adequately fund their operations
- 61 per cent of hospitals, including 25 major metropolitan and regional hospitals, had cash holdings equivalent to less than 30 days operating cash outflows. This included 24 hospitals with less than seven days operating cash flows (17 in 2009–10), nine of which were metropolitan hospitals.
Individual public hospital boards and the department share responsibility for financial performance and management within the sector. During 2011, the department concluded that 29 public hospitals (30 in 2010) did not technically meet the going concern test in the Australian Accounting Standards. This was consistent with our analysis. Consequently, the department provided the boards of those hospitals with a letter of comfort stating that it would provide adequate cash flows to enable them to meet their current and future obligations up to September 2012, should this be required.
Over and above the analysis of financial sustainability indicators, trends and risks, the ability of management and the governing body to make decisions necessary to affect an entity’s operations needs to be considered in assessing an entity’s performance. For public hospitals, despite the application of sector neutral Australian Accounting Standards and accrual accounting, the funding model does not progressively fund entities for the depreciation of their assets.
The funding model allocates capital grants strategically across the sector rather than progressively to each entity. Funds for replacing assets are not provided until the government considers replacement is appropriate given its strategic review of the sector’s needs and other spending priorities. Nevertheless, legislatively the governing board of each hospital is required to be accountable for the entity’s financial management and performance.
Our analysis showed that funding arrangements have a direct and significant impact on the financial sustainability of public hospitals. The funding model limits the ability of governing bodies and management to make decisions around asset maintenance and replacement, and some major hospitals consistently experience cash shortages. This has implications for the governing boards of public hospitals and their ability to fulfil their legislative responsibilities.
Common internal control weaknesses
General internal controls
Public hospital internal control structures were adequate for financial reporting purposes, although the strength of these systems varied between public hospitals. We identified instances where important internal control mechanisms commonly needed to be strengthened.
The following internal control mechanisms require strengthening at public hospitals:
- 30 per cent of public hospitals were not independently reviewing masterfile standing data changes
- 24 per cent had deficiencies in preparing and reviewing key account reconciliations
- 26 per cent needed to improve their management reporting and governance
- 22 per cent had control weaknesses over the acquisition, maintenance and monitoring of assets
- 22 per cent had control weaknesses relating to payroll authorisation and management
- 17 per cent had control weaknesses over the authorisation of supplier payments.
These matters, together with other audit findings and recommendations, were reported to the relevant hospital boards and their management teams.
Controls over procurement
For the financial year ended 30 June 2011, public hospitals procured goods and services in excess of $1.6 billion. This was an increase of $74 million from the previous year.
Given the financial significance of public hospital expenditure on supplies and services, and the importance of hospitals achieving value-for-money using taxpayer funds, we reviewed controls and processes for purchasing, in particular those for procurement, tendering and related governance.
The larger metropolitan and regional hospitals generally had more comprehensive policies and internal controls in place compared to rural hospitals, which was pleasing given the relative proportion of expenditure they incur. However, there are opportunities for improvement across the sector, particularly relating to procurement reporting requirements and benchmarking procurement outcomes. The following was noted:
- 58 per cent of public hospitals did not specify reporting requirements or frequency in their procurement policies
- 55 per cent had not developed a clear definition of high-risk, high-value or complex procurement
- 91 per cent did not benchmark their procurement outcomes and costs against external standards
- 46 per cent were unable to demonstrate that procurement policies, practices and processes had been reviewed since 30 June 2009
- 53 per cent had not commissioned internal audits of their procurement activities or practices
- 37 per cent had not included risks associated with procurement in their risk management register.
Controls over information technology security
Given the highly sensitive nature of information held by public hospitals in relation to patients, as well as the financial and operational aspects of the business, effective security over information systems is critical. To protect information from theft or manipulation, hospitals should have appropriate controls over their information technology systems.
Information technology (IT) system security at public hospitals was generally adequate for protecting and restricting access to sensitive data. The following positive aspects were noted:
- 84 per cent of public hospitals had a documented IT security policy or were in the process of developing one
- 85 per cent of the policies had been reviewed and updated at least once in the past three years
- 68 per cent of public hospitals, including all major metropolitan and regional hospitals, trained staff in IT security policies and procedures
- 92 per cent had established adequate controls and processes to manage changes to IT systems
- 92 per cent had adequate IT risk management policies
- 100 per cent had adequate backup and recovery procedures.
Despite the positive results there are opportunities for improvement at most public hospitals. The opportunities particularly relate to developing information security classification policies for sensitive data, establishing an IT steering committee and monitoring compliance with policies and procedures. Specifically:
- 88 per cent had not developed an information security classification policy to protect sensitive data
- 55 per cent had not incorporated an IT steering committee into their governance structure
- 74 per cent had not performed an internal audit of their IT security in the past threeyears
- 61 per cent had not established arrangements to monitor compliance with policies and procedures
- 33 per cent did not provide their boards with updates on the status of IT systems and security arrangements.
Recommendations
That public hospitals:
- further refine their financial reporting processes by establishing financial report preparation plans, preparing timely shell financial statements and materiality assessments and performing periodic financial compliance reviews
- assess their policies and practices against the identified general internal control weaknesses to determine the adequacy of their controls, and whether they are operating reliably, efficiently and effectively
- develop comprehensive policies and procedures for procurement and tendering which are appropriately approved and subject to regular review
- develop comprehensive policies and procedures over information technology system security which are approved at board level and subject to regular review
- develop an information security classification policy that outlines criteria for assigning security classifications to information and the required security controls for each classification
- undertake periodic assessments of the adequacy of, and compliance with, information technology security requirements.
Submissions and comments received
In addition to progressive engagement during the course of the audit, in accordance with section 16(3) of the Audit Act 1994 a copy of this report, or relevant extracts from the report, was provided to the Department of Health with a request for comments or submissions.
Agency views have been considered in reaching our audit conclusions and are represented to the extent relevant and warranted in preparing this report. Their full section 16(3) comments and submissions, however, are included in Appendix D.
1 Background
1.1 Introduction
Public hospitals provide complex acute care, prevention, early intervention and primary care, aged care and mental health services.
While metropolitan and regional public hospitals largely provide acute health services, they also provide a mix of mental health, sub-acute, community health services and aged care programs. Rural public hospitals generally offer a higher proportion of aged care and community health services.
This report includes the results of our audit of 87 public hospitals and 25 associated entities, as set out in Figure 1A.
Figure
1A
Public hospitals and controlled entities
Hospital category |
2010 |
2011 |
|---|---|---|
Metropolitan |
||
Public hospitals |
18 |
18 |
Entities controlled by public hospitals |
14 |
14 |
Other associated entities |
2 |
2 |
Regional |
||
Public hospitals |
15 |
15 |
Entities controlled by public hospitals |
2 |
2 |
Rural |
|
|
Public hospitals |
54 |
54 |
Entities controlled by public hospitals |
6 |
6 |
Other associated entities |
1 |
1 |
Total |
112 |
112 |
Note: Entities controlled by public hospitals generally comprise foundations and trusts.
Source: Victorian Auditor-General's Office.
Figure 1A shows that there have been no changes to the entities that were subject to our 2010–11 audits.
This report informs Parliament about significant issues arising from the financial audits within the public hospital sector, and augments the assurance provided through audit opinions on financial statements that are included in the respective entities' annual reports.
The report comments on the quality and timeliness of financial reporting in the sector, the financial sustainability of public hospitals, and the effectiveness of procurement practices and information technology security.
This report is the second of six reports to be presented to Parliament covering the results of our audits of public sector financial reports. The reports in this series are outlined in Figure 1B.
Figure
1B
VAGO reports on the results of the 2010–11 financial audits
Report |
Description |
|---|---|
Auditor-General's Report on the Annual Financial Report of the State of Victoria, 2010–11 |
Reports on the results of the audit of the state's annual financial report and addresses the quality and timeliness of financial reporting, explanation of significant financial results for the state and observations on the status and financial implications of significant projects and developments that occurred during 2010–11 and subsequent to year end. Tabled in Parliament on 9 November 2011. |
Public Hospitals: Results of the 2010–11 Audits |
This report provides the results of the audits of approximately 110 entities, addressing the timeliness of their financial reporting, their financial sustainability, and aspects of how they manage procurement and information technology security. Tabled in Parliament on 9 November 2011. |
Water Entities: Results of the 2010–11 Audits |
The report will provide the results of the audits of 20 water entities addressing the timeliness of their financial and performance reporting, their financial sustainability and aspects of how they manage declarations of interests, asset valuations and outsourcing. Proposed to be tabled in Parliament in November 2011 |
Portfolio Departments and Associated Entities: Results of the 2010–11 Audits |
The report will provide the results of the annual financial statement audits of approximately 210 entities. The report will include comment on the timeliness of their financial reporting, financial sustainability and aspects of how they manage grants administration, employee leave, information technology change, and information technology security. Proposed to be tabled in Parliament in November 2011 |
Local Government: Results of the 2010–11 Audits |
The report will provide the results of the audits of approximately 100 entities in the local government sector. It will address the timeliness of their financial and performance reporting, their financial sustainability, their utilisation of internal audit and aspects of how they manage assets and procurement. Proposed to be tabled in Parliament in November 2011 |
Tertiary Education and Other Entities: Results of the 2011 Audits |
The report will provide the results of the annual financial audits of approximately 120 entities with a financial year end other than 30 June 2011 It will address the timeliness of their financial and performance reporting, their financial sustainability and aspects of how they manage capital projects, information technology security, and international student fee revenue. Proposed to be tabled in Parliament in May 2012 |
Source: Victorian Auditor-General's Office.
1.2 Financial audit framework
1.2.1 Audit of financial reports
An annual financial audit has two aims:
- to give an opinion consistent with section 9 of the Audit Act 1994, on whether financial reports are fairly stated
- to consider whether there has been wastage of public resources or a lack of probity or financial prudence in the management or application of public resources, consistent with section 3A(2) of the Audit Act 1994.
The financial audit framework applied in the conduct of the 2011 audits of public hospitals is set out in Figure 1C.
Figure
1C
Financial audit framework
Planning
Planning is not a discrete phase of a financial audit, rather it continues throughout the engagement. However, initial audit planning is conducted at two levels:
- At a high or entity level, planning involves obtaining an understanding of the entity and its environment, including its internal controls. The auditor identifies and assesses: the key risks facing the entity; the entity’s risk mitigation strategies; any significant recent developments; and the entity’s governance and management control framework.
- At a low or financial reports line item level, planning involves the identification, documentation and initial assessment of processes and controls over management, accounting and information technology systems.
The output from the initial audit planning process is a detailed audit plan and a client strategy document, which outlines the proposed approach to the audit. This strategy document is issued to the client after initial audit planning and includes an estimate of the audit fee.
Conduct
The conduct phase involves the performance of audit procedures aimed at testing whether or not financial statement balances and transactions are free of material error. There are two types of tests undertaken during this phase:
- Tests of controls, which determine whether controls identified during planning were effective throughout the period of the audit and can be relied upon to reduce the risk of material error.
- Substantive tests, which involve: detailed examination of balances and underlying transactions; assessment of the reasonableness of balances using analytical procedures; and a review of the presentation and disclosure in the financial reports, for compliance with the applicable reporting framework.
The output from this phase is a final (and possibly an interim) management letter which details significant findings along with value-adding recommendations on improving controls and processes. These documents are issued to the client after any interim audit work and during the reporting phase.
Reporting
The reporting phase involves the formal presentation and discussion of audit findings with the client management, and/or the audit committee. The key outputs from this process are:
- A signed audit opinion, which is presented in the client’s annual report alongside the certified financial reports.
- A report to Parliament on significant issues arising from audits either for the individual entity or for the sector as a whole.
Source: Victorian Auditor-General's Office.
1.2.2 Audit of internal controls
An entity's governing body is responsible for developing and maintaining its internal control framework. Internal controls are systems, policies and procedures that help an entity to reliably and cost effectively meet its objectives. Sound internal controls enable the delivery of reliable, accurate and timely external and internal reporting.
Figure 1D identifies the main components of an effective internal control framework.
Figure
1D
Components of an internal control framework
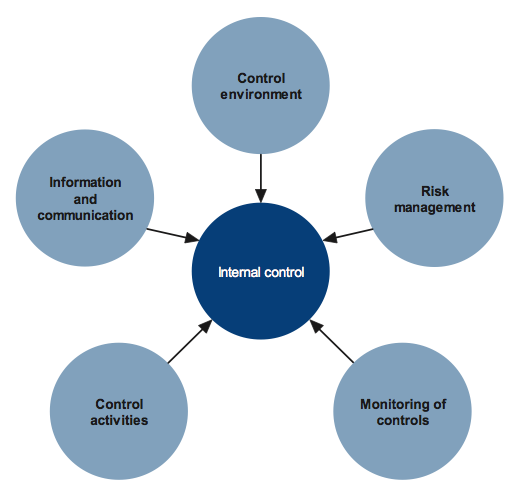
Source: Victorian Auditor-General's Office.
In the diagram:
- the control environment provides the fundamental discipline and structure for the controls and includes governance and management functions and the attitudes awareness, and actions of those charged with governance and management of an entity
- risk management involves identifying, analysing and mitigating risks
- monitoring of controls involves observing the internal controls in practice and assessing their effectiveness
- control activities are policies, procedures and practices prescribed by management to help meet an entity's objectives
- information and communication involves communicating control responsibilities throughout the entity and providing information in a form and time frame that allows officers to discharge their responsibilities.
The annual financial audit enables the Auditor-General to form an opinion on an entity's financial report. An integral part of this, and a requirement of Australian Auditing Standard 315 Understanding the Entity and its Environment and Assessing the Risk of Material Misstatement, is to assess the adequacy of an entity's internal control framework and governance processes related to its financial reporting.
Internal control weaknesses we identify during an audit do not usually result in a 'qualified' audit opinion. A qualification is usually warranted only if weaknesses cause significant uncertainty about the accuracy, completeness and reliability of the financial information being reported. Often, an entity will have compensating controls that mitigate the risk of a material error in the financial report.
Weaknesses we find during an audit are brought to the attention of an entity's chairperson, chief executive officer and audit committee by way of a management letter.
Section 16 of the Audit Act 1994 empowers the Auditor-General to report to Parliament on the results of audits. This report includes the results of our review of internal controls related to the financial reporting responsibilities of the public hospital sector.
1.3 Audit conduct
The audits were undertaken in accordance with the Australian Auditing Standards.
The total cost of preparing and printing this report was $205 000.
1.4 Structure of this report
The details in relation to public hospital sector activities covered within each Part of this report are as set out in Figure 1E.
Figure 1E
Report structure – sector entities
Part |
Description |
|---|---|
Part 2: Audit opinions and quality of reporting |
Covers the results of the audits of the 2010–11 financial reports of 87 public hospitals and 25 associated entities. It comments on the timeliness and accuracy of financial reporting and compares practices in 2010–11 against better practice and past performance. |
Part 3: Financial results |
Illustrates the financial results of 87 public hospitals, including financial performance for 2010–11 and financial position at 30 June 2011. |
Part 4: Financial sustainability |
Provides insight into the financial sustainability of 87 public hospitals obtained from analysing the trends in five financial sustainability indicators over a five-year period. |
Part 5: Internal controls |
Assesses internal controls at 87 public hospitals and summarises the control weaknesses commonly identified for the year ended 30 June 2011. It also comments on procurement and information technology security controls across the public hospital sector. |
Source: Victorian Auditor-General's Office.
2 Audit opinions and quality of reporting
At a glance
Background
This Part covers the results of the audits of the 2010–11 financial reports of 87 public hospitals and 25 associated entities.
Independent audit opinions add credibility to financial reports by providing reasonable assurance that the information reported is reliable.
The timeliness and accuracy of the preparation of an entity's financial report is integral to the quality of financial reporting. This chapter compares financial reporting practices in 2010–11 against better practice and time lines, and with 2009–10 performance.
Conclusion
Parliament can have confidence in the financial reports as all completed audits received clear audit opinions.
Overall, the financial report preparation processes of public hospitals and their controlled entities are adequate. They produced accurate, complete and reliable information; however there remain opportunities for further improvement.
Findings
- At 31 October 2011 clear audit opinions had been issued on 111 public hospitals and controlled entities' financial reports for the financial year ended 30June2011.
- Compared with 2010, the overall timeliness of financial reporting in 2011 decreased slightly, nevertheless 100 per cent of public hospitals were finalised within twelve weeks.
- Financial reporting quality would improve if entities prepared shell financial statements early to identify issues to be resolved, performed financial compliance reviews, developed a financial report preparation plan and prepared materiality assessments.
Recommendation
- That public hospitals further refine their financial reporting processes by establishing financial report preparation plans, preparing timely shell financial statements and materiality assessments and performing periodic financial compliance reviews.
2.1 Reporting framework
2.1.1 Financial reporting
This Part covers the results from the audits of 112 public hospitals and associated entities for the 2010–11 reporting period.
Each of the audited entities must prepare its financial report in accordance with Australian Accounting Standards, including the Australian Accounting Interpretations.
The principal legislation governing financial reporting by public hospitals is the Financial Management Act 1994 (FMA) and the Corporations Act 2001. Figure 2A shows the legislative framework applying to each entity.
Figure
2A
Legislative framework for public hospitals and associated entities
Legislative framework |
Public hospitals |
Entities controlled by public hospitals |
Other associated entities |
Total |
|---|---|---|---|---|
Financial Management Act 1994 |
84 |
4 |
– |
88 |
Corporations Act 2001 |
3 |
15 |
– |
18 |
Associations Incorporation Act 1981 |
– |
1 |
– |
1 |
No applicable legislative framework |
– |
2 |
3 |
5 |
Total |
87 |
22 |
3 |
112 |
Source: Victorian Auditor-General's Office.
Appendix B details the legislative framework applying to each public hospital sector entity.
The FMA requires an entity to submit its annual report to its minister. The report should include financial reports for the entity and any controlled entities and are to be prepared and audited within 12 weeks of the end of the financial year. The annual report should be tabled in Parliament within four months of the end of the financial year.
The Corporations Act 2001 requires a company to report to their members within four months after the end of their financial year. However, the need to consolidate the results of controlled entities into their parent entity's financial report means that controlled entities reporting under the Corporations Act 2001 are, in effect, also required to report within 12 weeks of the end of the financial year.
Figure 2B summarises the legislated reporting time frames.
Figure
2B
Legislative reporting time frames
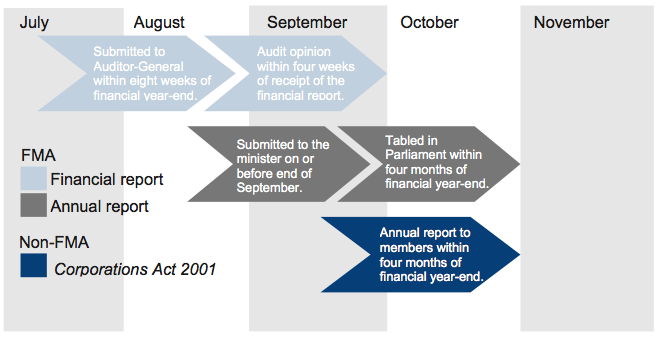
Source: Victorian Auditor-General's Office.
The Auditor-General's report, Acquittal Report: Results of the 2009–10 Audits, recommended that entities should adopt the shortened annual reporting time frames achieved for the 2009–10 reporting cycle as the standard for future reporting cycles. Premier's Circular No. 2011/12 issued on 18 May 2011 requests ministers, departments and public bodies to table annual reports between 30 August and 15 September 2011, or earlier if available. This is consistent with the 2009–10 reporting time frame.
2.2 Audit opinions issued
At 31 October 2011, clear audit opinions had been issued on 111 public hospital and controlled entities' financial statements for the financial year ended 30 June 2011. The audit of one of the controlled entities was still to be finalised.
Independent audit opinions add credibility to financial reports by providing reasonable assurance that the information is reliable. A clear audit opinion confirms that the financial report has been prepared according to the requirements of relevant accounting standards and legislation. If the report has not been prepared in accordance with the relevant reporting framework it is issued with a qualified audit opinion. A qualified audit opinion means that the financial report is materially different to the requirements of the relevant reporting framework or accounting standards, and is less reliable and useful as an accountability document.
Definitions of qualified and clear audit opinions are included in Appendix A of this report.
2.3 Quality of reporting
2.3.1 Introduction
The quality of an entity's financial reporting can be measured by the timeliness and accuracy of the preparation and finalisation of its financial report. To achieve cost effective financial reporting, public hospitals and their controlled entities need to have well planned and managed financial report preparation processes.
Entities should aim for the better practice elements detailed in Figure 2C to assist them to produce a complete, accurate and compliant financial report within the legislative time frame.
Figure 2C
Selected better practice – financial report preparation
Key area |
Better practice |
|---|---|
Financial report preparation plan |
Establish a plan that outlines the processes, resources, milestones, oversight, and quality assurance practices required in preparing the financial report. |
Preparation of shell statements |
Prepare a shell financial report and provide early to the auditors to enable early identification of amendments, minimising the need for significant disclosure changes at year-end. |
Materiality assessment |
Assess materiality, including quantitative and qualitative thresholds, at the planning phase in consultation with the audit committee. The assessment assists preparers in identifying potential errors in the financial report. |
Monthly financial reporting |
Adopt full accrual monthly reporting to assist in preparing the annual financial report. This allows for the year-end process to be an extension of the month-end process. |
Rigorous quality control and assurance procedures |
Require review of the supporting documentation, data and the financial report itself by an appropriately experienced and independent officer prior to providing to the auditors. |
Supporting documentation |
Prepare high standard documentation to support and validate the financial report, and provide a management trail. |
Rigorous analytical reviews |
Undertake rigorous and objective analytical review during the financial report preparation process to help improve the accuracy of the report. |
Reviews of controls/ self-assessment |
Establish sufficiently robust quality control and assurance processes to provide assurance to the audit committee on the accuracy and completeness of the financial report. |
Competency of staff |
Require that preparers of the financial report have a good understanding and experience in applying relevant accounting standards and legislation. Require that they also have project management and interpersonal skills. |
Financial compliance reviews |
Undertake periodic compliance reviews to identify areas of noncompliance or changes to legislation that impact the financial report. |
Adequate security |
Protect and safeguard sensitive information throughout the process to prevent inappropriate public disclosure. |
Source: Victorian Auditor-General's Office and Australian National Audit Office Better Practice Guide: Preparation of Financial Statements, June 2009.
2.3.2 Quality of financial reporting
As shown in Figure 2D, the overall quality of financial reporting in 2010–11 at 80 of the 112 public hospitals and associated entities was substantially the same as in 2009–10. It was positive to note that 26 entities have improved the quality of their financial reporting over that of the previous period.
Figure
2D
Quality of financial reporting in 2010–11
Quality of financial reporting |
Public hospitals |
Entities controlled by public hospitals |
Other health entities |
All entities |
|---|---|---|---|---|
Improved from previous year |
22 |
4 |
– |
26 |
Same as previous year |
59 |
18 |
3 |
80 |
Worse than previous year |
6 |
– |
– |
6 |
Total |
87 |
22 |
3 |
112 |
Source: Victorian Auditor-General's Office.
The assessment of performance was against better practice criteria using the following scale:
- no existence—function not conducted by the entity
- developing—partially encompassed in the entity's financial reporting preparation processes
- developed—entity has implemented the process, however, it is not fully effective or efficient
- better practice—entity has implemented the processes which are effective and efficient.
The results of our analysis are summarised in Figure 2E.
Figure
2E
Results of assessment of report preparation processes
against better practice elements
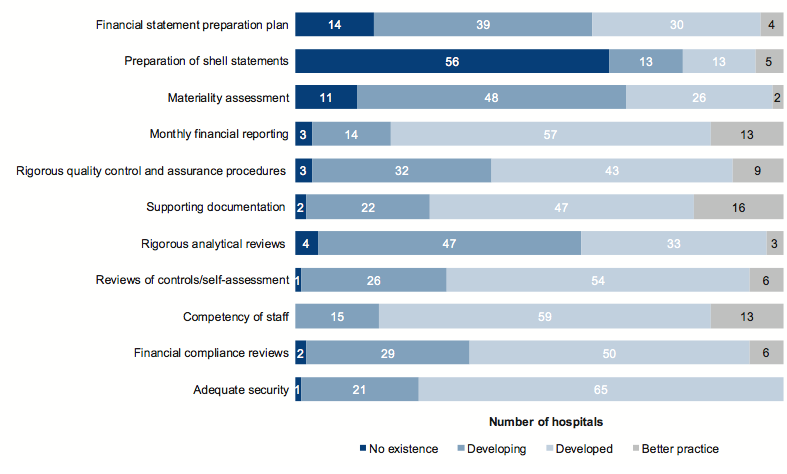
Source: Victorian Auditor-General's Office.
The developed or better practice elements commonly shared by public hospitals and their controlled entities include:
- monthly financial reporting
- rigorous quality control and assurance procedures
- supporting documentation
- reviews of controls/self-assessment
- competency of staff
- adequacy of security.
However, further improvement is needed in relation to:
- financial report preparation plan
- preparation of shell financial statements
- materiality assessment.
Improving these areas will assist the timely preparation of quality financial reports, oversight of resource allocation planning and quality assurance procedures and the early detection and correction of errors.
2.4 Timeliness of reporting
Recognising the importance of financial reports in providing accountability for the use of public monies, entities should prepare and publish their financial information on a timely basis. The later the reports are produced and published after year-end, the less useful they are for stakeholders and for informing decision-making.
The legislated time frame for entities reporting under the FMA to finalise their audited financial reports is within 12 weeks of the end of the financial year. These requirements also apply to entities controlled by public hospitals, as the finalised financial report of the controlling entity is to include the consolidation of the controlled entities.
Following on from the earlier mandated reporting times that applied and were largely achieved in 2009–10; the Premier issued a circular requiring all entities to also meet these earlier reporting time frames in 2010–11.
Figure 2F shows that the average time taken by public hospitals and associated entities to finalise their financial reports has slightly increased for metropolitan and regional hospitals, although there was an improvement for rural hospitals for 2010–11.
Overall the average time across all hospitals increased from 7.9 weeks in 2009–10 to 8 weeks in 2010–11. Metropolitan hospitals had an average reporting time of 7.5 weeks in 2010–11, an increase from 7.2 weeks in the prior year. Regional and rural hospitals took on average 7.8 and 8.3 weeks to report in 2010–11, compared to prior year averages of 7.5 and 8.2 weeks respectively.
This result essentially maintains the significant improvement on the 2008–09 financial reporting period where public hospitals took an average of 10 weeks to finalise their financial statements.
Figure
2F
Average time to finalise financial reports
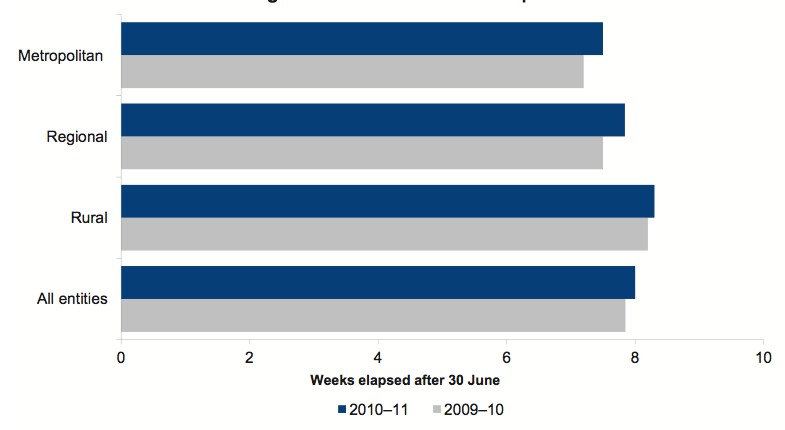
Source: Victorian Auditor-General's Office.
For 2010–11, 100 per cent of public hospitals achieved the 12-week time frame. This is in line with 2009–10, when 100 per cent met the 12-week requirement. Figure 2G shows the overall assessment of the timeliness of financial reporting for the 2010–11 reporting period.
Figure
2G
Overall timeliness of financial reporting in 2010–11
Timeliness of financial reporting |
Public hospitals |
Entities controlled by public hospitals |
Other health entities |
All entities |
|---|---|---|---|---|
Improved from previous year |
7 |
3 |
– |
10 |
Same as previous year |
73 |
18 |
3 |
94 |
Worse than previous year |
7 |
1 |
– |
8 |
Total |
87 |
22 |
3 |
112 |
Source: Victorian Auditor-General's Office.
It was encouraging to note that the shortened annual reporting time frames were achieved at almost all public hospitals and associated entities for 2010–11, consistent with the Premier's Circular No. 2011/02.
2.5 Accuracy
The frequency and size of errors in the draft financial statements requiring adjustment are direct measures of accuracy. Ideally, there should be no errors or adjustments arising through the audit process.
When our staff detect errors in the draft financial statements they are raised with management. Material errors need to be corrected before a clear audit opinion can be issued.
Overall, there are two types of adjustments:
- financial balance adjustments—changes to the balances being reported
- disclosure adjustments—changes to the commentary or financial note disclosure within the financial statements.
There were a total of 28 material financial balance adjustments to the net result or the net asset position reported in the draft financial statements across the 87 public hospitals in 2010–11 (39 in 2009–10). This means that on average there was about one material adjustment for every three entities. In addition, there were 32 significant amounts incorrectly classified that required adjustment in the draft financial statements.
Figure 2H shows the number of material financial balance adjustments per hospital by hospital category.
Figure
2H
Average number of material financial balance adjustments
per public hospital in 2010–11
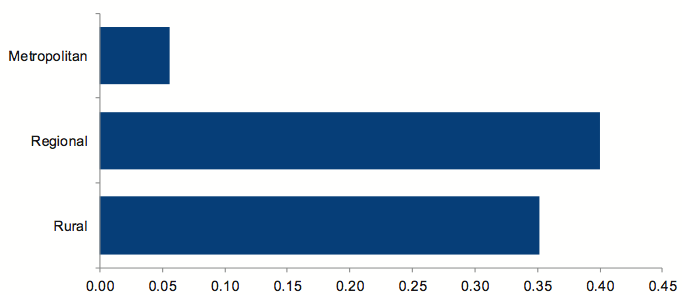
Source: Victorian Auditor-General's Office.
The total value of the adjustments to the net asset position was $16.9 million ($16.3 million in 2009–10), comprising a total increase of $21.8 million and a decrease of $4.9 million. The total value of adjustments to the net result was $4.6 million ($3.4 million in 2009–10), comprising adjustments to revenue of $12.3 million and adjustments to expenses of $7.7 million.
In addition to the financial balance adjustments, there were 32 significant disclosure errors that required adjustment in the 2010–11 draft financial statements (79 in 2009–10). This result is reflective of the increased effort made by the Department of Health and agencies to improve the quality of their financial reporting processes. Figure 2I shows the number of significant disclosure adjustments per hospital by hospital category.
Figure
2I
Average number of material disclosure errors per public hospital in
2010–11
Source: Victorian Auditor-General's Office.
Figure 2J identifies the proportion of material adjustments required to the draft financial statements by category.
Figure
2J
Material financial balance and disclosure adjustments
by category for 2010–11
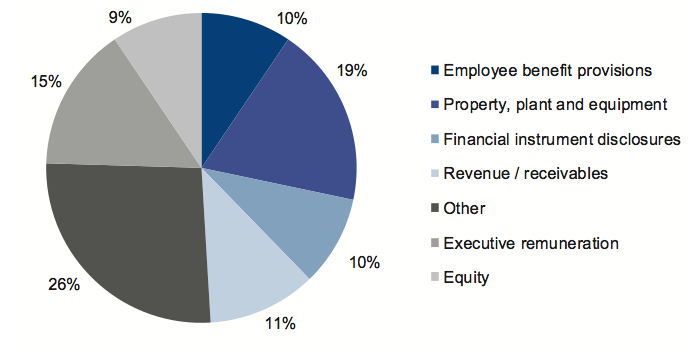
Source: Victorian Auditor-General's Office.
The nature of the material adjustments and disclosure adjustments are as follows:
- Property, plant and equipment—a substantial number of adjustments were required to correct the disclosure of property, plant and equipment, particularly in regard to land and building revaluation amounts and classifications, and the calculation of depreciation.
- Executive remuneration—adjustments were required to errors in the disclosure of executive remuneration in the notes to the financial statements. Common errors included not including all responsible persons, including persons in the incorrect income bracket and understating executive remuneration totals.
- Revenue/receivables—adjustments were required to the amount of revenue recognised where entities had incorrectly brought certain revenue to account or had brought revenue to account in the wrong year, contrary to the applicable accounting standard.
- Financial instrument disclosures—adjustments were required to be made to financial instrument disclosures due to errors in the amounts being reported and other incomplete or incorrect disclosures.
- Employee benefits provisions—adjustments were required to errors in the calculation of long-service leave provisions, generally caused by the incorrect application of on-costs, bond rates, wage inflation and probability factors.
Recommendation
- That public hospitals further refine their financial reporting processes by establishing financial report preparation plans, preparing timely shell financial statements and materiality assessments and performing periodic financial compliance reviews.
3 Financial results
At a glance
Background
The financial objective for public hospitals should be to generate a sufficient surplus from operations to meet their financial obligations, and to fund asset replacement and new asset acquisitions. The ability of public hospitals to achieve this depends largely on how well they manage their expenditure and whether they maximise revenue. The performance is measured by the operating result—the difference between revenue inflows and expenditure outflows.
Findings
- Public hospitals had a total operating deficit of $102 million for 2010–11; a significant improvement on the total operating deficit of $156 million in 2009–10.
- This improvement was mainly due to additional capital grants received by the regional hospital sector that are treated as revenue but are not expensed through the Comprehensive Operating Statement.
- Public hospitals generated revenue of $10.8 billion ($10.1 billion in 2009–10) and had expenditure of $10.9 billion ($10.3 billion in 2009–10). The growth in revenue and expenditure mainly arose from an increase in service provision and additional costs associated with CPI increases and previous wage outcomes.
- At 30 June 2011 public hospitals controlled $10.4 billion in total assets ($10.5 billion at 30 June 2010) and $3.1 billion of total liabilities ($3.0 billion at 30June 2010).
3.1 Introduction
The financial objective for public hospitals should be to generate a sufficient surplus from operations to be able to fund asset replacement, new asset acquisition and retirement of debt. The ability of public hospitals to achieve this depends largely on the funding policies established by the Department of Health and on each hospital's expenditure management and revenue maximisation practices. This is reflected in the composition and rate of change in their operating revenue and expenses.
3.2 Financial performance
Financial performance is measured by the result, the difference between revenue inflows and expenditure outflows. Consistent with the provisions of the Health Services Act 1988, public hospital boards and the department share responsibility for financial performance and management within the sector.
The department directly impacts on the financial performance of individual public hospitals. The level of health services to be delivered is negotiated between each hospital and the department each year, and is included in an annual health services agreement or statement of priorities. These agreements specify the volume, scope and quality of services to be provided by the hospital, and the funding to be provided by the department.
The funding cap for acute health services for each hospital is calculated based on the number of treatment services in the agreement and the average cost of care for each acute health treatment service. This casemix funding model takes into account a range of assumptions, including the typical length of a patient's stay in hospital and the category of hospital providing the service. The key assumptions used in the model are reviewed annually. Public hospitals are only partially funded for services that exceed the target. No funding is received for services that exceed the target by more than 2 per cent.
3.2.1 Operating result
The overall operating result for public hospitals improved significantly from a $156 million deficit in 2009–10 to a $102 million deficit in 2010–11. This was mainly due to the regional hospital sector, which went from an operating deficit of $17.8 million in 2009–10 to an operating surplus of $15.5 million in 2010–11. The turnaround in financial performance for regional hospitals occurred largely as a result of increased capital funding provided by the department. Although treated as part of the revenue stream, the resulting expenditure is capitalised and not expensed through the Comprehensive Operating Statement.
Figure 3A provides a comparison of the total operating results for each category of public hospital over the past two years.
Figure 3A
Total operating results of public hospitals for 2009–10 and 2010–11
|
Category |
Operating result for 2009–10 ($'000) |
Operating result for 2010–11 ($'000) |
|---|---|---|
|
Metropolitan |
(108 982) |
(100 871) |
|
Regional |
(17 801) |
15 544 |
|
Rural |
(29 564) |
(16 894) |
|
All hospitals |
(156 347) |
(102 221) |
Source: Victorian Auditor-General's Office.
Appendix C provides information on the composition of revenue, expenses, assets and liabilities for each public hospital category for 2010–11.
Revenue
The composition of operating revenue remained consistent with that of the previous year. The composition of public hospital revenue for 2010–11 is presented in Figure 3B.
Figure 3B
Revenue composition for 2010–11
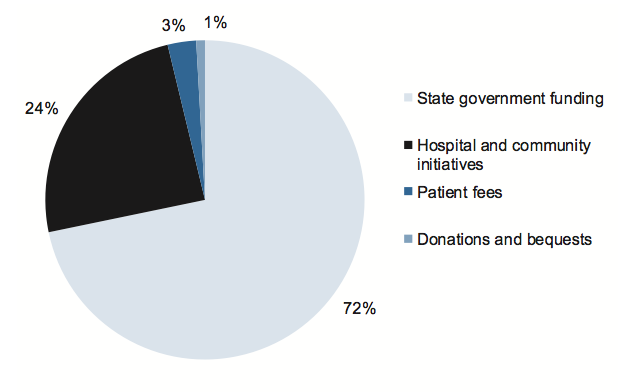
Source: Victorian Auditor-General's Office.
Public hospitals collectively generated $10.8 billion in revenue in 2010–11, an increase of $0.7 billion, or 7 per cent, from 2009–10 ($10.1 billion). The growth was primarily due to an increase in state government funding because more treatment services were provided, and an increase in private patient fees in line with the CPI.
Revenue from hospital and community initiatives, which includes funds generated through additional hospital sources, such as pharmacy, car parks and investments, remained stable.
State government funding remained the largest revenue component for public hospitals, providing 72 per cent of total revenue. Around 40 per cent of state government funding was derived from the Commonwealth Government under the National Healthcare Agreement.
The revenue composition among the three hospital categories differed. The major difference was that rural hospitals derived 54 per cent of their revenue from state government funding, compared with 74 per cent and 70 per cent for metropolitan and regional hospitals respectively. This is because rural hospitals have a larger proportion of residential aged care service facilities which are mainly funded directly from the Commonwealth.
Expenditure
The composition of public hospital expenditure also remained consistent with that of the previous year. The composition is presented in Figure 3C.
Figure 3C
Expenditure composition for 2010–11
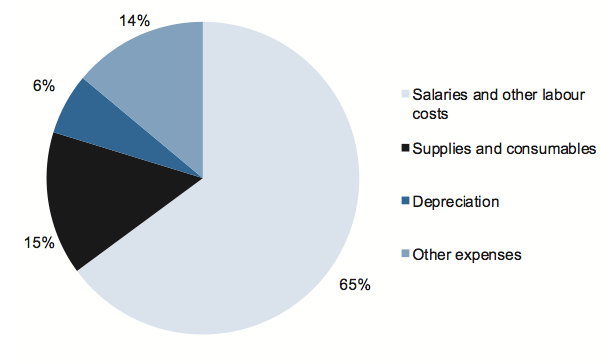
Source: Victorian Auditor-General's Office.
In 2010–11, public hospitals collectively spent $10.9 billion, an increase of $0.6 billion, or 6 per cent, compared to 2009–10 ($10.3 billion).
The growth was primarily a result of a 7 per cent ($466 million) increase in employee benefit costs in line with an increase in services provided and award increases for public hospital sector employees. There was no discernable difference in expenditure patterns between the metropolitan, regional and rural hospital sectors.
3.2.2 Financial position
An entity's financial position is generally measured by reference to net assets—the difference between total assets and total liabilities. However, this measure is less relevant for public hospitals, as they are not-for-profit, and generally do not hold assets from which they generate revenue.
As the revenue base for public hospitals is not tied to the value of their asset base and they cannot sell most of their assets to obtain funds, their objective should be to maintain their assets and related service provision, while managing the level of debt so it can be paid from future operations.
The ability of public hospitals to maintain their assets depends on asset and liability management policies, and is reflected in the composition and rate of change in the value of assets and liabilities.
Assets
In 2010–11 total public hospital assets decreased slightly from $10.5 billion to $10.4 billion. This was mainly due to a decrease in the written down value of assets held by rural hospitals, arising from the year's depreciation charges and the limited amount of new capital works in rural public hospitals.
Liabilities
As at 30 June 2011, total liabilities amounted to $3.1 billion, an increase of $96 million (3 per cent) compared to the same time in 2010.
Current liabilities increased by 5 per cent, from $2.2 billion in 2009–10 to $2.3 billion in 2010–11. Current liabilities were predominately made up of employee leave provisions and accounts payable. The overall increase in current liabilities was largely driven by an increase in employee leave provisions. The overall composition has not changed significantly since prior years.
Non-current liabilities of $787 million for 2010–11 were 7 per cent lower than for 2009–10 when they totalled $843 million. Almost two-thirds of non-current liabilities related to borrowings and finance leases, while non-current employee benefit provisions made up most of the remainder. The overall movement mainly reflected a further year's repayment of finance lease liabilities and the absence of any significant new borrowings taken on by public hospitals in 2010–11.
4 Financial sustainability
At a glance
Background
To be financially sustainable, public hospitals need the capacity to meet current and future expenditure as it falls due, and to be able to absorb foreseeable changes and financial risks as they materialise. This Part provides our insight into the financial sustainability of public hospitals obtained from analysing the trends in five indicators over a five‑year period.
Conclusions
Notwithstanding that 33 per cent of public hospitals (29 of 87) were assessed as having a high financial sustainability risk, the overall financial sustainability of public hospitals in 2010–11 remained stable. The indicators showed a slightly improved capacity for hospitals to meet short-term commitments. However, they are under continuing pressure to meet long-term commitments from the proceeds of their own operations, particularly to maintain and replace their assets as and when necessary.
The funding model has a direct and significant impact on the financial sustainability of public hospitals. It limits the ability of governing bodies and management to maintain and replace assets. The limitations on the governing bodies have implications for the discharge of, and accountability for, the performance of the hospitals.
Findings
- The risk to the overall financial sustainability of public hospitals is medium.
- 33 per cent (29 of 87) of public hospitals were considered high risk at 30 June 2011 (26 in 2009–10); mainly due to generating insufficient cash to adequately fund their operations.
- 61 per cent (53 of 87) of hospitals, including 25 major metropolitan and regional hospitals, had cash holdings equivalent to less than 30 days operating cash outflows.
- Twenty-nine public hospitals (30 in 2010) did not meet the going concern test of the Australian Accounting Standards. The Department of Health provided a letter of comfort for each of the 29, stating it would provide adequate cash flows to enable them to meet their financial obligations if required.
4.1 Introduction
To be financially sustainable, public hospitals need the capacity to meet their current and future expenditure as it falls due. They must also be able to absorb foreseeable changes and financial risks as they materialise.
As detailed in the Department of Health's 2010 report, Your Hospitals – A report on Victoria's public hospitals, public hospital admissions in Victoria have increased by 22 per cent since 2000. To meet the increasing demand for health services and deliver a high quality service, it is essential that hospitals are financially sustainable and maintain and upgrade their infrastructure and property assets. This is particularly challenging given the high costs of technological advances in medical treatments, changing community needs, an ageing population and workforce supply issues.
Insight into the financial sustainability of Victoria's 87 public hospitals is obtained from analysing the trends in five financial sustainability indicators over a five-year period. The analysis reflects on the position of individual hospitals, for the public hospital sector as a whole, and also on the basis of the three categories of hospitals: metropolitan, regional and rural. Appendix D of this report describes the sustainability indicators and risk assessment criteria used in this report.
The financial sustainability indicators and assessments flag departures from the norm that warrant attention. However, to form a definitive view of any entity's financial sustainability requires a holistic analysis that moves beyond financial considerations to include the entity's operations and environment. These further considerations are not examined in this report.
The results in this chapter should be analysed in the context of the regulatory environment in which the hospitals operate. This report also acknowledges the monitoring regime, including some key financial benchmarks, applied by the department in discharging its legislative responsibilities for evaluating and reviewing publicly funded health services.
4.2 Financial sustainability
4.2.1 Overall assessment
Twenty-nine public hospitals had a high risk sustainability assessment at 30 June 2011 (26 in 2009–10) mainly because they were generating insufficient cash to adequately fund their operations.
At 30 June 2011, 53 of 87 hospitals (61 per cent), including 25 major metropolitan and regional hospitals, had cash holdings equivalent to less than 30 days operating cash outflows. This included 24 hospitals that had less than seven days operating cash flows at 30 June 2011 (17 in 2009–10), nine of which were metropolitan hospitals.
In 2011, 29 public hospitals (30 in 2010) did not meet the going concern test in the Australian Accounting Standards. Those hospitals were provided with a letter of comfort that the department would provide adequate cash flows to enable them to meet their obligations should this be required.
Our analysis shows that funding arrangements have a direct and significant impact on the financial sustainability of public hospitals. The funding model limits the ability of governing bodies and management to make decisions around asset maintenance and replacement, and some major hospitals consistently experience cash shortages. This has implications for the governing boards of public hospitals and their ability to fulfil their legislative responsibilities.
Overall risk assessment
A financial sustainability analysis was performed on the 87 public hospitals. The analysis showed that 29 public hospitals had a high sustainability risk at 30 June 2011 (26 in 2009–10) because they were generating insufficient cash to adequately fund their operations.
A summary of the financial sustainability results for each hospital by category, metropolitan, regional and rural, is provided in Figure 4A.
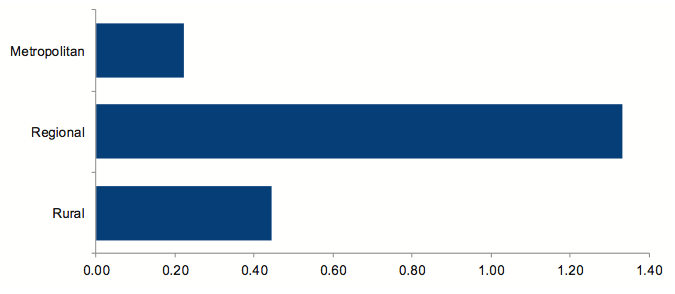
Figure 4A
Financial sustainability risk assessment by hospital category
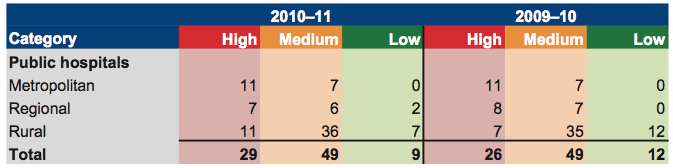
Source: Victorian Auditor-General's Office.
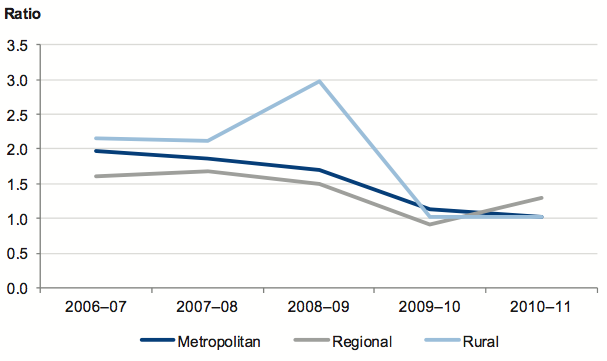
Figure 4B shows the five-year mean financial sustainability risk assessments for each public hospital category. Apart from the self-financing indicator, each financial sustainability indicator recorded a low or medium assessment. Risk for the self‑financing indicator was assessed as high. This led to an overall financial sustainability assessment of moderate risk for all categories of public hospitals and at the public hospital sector level as a whole.
Figure 4B
Five-year mean financial sustainability risk assessment
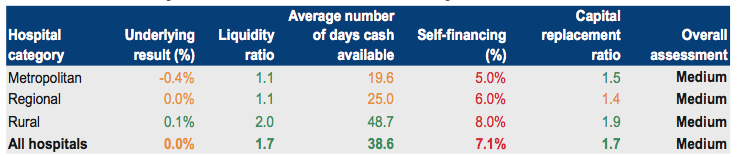
Legend: Red = High risk; Amber = Medium risk; Green = Low risk.
Source: Victorian Auditor-General's Office.
The individual financial sustainability assessment results for 2006–07 to 2010–11 are provided in Appendix C, along with the risk assessment criteria.
4.2.2 Summary of trends in risk assessments over five‑year period
When the risk assessments for each indicator are analysed individually they show the following trends over the five years to 2010–11:
- Underlying result—the proportion of underlying result risk assessments in the medium category increased over the period. However, the 2008–09 revaluation of assets significantly decreased the number of hospitals in the low-risk category from 2009–10 onward.
- Liquidity—the ability of public hospitals to repay their short-term financial obligations improved, including a slight improvement between the high and medium risk categories in 2010–11.
- Average number of days cash available—the number of hospitals in the low‑risk category was stable over the period however, there was a significant shift from the medium to the high-risk category.
- Self-financing—the mix of high, medium and low risk has remained stable, with a consistently high number of entities with a high-risk rating.
- Capital replacement—the number of hospitals with a high-risk capital replacement assessment remained stable in 2010–11 after deteriorating over the preceding four years.
In summary, the trend shows an improving capacity for hospitals to meet their short‑term commitments. However, they are under continuing pressure to meet their long-term commitments from the proceeds of their own operations, particularly to maintain and replace their assets as and when necessary.
Further information about the risk assessments for each indicator is presented later in this Part.
4.2.3 Impact of the funding model on sustainability
Over and above the analysis of financial sustainability indicators, trends and risks, the ability of management and the governing body to make decisions necessary to affect an entity's operations needs to be taken into account in assessing the entity's performance. Under section 33 of the Health Services Act 1988, the functions of the board of a public hospital are to oversee and manage the hospital, and to ensure that services provided comply with the requirements of the Act and the hospital's objectives.
Notwithstanding the application of transaction and sector neutral Australian Accounting Standards and accrual accounting by public hospitals, the departmental funding model does not fully provide for depreciation until the department has determined the capital requirements of individual hospitals. The department allocates capital grants strategically across the sector rather than progressively to each hospital. However, public hospitals are governed by boards which are legislatively established to be accountable for financial management and performance.
This mismatch between the governance and funding models blurs accountability for the financial performance of the individual hospitals. Management and the governing bodies of hospitals have limited control over capital funding whilst legislatively remaining accountable for the impacts of ageing infrastructure and associated expenditure.
For hospitals to maintain an adequate level of service, their assets need to be maintained and replaced when necessary. Sixty-eight of the 87 public hospitals (78 per cent) had a self-financing risk assessment of high in 2010–11. These public hospitals were essentially dependent on additional funding from the department for most of their maintenance, upgrade and capital needs. For 2010–11, around half of all public hospitals received state capital grants of less than 20 per cent of their depreciation expense for the reporting period (53 per cent for 2009–10).
4.3 Five-year trend analysis
This section provides an analysis and commentary on each indicator's trends for the past five years. The five indicators used are the underlying result, liquidity, average number of day's cash available, self-financing and capital replacement.
4.3.1 Underlying result
Figure 4C shows that the average underlying result has deteriorated across the five years, although it improved in 2010–11 across all categories of public hospitals.
Figure 4C
Average underlying result by hospital category
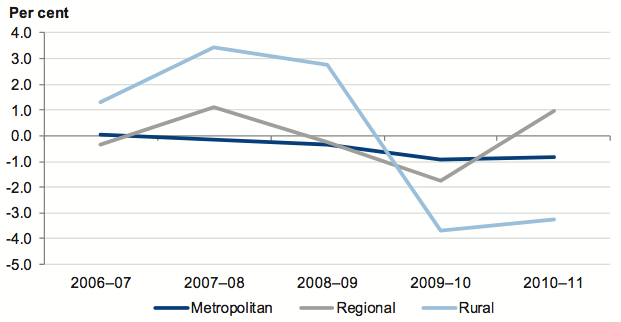
Source: Victorian Auditor-General's Office.
The trend since 2009–10 indicates that revenue has grown faster than expenditure. Depreciation expenses increased significantly in 2009–10, following asset revaluations at 30 June 2009. The significant increase in 2009–10 has now flowed through to 2010–11.
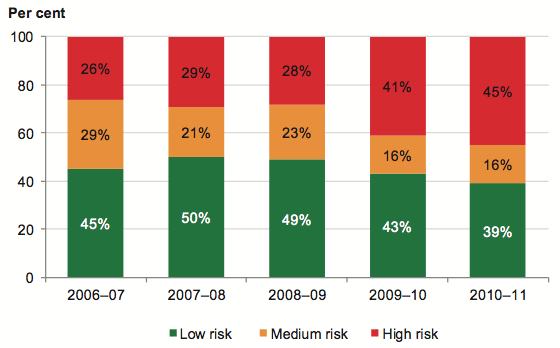
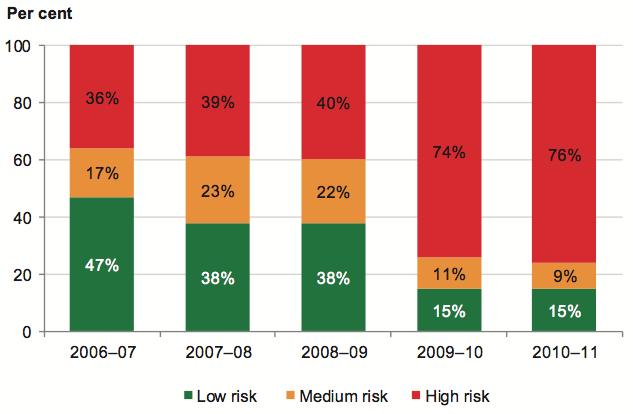
Figure 4D shows that 9 per cent (eight of 87) of public hospitals had a risk assessment for their underlying result of high for 2010–11, an improvement on 2009–10 when 13 per cent (11 of 87) of public hospitals were assessed as high risk.
Figure 4D
Underlying result risk assessment
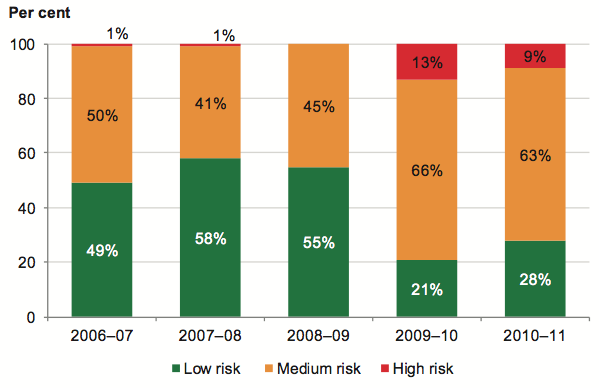
Source: Victorian Auditor-General's Office.
The proportion of underlying result assessments in the medium category increased to 63 per cent (55 of 87) from 49 per cent over the five-year period. However, the effect of the 2008–09 revaluation of assets can be clearly seen in the significant decrease in the number of hospitals in the low risk category from 2009–10 onward.
In 2010–11, 68 of 87 public hospitals recorded a negative underlying result compared to 69 in 2009–10. As shown in Figure 4E, 80 per cent of rural hospitals and around 60 per cent of metropolitan and regional hospitals had an underlying deficit for the year.
Figure 4E
Percentage of public hospitals with an underlying deficit
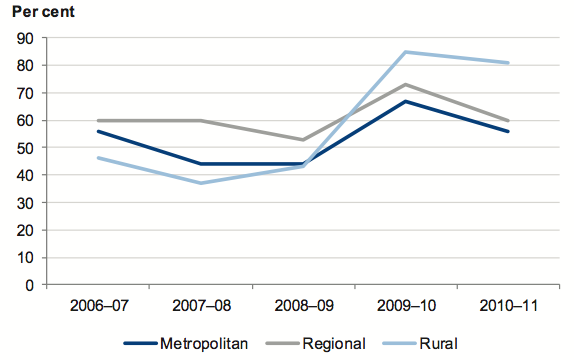
Source: Victorian Auditor-General's Office.
While underlying financial performance improved slightly this year, it was still impacted by the substantially higher depreciation charges which commenced in 2009–10, following the revaluation of hospital buildings. Under the funding model, the department does not fund hospitals for depreciation. Therefore it is expected that some hospitals will record operating deficits from time to time.
Over time total revenue from whatever source must equal or exceed total expenditure, or an entity will not be able to sustain its operations. If operating deficits persist there is a real risk that cash reserves will be depleted, and that expenditure and capital programs will need to be curtailed. In particular, expenditure that is perceived to be discretionary, for example maintenance, may be deferred or abandoned, leading to higher demand for replacement of assets in the longer-term.
The department monitors the 'net result before capital and specific items' of public hospitals, rather than the underlying result. The net result before capital and specific items excludes revenue and expenditure types such as:
- capital grants and related expenditure
- depreciation and amortisation
- non-current asset revaluation increments and decrements
- reductions in the value of investments
- reversals of provisions
- the effects of voluntary changes in accounting policies
- impairment of financial and non-financial assets.
Under this measure 31 per cent (27 of 87) of public hospitals recorded a net deficit before capital and specific items for 2010–11, compared with 40 per cent (35 of 87) for 2009–10. These percentages are notably less than those in Figure 4E. There is a risk that decisions made on these figures will be unsound and not provide a sustainable basis for public hospitals, in the event that capital funding is not forthcoming.
4.3.2 Liquidity
Public hospital liquidity of the larger metropolitan and regional hospitals is monitored by the department. The department's liquidity ratio benchmark is 0.7, which takes into account the funding arrangements it applies to public hospitals.
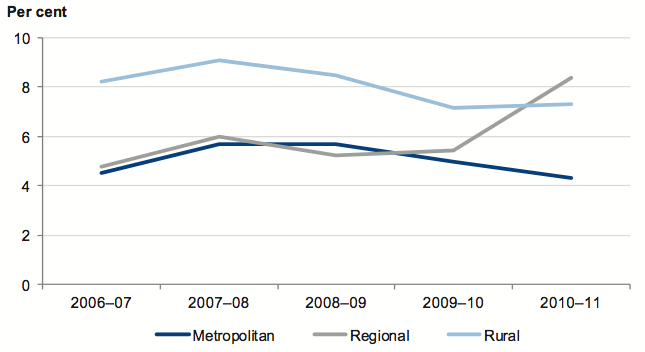
Figure 4F shows that over the five-year trend period rural hospitals had the highest average liquidity ratio, measuring 1.85 in 2010–11. Although showing some improvement, metropolitan and regional hospitals had the lowest ratios, with averages for 2010–11 of 1.36 and 1.19 respectively.
Figure 4F
Average liquidity ratio by hospital category
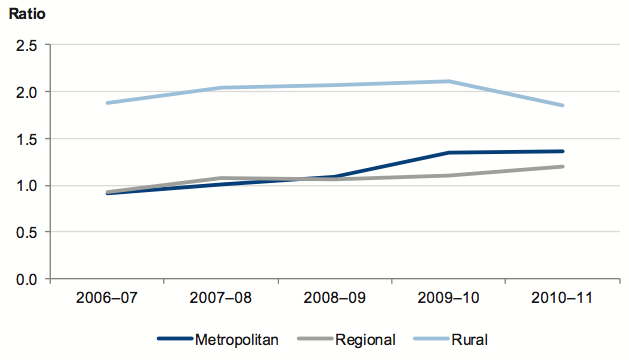
Source: Victorian Auditor-General's Office.
There has been a relatively stable positive trend in this indicator across all categories of public hospitals over the past five years. Nevertheless, 2010–11 saw deterioration in liquidity ratios for rural hospitals and a slight improvement for metropolitan and regional hospitals.
Overall, 28 of 87 public hospitals had higher current liabilities than current assets in 2010–11, resulting in an assessment of either moderate or high risk. Hospitals in this category must rely on new funds generated in the next financial year to meet some of their existing short-term obligations.
Figure 4G shows that overall the ability of public hospitals to repay their short-term financial obligations has improved over the five-year period, including a slight improvement between high and medium risk in 2010–11.
Figure 4G
Public hospital liquidity risk assessment
Source: Victorian Auditor-General's Office.
During 2011, the department concluded that 29 public hospitals (30 in 2010) did not technically comply with the going concern test in the Australian Accounting Standards. This is consistent with the number of hospitals identified in our analysis as having either a high or medium liquidity risk assessment.
Consequently, the department provided the boards of the 29 hospitals with a written commitment—a letter of comfort—that it would provide adequate cash flows to enable them to meet their current and future obligations as and when they fall due up to September 2012, should this be required. The hospitals, including 16 of the 33 major metropolitan and regional hospitals, account for 66 per cent of the total turnover of all Victorian public hospitals.
Figure 4H provides a listing of hospitals that had a letter of comfort from the department at the date of signing their 2010–11 financial reports.
Figure 4H
Public hospitals receiving a letter of comfort from the Department of Health for 2010–11
|
Metropolitan
Regional
|
Rural
|
Source: Victorian Auditor-General's Office.
4.3.3 Average number of days cash available
Payments are made to each public hospital fortnightly by the department. While cash management is the responsibility of the hospitals themselves, the department has a significant impact on their ability to do so, given the established hospital funding arrangements.
Prudent financial management provides for an entity to have the equivalent of at least one month's operating cash outflows available as unrestricted cash holdings. This is consistent with the departmental funding model.
Figure 4I shows that the average number of days of unrestricted cash available at year end to cover operating cash outflows has steadily deteriorated across each public hospital category. The position of rural hospitals on this measure is significantly better than metropolitan and regional hospitals on average.
Figure 4I
Average number of days cash available by hospital category
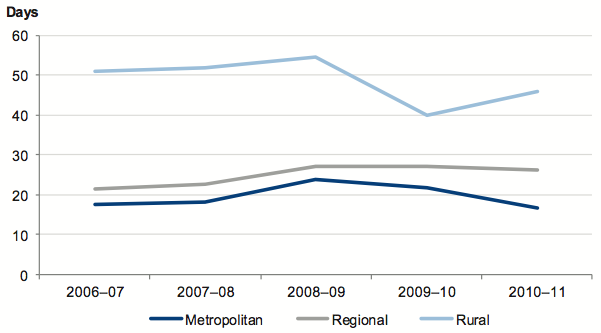
Note: Restricted cash, comprising funds held in trust, unspent capital grants, as well as other restricted special purpose funds has been excluded from this analysis.
Source: Victorian Auditor-General's Office.
The figure shows that there was a substantial improvement in the rural hospitals' ability to meet their cash flow commitments as at 30 June 2011. However, on average, metropolitan hospitals were not able to fund their operations for more than 20 days.
Figure 4J shows that 53 of 87 public hospitals (61 per cent) had a high- or medium-risk assessment for cash holdings for 2010–11, with cash holdings equivalent to less than 30 days operating cash outflows. This included 25 major metropolitan and regional public hospitals.
Figure 4J
Public hospital average number of days cash available risk assessment
Source: Victorian Auditor-General's Office.
Twenty-four hospitals had less than 7 days operating cash flows at 30 June 2011 (17 in 2009–10). Nine of the 24 were metropolitan hospitals. Of the eight larger metropolitan and regional hospitals with low cash holdings at 30 June 2011, five had other less‑liquid financial instruments to call upon in the event of a cash shortage.
Over the five-year period, the number of hospitals in the low-risk category has been stable. However, there has been a significant shift from the medium to the high-risk category.
4.3.4 Self-financing
Figure 4K shows that the movement in the average self-financing ratio has been variable for each of the three hospital categories over the five-year period.
Figure 4K
Average self-financing indicator by hospital category
Source: Victorian Auditor-General's Office.
Regional hospitals improved substantially on this measure for 2010–11 and achieved a notably higher average self-financing ratio than both metropolitan hospitals and rural hospitals.
However, the 2010–11 average self-financing ratio was less than the minimum 10 per cent high-risk benchmark for all three hospital categories, indicating hospitals cannot effectively replace their assets over the long term using income generated by their operations. Under these circumstances there is a greater reliance on the provision of additional government funding for asset renewal and replacement.
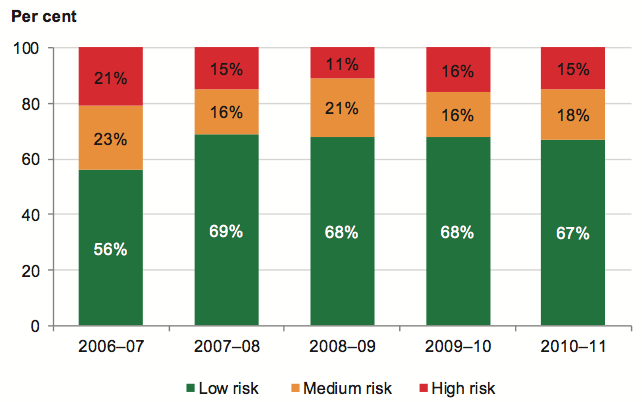
Figure 4L further illustrates this with 68 of 87 public hospitals (78 per cent) having a self-financing risk assessment of high. This is largely a consequence of the departmental capital funding model.
Figure 4L
Public hospital self-financing risk assessment
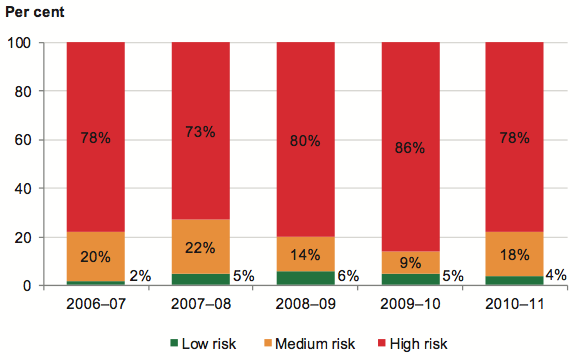
Source: Victorian Auditor-General's Office.
Over the five-year period, the mix of high, medium and low risk for this indicator has remained stable.
4.3.5 Capital replacement
Figure 4M shows the percentage of hospitals that have received state capital grants of less than 20 per cent of their depreciation expense for each financial year over the five‑year period. For 2010–11, 42 of 87 public hospitals (48 per cent) were in this category (53 per cent for 2009–10).
Figure 4M
Percentage of hospitals with capital grants of less than 20 per cent of depreciation expense
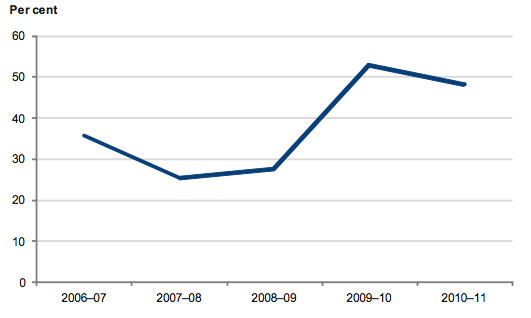
Source: Victorian Auditor-General's Office.
The capital replacement indicator compares the rate of spending on infrastructure, property, plant and equipment with an entity's depreciation. This is a long-term indicator as capital expenditure can be deferred in the short term if there are insufficient funds available from operations.
Figure 4N shows that the capital replacement indicator deteriorated across all public hospital categories to 2009–10, however, improved slightly in 2010–11.
Figure 4N
Average capital replacement indicator by category
Source: Victorian Auditor-General's Office
Figure 4O shows the number of hospitals with a high-risk capital replacement assessment remained stable in 2010–11 after having deteriorated over the preceding four years. This indicator was significantly impacted by the upward valuation of hospital buildings in prior reporting periods, and the reassessment of their useful lives.
Figure 4O
Public hospital capital replacement risk assessment
Source: Victorian Auditor-General's Office.
The data illustrates that spending on capital works is not sufficient to maintain and upgrade existing infrastructure and equipment, posing a risk to the hospital sector's ability to keep up with the increasing demand for health services. This outcome is consistent with that for the self-financing indicator, and essentially is a consequence of the departmental capital funding model.
It should be noted that the asset spending data used in Figure 4O includes spending on both new and existing facilities. As a result, the true level of underspending on renewing existing assets is understated. The results, nevertheless, remain indicative and identify challenges for the department and a large portion of public hospitals.
5 Internal controls
At a glance
Background
This Part presents the results of our assessment of general internal controls and controls over procurement and information technology security in public hospitals.
Conclusion
Internal controls at public hospitals and controlled entities were adequate for producing reliable, accurate and timely financial reports. Nevertheless, a number of areas for improvement were identified.
Findings
- Internal controls over masterfile standing data changes; key account reconciliations; management reporting and governance; asset acquisition, maintenance and monitoring; authorisation of supplier payments; and payroll authorisation and management can be improved.
- Information technology (IT) security would be strengthened by improving policies, establishing more effective management practices and enhancing compliance monitoring.
- While no significant weaknesses were identified over physical access controls in public hospital IT environments, a number of the larger metropolitan and regional hospitals have IT security issues that require improvement. Particular attention is warranted for IT security policies.
- There was limited internal audit coverage over procurement and IT security functions.
Recommendations
That public hospitals:
- Assess their policies and practices against the identified general internal control weaknesses to determine the adequacy of their controls, and whether they are operating reliably, efficiently and effectively.
- Develop comprehensive policies and procedures for procurement and tendering which are appropriately approved and subject to regular review.
- Develop comprehensive policies and procedures over information technology system security which are approved at board level and subject to regular review.
- Develop an information security classification policy that outlines criteria for assigning security classifications to information and the required security controls for each classification.
- Undertake periodic assessments of the adequacy of, and compliance with, IT security requirements.
5.1 Introduction
Effective internal controls help public hospitals reliably and cost-effectively meet their objectives. Reliable internal controls are a prerequisite for the delivery of reliable, accurate and timely external and internal financial reports.
In our annual financial audits, we focus on the internal controls relating to financial reporting and assess whether entities have managed the risk that their financial statements will not be complete and accurate. Poor controls diminish management's ability to achieve their entity's objectives and comply with relevant legislation. They also increase the risk of fraud.
The governing body of each public hospital is responsible for developing and maintaining adequate systems of internal control to enable:
- preparation of accurate financial records and other information
- timely and reliable external and internal reporting
- appropriate safeguarding of assets
- prevention or detection of errors and other irregularities.
The Standing Directions of the Minister for Finance require management to implement effective internal control structures.
In this Part we report on aspects of internal controls in the state's 87 public hospitals. We specifically address:
- general internal controls
- controls over procurement
- controls over information technology security.
5.2 General internal controls
Internal controls at public hospitals and their controlled entities were overall assessed as adequate for maintaining the reliability of financial reporting, the efficiency and effectiveness of their operations and compliance with relevant laws and regulations. Nevertheless, we identified instances where important internal controls commonly need to be strengthened. These matters were reported to the related public hospital's board and management team.
The commonly identified areas that require improving were:
- reviewing masterfile standing data changes
- preparing and reviewing key account reconciliations
- management reporting
- acquiring and maintaining assets
- authorising supplier payments
- authorising and managing payroll.
Figure 5A sets out the financial areas and systems that had the highest occurrence of weaknesses in 2010–11. Nineteen per cent of findings were associated with payroll systems and processes and 18 per cent were related to expenditure and accounts payable.
Figure
5A
Occurrence of control weaknesses by account balance and system
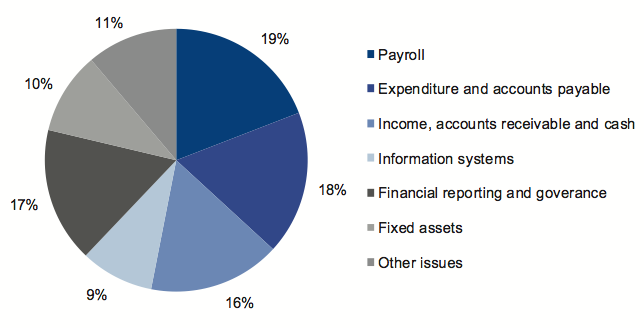
Source: Victorian Auditor-General's Office.
The incidence of control weaknesses was found to be proportionately higher at regional and rural public hospitals.
5.2.1 Review of masterfile standing data changes
Financial systems, such as accounts payable, accounts receivable and payroll systems rely on the maintenance of standing data on masterfiles to enable reliable processing of individual payments. Masterfile data can include details such as names, addresses, pay rates and bank account details.
It is important that all changes made to masterfile standing data are checked for completeness, accuracy and legitimacy. Otherwise subsequent processing errors can be repeated many times over reducing data integrity. Further, an independent review of masterfile standing data changes is important:
- for the detection and timely correction of unintentional or fraudulent changes
- to guard against payments to unauthorised suppliers, or unauthorised adjustments to pay rates.
Twenty-six of the 87 public hospitals (30 per cent) did not independently review changes made to masterfile standing data, including:
- changes to individual or global employee pay rates in employee masterfiles
- changes to vendor masterfiles.
There was also inadequate documentation to support changes to masterfile data.
These weaknesses were identified in the Auditor-General's report, Public Hospitals: Interim Results of the 2009–10 Audits, and it was disappointing that this occurrence has increased in 2010–11.
Independent review of amendments to stored data is especially important in small entities where there are fewer staff available to enable effective segregation of key financial functions. In the absence of independent review, the likelihood of errors remaining undetected increases, and there is greater opportunity for fraudulent activity.
Nevertheless, at 15 of the 54 rural hospitals, control weaknesses relating to the lack of independent review were identified over changes to standing data on masterfiles.
5.2.2 Preparing and reviewing key account reconciliations
A financial report is compiled from information captured in an entity's general ledger, with key general ledger balances supported by information in subsidiary ledgers such as accounts payable, fixed assets and payroll systems. Periodic reconciliation of general ledger with subsidiary ledger balances enables confirmation of the completeness and accuracy of data recorded.
Timely preparation and independent review of reconciliations decreases the risk that errors may go undetected or not resolved in a timely manner, both of which can adversely impact the accuracy of financial reporting.
Twenty-four of 87 public hospitals (28 per cent) had deficiencies in preparing and reviewing reconciliations: key reconciliations were either not prepared, not independently reviewed, or the review did not occur on a timely basis. The 24 hospitals included six of the 18 metropolitan hospitals.
5.2.3 Management reporting and governance
Effective governance is essential for both the daily operations and long-term success of public hospitals. Reliable financial reporting provides management and boards with timely and accurate information about performance and outcomes achieved. While information presented to senior management may differ depending on size, location and individual characteristics of each hospital, it is critical that the information and financial reports are accurate, relevant and timely to enable the right decisions to be made at the right time.
Opportunities for improvement in controls over management reporting and governance were identified at 26 hospitals. The most commonly identified issues were:
- non-existent or out-dated policies
- untimely provision of financial information to the board
- incorrect accounting for equity interests in joint ventures.
5.2.4 Acquiring and maintaining assets
Public hospitals have substantial assets including medical equipment, furniture and fittings, computers and communications equipment. The assets need to be appropriately recorded and maintained and their condition and use monitored, so that decisions can made about whether they are appropriately valued and when they need to be replaced. Inadequate recording and monitoring of assets may enable their misappropriation or misplacement. It is important that stocktakes of assets, particularly of attractive items such as laptops, are performed regularly.
Control weaknesses over the acquisition, maintenance and monitoring of assets were identified at 19 of the 87 public hospitals (22 per cent).
Common weaknesses were:
- incorrect recording in the fixed asset register
- insufficient policies over the acquisition and disposal of equipment
- incorrect valuation
- inadequate stocktaking procedures and failure to investigate and explain variances in the results.
Larger hospitals control a greater proportion of assets across the public hospital sector, commonly at a number of sites. For these hospitals having appropriate controls in place over fixed assets is particularly important. Control weaknesses over assets were identified at 10 of the 33 metropolitan and regional hospitals (30 per cent).
5.2.5 Authorising supplier payments
Financial delegations enable the approval of transactions commensurate with prudent financial governance, and also support efficient operations. It is usual practice for payments by cheque or electronic funds transfer to be authorised by two persons, to reduce the risk of unauthorised or fraudulent payments.
Non-compliance with approved financial delegations or dual authorisation requirements increases the risk of inappropriately authorised payments and the misappropriation of assets. In small entities with few administrative staff, it can be difficult to adequately segregate key processing and payment functions to mitigate the risk.
Fifteen of 87 public hospitals (17 per cent) either did not comply with their established financial delegations, did not require dual authorisation for cheque and electronic funds transfer payments, or did not adequately review transactions prior to payment. These control weaknesses were identified in 11 small rural hospitals.
5.2.6 Payroll authorisation and management
Salaries and wages are the most significant cost for public hospitals and so effective internal controls over the processing, authorisation and monitoring of these costs are important.
Some public hospital staff work rostered shifts which differ from one period to the next. To effectively control the accuracy of timecards submitted and therefore the salaries paid, direct line managers need to be responsible for approving timesheets as they are in the best position to verify the hours worked by their staff. Timesheets should not be processed and paid until they have been appropriately approved.
At 19 public hospitals (22 per cent), payroll-related control weaknesses were identified. These were most common at rural hospitals where 15 had weaknesses in their payroll authorisation and management processes.
Most commonly identified weaknesses across the sector were:
- processing of unapproved timesheets
- insufficient review and authorisation of payroll reports before staff were paid
- inappropriate user access to payroll systems
- employees incorrectly classified and/or paid excessive overtime rates.
5.3 Controls over procurement
In 2010–11 public hospitals procured goods and services in excess of $1.6 billion, almost 15 per cent of the $10.9 billion total hospital expenditure for the year. This represents the second largest cost to public hospitals, after salaries and wages.
Metropolitan hospitals account for 76 per cent of the state's public hospital spending on goods and services. Regional public hospitals account for 20 per cent, and rural public hospitals, 4 per cent. Figure 5B shows the spending on goods and services by public hospitals for the past two years.
Figure
5B
Spending on goods and services by public hospitals
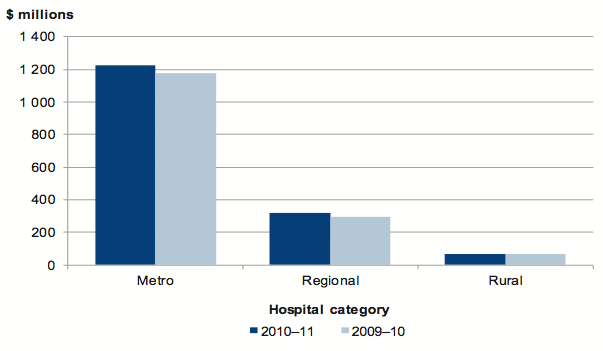
Source: Victorian Auditor-General's Office.
We reviewed the policies, management practices and controls, and governance and oversight arrangements for public hospital procurement. Our review had the following aims:
- to provide a snapshot of the adequacy of the policies, practices and controls
- to provide useful industry-wide benchmarks and statistics to assess the performance of procurement management frameworks.
Under the Health Services Act 1988, primary responsibility for implementing controls over public hospital procurement and tendering rests with a hospital board. Boards should require establishment and monitoring of controls to deliver operational requirements efficiently and value for money, and compliance with requirements of the Financial Management Act 1994.
5.3.1 Procurement management framework
Effective management of procurement will mitigate the following strategic and operational risks:
- reduced value-for-money for the government, the agency and the community due to inadequate competition
- unnecessary costs from poorly managed processes
- lack of transparency, and probity deficiencies.
In establishing controls public hospitals should adopt a procurement management framework with:
- comprehensive policies and procedures
- appropriate management practices
- sound governance and oversight.
Figure 5C outlines the key elements of an effective procurement management framework. It draws on the Victorian Auditor-General's Office's good practice guide Public Sector Procurement: Turning Principles into Practice, as well as the requirements of the Financial Management Act 1994, the Health Services Act 1988 and policies of the Victorian Government Purchasing Board (VGPB).
It provides a comprehensive approach to managing procurement, and outlines best practice criteria for tendering. The specific elements applied to each procurement exercise may vary depending on the value, volume and complexity of the goods or services being purchased.
It is expected that larger metropolitan and regional hospitals will have more comprehensive internal controls in place over key procurement functions, given the relative volume and complexity of their procurement activities. However, to deliver value-for-money and efficient transaction processing, we would expect that the controls set out in this report are in place at all public hospitals.
Figure 5C
Key elements of an effective procurement management framework
Component |
Key elements |
|---|---|
Policies |
Procurement and tendering policies that:
Authorisation arrangements and expenditure delegations documented. Strategic procurement plan detailing all procurement steps for high value, high risk or complex procurement exercises. Policies approved by the board. |
Management practices |
Probity plan developed for all high value, high risk or complex procurements. Conflicts of interest, actual or perceived, identified and declared. Evaluation plan clearly documented. Tender submissions evaluated against identical criteria. Tender submissions evaluated by suitably qualified staff. Documented evidence to demonstrate fairness and transparency of tender processes. Post tender evaluations conducted. Long-term purchasing arrangements reviewed to confirm value-for-money or identify alternative suppliers. Reporting on value-for-money achieved. Benchmarking against performance of other health providers. Comprehensive and regular reporting to management and board. Management review of policies, procedures, procedures and practices, periodically Probity auditor required for complex procurement or procurement over $10 million. |
Governance and oversight |
Compliance with policy, VGPB and other government requirements monitored. Procurement risks included in the entity's risk register and managed. Internal audit review of policy compliance and procurement processes and practices. Oversight of probity plans for all high value, high risk or complex procurement by the board. Periodic review of procurement policies by management and board. Monitoring of procurement performance and the results of significant tenders by management and board. |
Source: Victorian Auditor-General's Office.
We assessed the procurement management frameworks of the 87 public hospitals by considering the above elements.
Controls over procurement were generally adequate at public hospitals. Nevertheless, opportunities for improvement were identified, particularly in regard to the procurement and tendering policies at rural hospitals, benchmarking of procurement outcomes and identifying risks associated with procurement.
5.3.2 Policies
Existence of procurement and tendering policies
Eighty-three of 87 public hospitals (95 per cent), including all major metropolitan hospitals, had policies for managing and controlling procurement. Two of the four hospitals without a policy were establishing one at 30 June 2011. The remaining two did not have a policy and weren't establishing one.
Seventy-two of the 87 public hospitals (83 per cent) also had a tendering policy, or had tendering requirements in their procurement policy.
As at 30 June 2011 a further six (7 per cent) were drafting tendering policies. The nine (10 per cent) that did not have such a policy were mainly smaller rural hospitals that did not typically have the purchasing volumes that required tendering to be undertaken.
Adequacy of procurement and tendering policies
While few procurement and tendering policies contained all of the desired elements set out in Figure 5C overall, policies were comprehensive. The majority of the policies incorporated:
- delegations and authorisation requirements—100 per cent
- procurement objectives—90 per cent
- details of the number and types of quotes required—87 per cent
- a requirement to avoid any actual or perceived bias or preferential treatment in selecting suppliers—80 per cent
- the need to comply with statutory requirements and VGPB policies—80 per cent
- details of when an open, selective or limited tender, or quotation is permitted—76 per cent
- probity requirements and information about avoiding conflicts of interests for tenders—74 per cent
- independence requirements between the purchaser and the supplier—72 percent.
Conversely, 58 per cent of procurement or tendering policies did not specify reporting requirements or frequency.
As expected, procurement and tendering policies at the larger metropolitan and regional hospitals were more comprehensive than at most of the rural hospitals. Our review indicated a need for the rural hospitals to enhance their procurement policies to more closely align with better practice, and their procurement needs.
Documented and approved financial delegations
The Health Services Act 1988 gives a public hospital board the power to delegate certain authorities and functions, including financial delegations. It is good practice for the board to periodically refresh and approve the delegations of its authority. A documented financial delegation should mitigate the risk of inappropriate or unauthorised procurement, while enabling administrative efficiency.
All public hospitals had documented their financial delegations, including approval requirements for procurement and tendering. Boards had approved the delegation schedule at 68 of the 87 public hospitals (78 per cent). At a further four the audit committee had approved the schedule, while at the remaining 15 hospitals the delegation schedule was approved by the chief executive officer or the chief financial officer.
Strategic procurement plans
A strategic procurement plan should set out the aspects of the procurement for larger‑scale purchases, to demonstrate that the procurement is well planned, and to assist effective acquisition of goods and services. Key aspects of a procurement plan include:
- a business case identifying the need for the procurement
- options for achieving outcomes
- consideration of the potential for partnerships and alliances, if relevant
- market capability analysis
- preliminary cost estimates
- risk assessment and mitigation strategies
- performance measures.
VGPB policy requires all public sector agencies that engage in procurement over the value of $10 million, or that is high risk or complex in nature, to prepare a strategic procurement plan. It is uncommon for smaller hospitals, particularly rural public hospitals, to make purchases greater than $10 million.
Of the metropolitan and regional hospitals, 18 of 33 (55 per cent) had not developed a clear definition of high risk, high value or complex procurement, while 23 of the 33 (70 per cent) had not documented the requirement to develop a strategic procurement plan for such purchases.
5.3.3 Management practices
Probity and tender evaluation arrangements
Health Purchasing Victoria (HPV) was established in 2001 as an independent statutory authority under Section 129 of the Health Services Act 1988. HPV works in partnership with public hospitals in order to understand their functional requirements, facilitate large‑scale collective tenders and manage common use contracts on behalf of the state.
Open or public tendering can deliver value-for-money through competition. VGPB guidelines state that any procurement valued at over $150 000 must be subject to open tender. Where not procured through collective or common use contracts, high value or complex procurement is conducted through open tendering by the hospitals themselves, including for the purchase of medical supplies and equipment, infrastructure and buildings.
In 2009–10 public hospitals procured supplies, equipment and services valued at $329 million through open tenders—either through the hospitals directly, or through HPV. Most of these tenders were for procurement by metropolitan hospitals. Rural hospitals procured goods totalling $7 million through open tender in 2009–10.
Remaining purchases were made through other methods, such as sourcing products directly and obtaining quotes. This is appropriate for procuring goods and services of lower value, and is consistent with VGPB guidelines.
A risk to achieving value-for-money is a lack of probity. It is important that hospitals conducting tender processes have clearly documented probity policies and procedures, such as those set out in Figure 5C, and that practices comply with them. It is best practice for an entity to prepare a probity plan to oversee complex procurement engagements.
The majority of hospitals had adequate probity arrangements in place:
- sixty-two of 87 (71 per cent) required tender submissions to be evaluated by staff who had undergone appropriate training
- sixty-seven (77 per cent) had procedures in place to declare and identify actual or perceived conflicts of interest
- seventy-four (85 per cent) had procedures to retain tender documentation for specified periods.
While overall probity arrangements were satisfactory, weaknesses observed at some of the 33 metropolitan and regional hospitals included:
- ten (30 per cent) did not have procedures in place to engage a probity adviser or independent person to perform a probity audit for the high-value, high-risk or complex contracts we examined
- seven (21 per cent) had not developed a probity plan for high-value, high-risk or complex procurement
- it was uncommon for the smaller hospitals to have arrangements for complex procurement in place.
Post tender evaluations
A post tender evaluation assesses whether a procurement exercise resulted in the right goods or services being procured, whether the cost was within budget, and whether the items procured met the specified requirements. The aim of the evaluation is to identify opportunities for improvement, and to provide an appropriate level of accountability to senior management and the board.
Fifteen of the 18 metropolitan hospitals (83 per cent) and eight of the 15 regional hospitals (53 per cent) routinely conducted post tender evaluations of their high-risk, complex or high-value procurement exercises.
Benchmarking procurement outcomes and costs
Benchmarking against other hospitals or industry standards provides an objective reference point for establishing targets and monitoring performance and trends. Benchmarking can enable assessment of whether trends are within normal parameters and whether a hospital is minimising the additional costs associated with procurement.
At 80 of the 87 public hospitals (91 per cent) there was no evidence of benchmarking procurement trends or performance against external standards. Six of the seven hospitals that did benchmark were metropolitan hospitals.
Benchmarks used varied. Comparisons were predominantly against information collected in previous years or more relevant benchmarks from comparable health services.
Reporting on value-for-money and procurement outcomes
Reporting comprehensively and regularly to management enables unfavourable purchasing outcomes to be identified and timely decision-making.
In 12 of the 18 metropolitan hospitals (66 per cent) management regularly analysed procurement performance. However, this was not commonly done at regional and rural hospitals where only five of the 69 (7 per cent) completed such an exercise.
At the 17 hospitals where procurement performance reports were prepared, they were generally comprehensive. Thirteen of them included an analysis of value-for-money and savings achieved through their purchasing arrangements.
Management review of policies, processes and practices
Periodic management review of policies, processes and practices enables changes to be made to address revisions to VGPB guidelines or operational requirements, or to address areas of concern and improvement opportunities identified through post tender evaluations. It also allows for business improvements to be introduced.
At 14 of the 33 metropolitan and regional hospitals (42 per cent) and 28 of 54 rural hospitals (52 per cent) management was unable to demonstrate that procurement policies, practices and processes had been reviewed since 30 June 2009.
5.3.4 Governance and oversight
Monitoring of compliance and performance
Under the Health Services Act 1988, a public hospital board is responsible for all aspects of a hospital's operations. To enable effective monitoring of procurement the board needs relevant, clear and regular reports on purchasing trends, outcomes and costs. Regular procurement reports enable the board to identify areas of concern and to direct management to implement remedial action in response to:
- higher than expected increases in expenditure
- additional costs incurred from inadequate supply arrangements
- lack of transparency or probity in procurement arrangements
- lack of savings from procurement arrangements.
Of the 17 hospitals that prepared reports on value-for-money and procurement performance, all but two reported the results to senior management or the board.
The outcome of significant tenders was reported to the board of 69 of 87 public hospitals (79 per cent), including 31 of the 33 metropolitan and regional hospitals (94 per cent), and 38 of 54 rural hospitals (70 per cent). This was most commonly monthly for the larger metropolitan and regional hospitals and following tenders at rural hospitals.
For the 69 public hospitals that reported on tender outcomes to their boards, the quality of the reporting was generally adequate. Fifty-seven of the 69 reports examined (83 per cent) contained comments regarding areas of concern.
Twenty of the 26 metropolitan and regional hospitals that prepared a probity plan for high-value or complex procurement had them endorsed by their board.
Risk recognition and management
Procurement risk needs to be recognised and monitored because if not managed effectively, negative consequences can result, such as excessive costs, poor supplier relationships and reputational damage.
Thirty-two of the 87 public hospitals (37 per cent) did not have risks associated with procurement management in the risk management register.
Periodic review of policies and procedures
Boards should periodically review procurement policies and procedures so that they accurately reflect the operational direction and strategic position of the hospital, and to enable areas of emerging concern to be proactively addressed.
Forty of 87 public hospital boards (46 per cent) had not reviewed their procurement policies since 30 June 2009. Most metropolitan (13 of 18) and regional (nine of 15) hospitals had reviewed their policies and procedures in the past two years. However, 29 of the 54 rural hospitals (54 per cent) were unable to demonstrate such a review by the board.
Internal audit
Internal audit can provide comfort that the internal controls and processes are working as intended, and that an effective governance and risk management framework is in place. Internal audits can assist hospitals in achieving their desired procurement outcomes, addressing shortcomings, and mitigating associated risks.
Over the past three years, 46 of the 87 public hospitals (53 per cent) had not commissioned internal audits of their procurement activities or practices. Specifically five of the 18 metropolitan hospitals (28 per cent), eight of the 15 regional hospitals (54 per cent) and 33 of the 54 rural hospitals (61 per cent), had not commissioned an internal audit of procurement since 30 June 2008.
5.4 Controls over information technology security
IT security controls relate to the protection of computer applications, infrastructure and information technology assets from a wide range of security and access threats. Such controls promote business continuity, minimise business risk, reduce the risk of fraud and error and help meet business objectives.
There is extensive reliance placed on information systems across the sector, and continuous upgrade and replacement of systems to improve information management and the quality of services provided to the community. With the implementation and upgrade of new IT, and the development of external threats, new security risks to the IT environment can arise.
Information held by public hospital systems about patients, and the financial and operational aspects of the business can be highly sensitive. It needs to be protected from unauthorised access, theft or manipulation.
Inadequate IT security can result in:
- unauthorised access to systems and the information stored
- privacy breaches
- loss of critical business information assets
- an increase in the risk of material misstatements in financial statements
- disruptions to the delivery of essential health services that are dependent on IT interfaces
- increased potential for fraud
- damage to the reputation of an agency.
5.4.1 Information technology security framework
Controls over IT security can be placed into two categories:
- general controls—controls surrounding the environment in which the computer systems operate
- application controls—controls which are performed automatically by the IT system to protect the completeness and accuracy of information.
Figure 5D outlines the key components of an effective IT security framework. It draws on the:
- Department of Treasury and Finance's Whole of Victorian Government Information Security Management Framework
- Standing Directions of the Minister for Finance under the Financial Management Act 1994
- International Standard Organisation's ISO27001:2006, Specification for Information Security Management
- the Information Systems and Control Association's best practice guidelines.
It provides entities with a comprehensive approach to the management of their IT security arrangements.
Figure
5D
Key elements of an effective IT security framework
Component |
Key elements |
|---|---|
Policy |
IT security policies that include:
An information security classification policy that provides:
Policies reviewed by the information security committee or the IT steering committee. Policies approved by the board. |
Management practices |
Adequate training for staff about IT security. IT risk register developed and maintained. Policies and procedures regularly reviewed and updated. Establishment and monitoring of operation of:
Periodic reporting on the status of IT systems and security arrangements, to the board. |
Governance and oversight |
IT security committee to oversee the development and update of security strategies, standards, policies and procedures, and to monitor mitigation of risks. IT steering committee to advise management on IT acquisitions and provide guidance on the provision of IT services. Adequacy of IT security arrangements reviewed and tested periodically by internal audit or consultants. Monitoring compliance with policies and procedures by management and board. |
Source: Victorian Auditor-General's Office.
IT systems security at public hospitals was generally strong, particularly around documented policies and procedures, effective physical access controls and the adequacy of IT training. Overall the IT environments were adequate for the security of sensitive data and the reliability of financial information.
Deficiencies were noted, however, relating to executive oversight of IT system security and there was a lack of internal audit review in this area. Given their size, it was concerning that a number of the larger metropolitan and regional public hospitals had IT security issues that required improvement.
5.4.2 Information technology security policies
Public hospitals store, process and communicate large volumes of information electronically. Effective IT security controls mitigate the risk that this information could be inappropriately accessed, or that information necessary for the efficient functioning of a hospital will be incomplete or inaccurate. Information technology systems should be supported by security policies and procedures that control access, and require monitoring and reporting on compliance with hospital policies and procedures.
Existence of information technology security policies
Sixty-six of the 87 public hospitals (76 per cent) had a documented IT security policy. A further seven (8 per cent) were drafting one at 30 June 2011. However, IT security policies were inadequate at five of the 33 metropolitan and regional public hospitals (15 per cent). Given the scale of these hospitals and the volume of sensitive information held within their IT systems, this is of concern.
Sixteen of the 54 rural hospitals (30 per cent) did not have adequate IT security policies. The 16 relied on policies established by the rural public health care agencies' IT alliances. The alliances were established by the former Department of Human Services in 2003–04 in order to facilitate access to core IT services for all publically funded regional and rural health care agencies.
The IT security policies established by the alliances were not comprehensive and not specifically designed to cover the operational security requirements of the individual members of the alliance.
Where IT security policies had been established, they were generally comprehensive, incorporating most of the better practice elements set out in Figure 5D. Across the sector, policies commonly incorporated the following better practice elements:
- network security requirements—91 per cent.
- consideration of relevant IT security standards—79 per cent
- consequences of information security policy violations—79 per cent.
Conversely, the following better practice elements were not incorporated into the IT security policies at a majority of public sector hospitals:
- security education, training and awareness requirements—67 per cent
- incident management processes—65 per cent
- business continuity management—62 per cent
- asset management processes—61 per cent.
Each of these aspects if not properly addressed can have far reaching impacts in the event that IT systems are compromised.
Information security classification policy
An information security classification policy outlines criteria for assigning security classifications to information and the required security controls for each classification, to limit access to sensitive information by unauthorised parties.
Ten of the 87 public hospitals (11 per cent) had an information security classification policy. Four were metropolitan hospitals and six were rural. Thirteen of the 87 public hospitals (15 per cent) were developing an information security classification policy.
This low rate of policy establishment is a concern. Across the public hospital sector there is a risk that confidential and sensitive information may be easily accessible to parties that do not have the authority to obtain such information, compromising patient privacy and the security, completeness and accuracy of business information.
Board approval of policy
IT security is a contemporary issue and should be a concern to members of public hospital boards, who are ultimately accountable. However, only 37 of the 66 public hospitals (56 per cent) with an IT security policy had board approval for the policy. Half of all metropolitan hospitals with an IT security policy obtained board approval. Twenty‑eight of the 49 regional and rural hospitals (57 per cent) with an IT policy had it approved at board level.
5.4.3 Management practices
Review of information technology policies
IT policies need to be periodically updated to keep up with changes in the development of IT systems and the increasing complexity of IT environments. It was positive to note that where IT security policies had been established, 85 per cent had been reviewed and updated at least once in the past three years.
Training
Training of staff is a critical component of implementing and maintaining IT security. Proper training enhances understanding of endorsed policies and procedures, and enables their correct and consistent application. Training can also highlight to staff the areas of greatest concern.
Fifty-nine of the 87 public hospitals (68 per cent) had conducted training for staff on IT security policies and procedures. The results were generally consistent across metropolitan, regional and rural hospitals.
Logical access and physical access controls
Logical access controls such as passwords restrict access to information or computer systems to people with the appropriate level of authorisation.
Physical access controls act to protect unauthorised access to information and hardware by preventing physical access for example by requiring passcards to enter buildings, locking offices at night, storing servers in secured data centres and keeping laptop computers locked up when not in use.
Based on a high-level review, physical security controls over IT systems at the 87 public hospitals were generally considered to be adequate. However, a number of logical access control weaknesses were identified.
Change management controls
Replacing and upgrading systems should lead to better management of information. However, the process of implementing changes to existing systems and transferring information from old systems to new poses a significant risk to information security. Effective controls over such changes are important to protect the integrity of data and any information transferred.
Eighty of the 87 public hospitals (92 per cent) had established adequate controls, and processes to manage changes to IT systems. Of these, four of the 15 regional hospitals (27 per cent) and 12 of 54 rural hospitals (22 per cent) relied on change management controls established by the rural public health care agencies' IT alliance. This was considered to be adequate as their change management processes and IT network is maintained through the alliance.
At the remaining seven hospitals (8 per cent), there were no established controls around the reconciliation of information before and after system upgrades. These included one metropolitan hospital, one regional hospital and five rural hospitals.
Backup and recovery procedures
Public hospitals handle large volumes of important and sensitive information and losing it would cause significant problems for both patients and hospitals. In order to protect this information, it is essential that public hospitals have appropriate backup and recovery procedures in place. These procedures should be tested regularly to check that they work as intended.
The Standing Directions of the Minister for Finance require entities to ensure up‑to‑date backups are maintained for all financial management systems and data being used.
Backup and recovery procedures were adequate at all public hospitals, with three regional hospitals and 11 rural hospitals relying on the backup procedures established by the rural public health care agencies' IT alliance. In most instances, backup procedures were performed daily at secure offsite locations.
Management of information technology risks
The Standing Directions of the Minister for Finance require public hospital boards to assess IT risks and their impact on financial management at least annually. All public sector agencies are also required to identify and manage their risks within the Victorian Government Risk Management Framework.
A risk assessment will identify key information assets and perceived security threats, and assess them based on probability and the risk appetite of the hospital. This enables mitigation strategies to be put in place focusing resources on the most highly rated IT risks, reducing the probability of these occurring and the severity of their impact.
Eighty of the 87 public hospitals (92 per cent) had adequate IT risk management policies. Thirty-one of the 80 (39 per cent) managed IT risks through the IT risk register. Fourty-nine (61 per cent) included IT risks in the hospital's overall risk register as part of its risk management framework.
The remaining seven public hospitals (8 per cent) had not included IT security as a risk in their risk register. These were generally smaller rural public hospitals.
5.4.4 Governance and oversight
Establishment of an information technology steering committee
Best practice across the public sector is to establish specialist committees for the governance of an entity's IT environment. The functions of an IT steering committee include advising management on IT investment requirements and providing guidance on the provision of IT services.
Of the 87 public hospitals, 48 of 87 (55 per cent) did not have an IT steering committee. Specifically, seven of the 15 regional hospitals (47 per cent), and 41 of 54 rural hospitals (76 per cent), had not established an IT steering committee. All metropolitan public hospitals had an IT steering committee.
Where there was no separate committee, the function was commonly performed by the board. This is understandable for smaller hospitals where they have fewer resources and generally a less complex IT environment. However, it is not appropriate for the 17 regional hospitals that are responsible for a range of complex activities and expenditure ranging from at least $45 million up to $508 million per annum.
Monitoring compliance with policies and procedures
Consistent with their responsibilities under the Health Services Act 1988, boards are responsible for reviewing the adequacy of IT security and assessing compliance with relevant internal policies.
Boards at 53 of the 87 public hospitals (61 per cent) had not established arrangements to monitor compliance with IT policies and procedures. This included 14 of the 33 metropolitan and regional hospitals (42 per cent), and 39 of 54 rural hospitals (72 per cent). Lack of monitoring increases the risk to timely identification and action in instances where IT security is breached.
At 29 of the 87 public hospitals (33 per cent), including nine of the 33 metropolitan and regional hospitals (27 per cent), and 20 of the 54 rural hospitals (37 per cent), updates on the status of IT systems and security arrangements are not provided to boards.
Where updates were provided they were most commonly undertaken through internal audits and monitored by the audit committee.
Internal audit
Reviews of IT security controls and compliance with policies and procedures are necessary for identifying control weaknesses, potential process improvements and training needs. Such reviews can provide management and the board with assurance over the hospitals IT security arrangements and assists them in meeting their monitoring obligations.
Sixty-four of the 87 public hospitals (74 per cent) had not had an internal audit of their IT security arrangements over the past three years. Specifically 18 of the 33 metropolitan and regional hospitals (55 per cent) and 46 of 54 rural hospitals (85 per cent) had not commissioned an internal audit review over IT security in the past three years.
5.5 Other
5.5.1 Ombudsman's report on corrupt procurement conduct
The Victorian Ombudsman tabled a report on Corrupt conduct by public officers in procurement in June 2011. The report identified that some Victorian public bodies had ordered items such as toner ink cartridges outside of the State Purchasing Contract. The supplier in question often charged substantially more for their cartridges and required a larger number of cartridges for each supply order. Often the people placing the orders were given personal benefits such as redeemable reward points at major retailers or electronic goods.
The Victorian Auditor-General's Office subsequently reviewed whether public hospitals and their subsidiaries had exposure to the supplier, that had operated under six different names.
As at 30 June 2011, 10 of 87 public hospitals (11 per cent) had the identified supplier in their records. However, none had entered into a transaction with the supplier in the financial year ended 30 June 2011. Of these hospitals, seven of the 10 stated that the entity had been removed from their purchasing system. It was positive to note that at nine of the 10 hospitals (90 per cent), management was aware of the Ombudsman's report.
Recommendations
That public hospitals:- assess their policies and practices against the identified general internal control weaknesses to determine the adequacy of their controls, and whether they are operating reliably, efficiently and effectively
- develop comprehensive policies and procedures for procurement and tendering which are appropriately approved and subject to regular review
- develop comprehensive policies and procedures over information technology system security which are approved at board level and subject to regular review
- develop an information security classification policy that outlines criteria for assigning security classifications to information and the required security controls for each classification
- undertake periodic assessments of the adequacy of, and compliance with, information technology security requirements.
Appendix A. Glossary
Accountability
Responsibility of public sector entities to achieve their objectives, with regard to reliability of financial reporting effectiveness and efficiency of operations, compliance with applicable laws, and reporting to interested parties.
Asset
A resource controlled by an entity as a result of past events, and from which future economic benefits are expected to flow to the entity.
Asset useful life
An asset's useful life is the period over which it is expected to provide the entity with economic benefits. Depending on the nature of the asset, the useful life can be expressed in terms of time or output.
Auditor's opinion
Positive written expression within a specified framework indicating the auditor's overall conclusion on the financial report based on audit evidence obtained.
Benchmarking
The process of assessing business outcomes against comparable measures to evaluate performance. This provides an objective reference point from which management can establish their own targets and monitor trends.
Capital grant
Government funding given to an agency for the purpose of acquisition of capital assets such as buildings, land or equipment.
Depreciation
The apportionment of the capital value of an asset over its expected useful life. The amount of depreciation expensed takes account of normal usage, obsolescence or the passage of time.
Emphasis of matter
In certain circumstances, an auditor's opinion is modified by adding an emphasis of matter paragraph to highlight a matter affecting the financial report which is included in a note to the financial statements. The addition of such an emphasis of matter paragraph does not affect the auditor's opinion.
Employee leave liabilities
The liability recognised for employees accrued service entitlements, including all accrued costs related to employment comprising of wages and salaries, leave entitlements, redundancy payments and superannuation contributions.
Entity
Is a body whether corporate or unincorporated that has a public function to exercise on behalf of the state or is wholly owned by the state, including departments, statutory authorities, statutory corporations and government business enterprises.
Equity or net assets
Residual interest in the assets of an entity after deduction of its liabilities.
Expense
Outflows or other depletions of economic benefits in the form of liabilities incurred or depletion of assets of the entity, other than those relating to contributions by owners, that result in a decrease in equity during the reporting period.
Fair value
The amount for which a financial or non-financial asset could be exchanged between knowledgeable and willing parties in an arms-length transaction.
Financial delegation
A schedule that specifies the level of approval required for each transaction category to facilitate the execution of functions necessary for the efficient operation of the entity.
Financial report
Structured representation of the financial information, which usually includes accompanying notes, derived from accounting records and intended to communicate an entity's economic resources or obligations at a point in time or the changes therein for a period in accordance with a financial reporting framework.
Financial sustainability
An entity's ability to manage financial resources so it can meet spending commitments, both at present and into the future.
Financial year
A period of 12 months for which a financial report is prepared ending on 30 June each year for public hospitals and associated entities.
Going concern
An entity which is expected to be able to pay its debts as and when they fall due, and continue in operation without any intention or necessity to liquidate or otherwise wind up its operations.
Governance
The control arrangements in place at an entity that are used to govern and monitor its activities, in order to achieve its strategic and operational goals. It includes the oversight role of the board of management at public hospitals.
Internal control
A process effected by an entity's structure, work and authority flows, people and management information systems, designed to assist the entity accomplish specific goals and objectives. Internal control is a means by which an entity's resources are directed, monitored and measured. It plays an important role in preventing and detecting error and fraud and protecting the entity's resources.
Joint venture
A contractual agreement joining together two or more parties for the purpose of executing a particular business undertaking. All parties agree to share in the profits and losses of the enterprise.
Liability
A present obligation of the entity, arising from past events, the settlement of which is expected to result in an outflow of resources from the entity.
Masterfile
A database of entries containing data that does not often change (for example, address and bank account details).
Materiality
Information is material if its omission or misstatement could influence the economic decisions of users taken on the basis of the financial report. Materiality depends on the size of the item or error judged in the particular circumstances of its omission or misstatement. Thus, materiality provides a threshold or cut-off point rather than being a primary qualitative characteristic which information must have if it is to be useful.
Material entity
Material entities represent those entities that are collectively deemed to have a significant effect on the transactions and balances reported in the state's annual financial report.
The selection of these entities follows a detailed analysis of the financial operations of all controlled entities and takes into account any major risk factors that are attached to specific entities or portfolios.
Modified audit report
The types of modified audit reports and the basis for issuing these reports are as follows:
- A 'qualified opinion' is expressed when the auditor concludes that an unqualified opinion cannot be expressed due to a disagreement with management, a conflict between applicable financial reporting frameworks or a scope limitation; however, the effect is not so material and pervasive as to require an adverse opinion or a disclaimer of opinion. The qualified opinion is expressed as being 'except for' the effects of the matter to which the qualification relates.
- A 'disclaimer of opinion' is expressed when a limitation of scope of the auditor's work exists and the possible effect of the limitation on scope is so material and pervasive that the auditor has not been able to obtain sufficient appropriate audit evidence and accordingly is unable to express an opinion on the financial statements.
- An 'emphasis of matter' is expressed in certain circumstances to draw attention to, or emphasise, a matter that is included in the note to the financial statements that is relevant to the users of the auditor's report but is not of such nature that it affects the auditor's opinion (i.e. the auditor's opinion remains unmodified).
Net result
The net result is calculated by subtracting an entity's total expenses from total revenue, to show what the entity has earned or lost in a given period of time.
Premier's Circular
Department of Premier and Cabinet announcements are published as Ministerial Memoranda and Department Circulars. A Memorandum is issued by the Premier to all ministers to communicate whole-of-government administrative policies.
Procurement
Procurement is the acquisition of goods and or services. It is favourable that the goods or services are appropriate and that they are procured at the best possible cost to meet the needs of the purchaser in terms of quality and quantity, time, and location.
Public sector entity
A department; a public hospital; a statutory body; an entity controlled by one, or more than one, department, public hospital or statutory body; or an entity controlled by an entity that is a public sector entity.
Qualification
A qualification is issued when the auditor concludes that an unqualified opinion cannot be expressed due to one of the following reasons:
- disagreement with those charged with governance
- conflict between applicable financial reporting frameworks
- limitation of scope.
A qualified opinion shall be expressed as being except for the effects of the matter to which the qualification relates.
Revenue
Inflow of funds, at public hospitals it is generally in the form of grants, private fees and charges. Can also include other savings in outflows of service potential, or future economic benefits in the form of increases in assets or reductions in liabilities of the entity.
Risk
The chance of a negative impact on the objectives, outputs or outcomes of the entity.
Stakeholder
A person, group, or organization that has direct or indirect stake in an organization because it can affect or be affected by the organization's actions, objectives, and policies.
Tender
A sealed bid or offer document submitted in response to a request for tenders and containing detailed information on requirements and terms associated with a potential contract.
Unqualified audit opinion
An unqualified audit opinion is an expression by the auditor stating that the entity has followed all accounting rules appropriately and that the financial reports are an accurate representation of the entity's financial condition. Also referred to as a clear audit opinion.
Wage on-costs
The additional costs incurred as a consequence of employing personnel. Examples of wage on-costs include workcover, payroll tax and superannuation contributions.
Appendix B. Completed audit listing
Metropolitan hospitals and associated entities
Audit type |
Financial report |
Finalised within statutory time frame |
||||
|---|---|---|---|---|---|---|
Entity |
FMA |
Non-FMA |
Clear opinion issued |
Auditor-General's report signed |
Met |
Not met |
COMPLETED AUDITS WITHIN 30 JUNE 2011 BALANCE DATES |
||||||
Alfred Health |
Yes |
Yes |
12 Aug 2011 |
Yes |
||
Austin Health |
Yes |
Yes |
17 Aug 2011 |
Yes |
||
Calvary Health Care Bethlehem Ltd |
C |
Yes |
19 Aug 2011 |
Yes |
||
Dental Health Services Victoria |
Yes |
Yes |
17 Aug 2011 |
Yes |
||
Eastern Health |
Yes |
Yes |
11 Aug 2011 |
Yes |
||
Melbourne Health |
Yes |
Yes |
15 Aug 2011 |
Yes |
||
Evivar Medical Pty Ltd(a) |
C |
NA |
NA |
Yes |
||
Royal Melbourne Hospital Foundation Ltd |
C |
Yes |
29 July 2011 |
Yes |
||
Mercy Public Hospitals Inc |
Yes |
Yes |
26 Aug 2011 |
Yes |
||
Northern Health |
Yes |
Yes |
23 Aug 2011 |
Yes |
||
Northern Health Research, Training and Equipment Foundation Limited |
C |
Yes |
23 Aug 2011 |
Yes |
||
Northern Health Research, Training and Equipment Foundation Trust |
O |
Yes |
23 Aug 2011 |
Yes |
||
Peninsula Health |
Yes |
Yes |
26 Aug 2011 |
Yes |
||
Peter MacCallum Cancer Centre |
Yes |
Yes |
26 Aug 2011 |
Yes |
||
Cell Therapies Pty Ltd |
C |
Yes |
17 Aug 2011 |
Yes |
||
Peter MacCallum Cancer Foundation |
Yes |
Yes |
24 Aug 2011 |
Yes |
||
Peter MacCallum Cancer Foundation Ltd |
C |
Yes |
24 Aug 2011 |
Yes |
||
Queen Elizabeth Centre |
Yes |
Yes |
31 Aug 2011 |
Yes |
||
Royal Children's Hospital |
Yes |
Yes |
23 Aug 2011 |
Yes |
||
Communities That Care Limited |
C |
Yes |
11 Aug 2011 |
Yes |
||
Royal Children's Hospital Education Institute Ltd |
C |
Yes |
3 Aug 2011 |
Yes |
||
Royal Children's Hospital Foundation Trust Funds |
O |
Yes |
9 Aug 2011 |
Yes |
||
Royal Victoria Eye and Ear Hospital |
Yes |
Yes |
24 Aug 2011 |
Yes |
||
Royal Women's Hospital |
Yes |
Yes |
26 Aug 2011 |
Yes |
||
Royal Women's Hospital Foundation Limited |
C |
Yes |
26 Aug 2011 |
Yes |
||
Royal Women's Hospital Trust Funds |
C |
Yes |
26 Aug 2011 |
Yes |
||
Southern Health |
Yes |
Yes |
12 Aug 2011 |
Yes |
||
Kitaya Holdings Pty Ltd |
C |
Yes |
12 Aug 2011 |
Yes |
||
St. Vincent's Hospital (Melbourne) Limited |
C |
Yes |
26 Aug 2011 |
Yes |
||
Tweddle Child and Family Health Services |
Yes |
Yes |
5 Sep 2011 |
Yes |
||
Victoria Comprehensive Cancer Centre |
O |
Yes |
6 Oct 2011 |
Yes |
||
Victoria Comprehensive Cancer Centre Ltd |
C |
Yes |
6 Oct 2011 |
Yes |
||
Western Health |
Yes |
Yes |
17 Aug 2011 |
Yes |
||
2010–11 Total number of entities = 33 |
17 |
16 |
32 |
1 |
||
Per cent |
97 |
3 |
||||
2009–10 Total number of entities = 33 |
17 |
16 |
|
33 |
0 |
|
Per cent |
100 |
0 |
||||
(a) At the date of this report, the financial audit of the entity was not complete.
Note: Non-FMA audit types: C – Corporations Act 2001 and O – other reporting framework.
Source: Victorian Auditor-General's Office.
Regional hospitals and associated entities
Audit type |
Financial report |
Finalised within statutory time frame |
||||
|---|---|---|---|---|---|---|
Entity |
FMA |
Non-FMA |
Clear opinion issued |
Auditor-General's report signed |
Met |
Not met |
COMPLETED AUDITS WITHIN 30 JUNE 2011 BALANCE DATES |
||||||
Albury Wodonga Health |
Yes |
Yes |
29 Aug 2011 |
Yes |
||
Bairnsdale Regional Health Service |
Yes |
Yes |
18 Aug 2011 |
Yes |
||
Ballarat Health Services |
Yes |
Yes |
24 Aug 2011 |
Yes |
||
Barwon Health |
Yes |
Yes |
8 Aug 2011 |
Yes |
||
Bendigo Health Care Group |
Yes |
Yes |
31 Aug 2011 |
Yes |
||
Central Gippsland Health Service |
Yes |
Yes |
26 Aug 2011 |
Yes |
||
Echuca Regional Health |
Yes |
Yes |
25 Aug 2011 |
Yes |
||
Echuca Regional Health Foundation |
O |
Yes |
31 Aug 2011 |
Yes |
||
Echuca Regional Health Foundation Limited |
C |
Yes |
31 Aug 2011 |
Yes |
||
Goulburn Valley Health |
Yes |
Yes |
29 Aug 2011 |
Yes |
||
Latrobe Regional Hospital |
Yes |
Yes |
23 Aug 2011 |
Yes |
||
Northeast Health Wangaratta |
Yes |
Yes |
29 Aug 2011 |
Yes |
||
South West Healthcare |
Yes |
Yes |
22 Aug 2011 |
Yes |
||
Swan Hill District Hospital |
Yes |
Yes |
24 Aug 2011 |
Yes |
||
West Wimmera Health Service |
Yes |
Yes |
29 Aug 2011 |
Yes |
||
Western District Health Service |
Yes |
Yes |
12 Aug 2011 |
Yes |
||
Wimmera Health Care Group |
Yes |
Yes |
29 Aug 2011 |
Yes |
||
2010–11 Total number of entities = 17 |
15 |
2 |
17 |
0 |
||
Per cent |
100 |
0 |
||||
2009–10 Total number of entities = 17 |
15 |
2 |
17 |
0 |
||
|
Per cent |
100 |
0 |
|||
Note: Non-FMA audit types: C – Corporations Act 2001 and O – other reporting framework.
Source: Victorian Auditor-General's Office.
Rural hospitals and associated entities
Audit type |
Financial report |
Finalised within statutory time frame |
||||
|---|---|---|---|---|---|---|
Entity |
FMA |
Non-FMA |
Clear opinion issued |
Auditor-General's report signed |
Met |
Not met |
COMPLETED AUDITS WITHIN 30 JUNE 2011 BALANCE DATES |
||||||
Alexandra District Hospital |
Yes |
Yes |
22 Aug 2011 |
Yes |
||
Alpine Health |
Yes |
Yes |
31 Aug 2011 |
Yes |
||
Bass Coast Regional Health |
Yes |
Yes |
26 Aug 2011 |
Yes |
||
Beaufort and Skipton Health Services |
Yes |
Yes |
31 Aug 2011 |
Yes |
||
Beaufort and Skipton Health Services Foundation Ltd |
C |
Yes |
31 Aug 2011 |
Yes |
||
Beechworth Health Service |
Yes |
Yes |
25 Aug 2011 |
Yes |
||
Benalla and District Memorial Hospital |
Yes |
Yes |
24 Aug 2011 |
Yes |
||
Boort District Hospital |
Yes |
Yes |
30 Aug 2011 |
Yes |
||
Casterton Memorial Hospital |
Yes |
Yes |
19 Aug 2011 |
Yes |
||
Castlemaine Health |
Yes |
Yes |
31 Aug 2011 |
Yes |
||
Cobram District Hospital |
Yes |
Yes |
31 Aug 2011 |
Yes |
||
Cobram District Health Services Foundation |
O |
Yes |
31 Aug 2011 |
Yes |
||
Cohuna District Hospital |
Yes |
Yes |
26 Aug 2011 |
Yes |
||
Cohuna Community Nursing Home Inc. |
Yes |
Yes |
26 Aug 2011 |
Yes |
||
Colac Area Health |
Yes |
Yes |
31 Aug 2011 |
Yes |
||
Djerriwarrh Health Services |
Yes |
Yes |
29 Aug 2011 |
Yes |
||
Dunmunkle Health Services |
Yes |
Yes |
23 Aug 2011 |
Yes |
||
East Grampians Health Service |
Yes |
Yes |
30 Aug 2011 |
Yes |
||
East Grampians Health Service Foundation |
Yes |
Yes |
31 Aug 2011 |
Yes |
||
East Wimmera Health Service |
Yes |
Yes |
26 Aug 2011 |
Yes |
||
Edenhope and District Hospital |
Yes |
Yes |
26 Aug 2011 |
Yes |
||
Gippsland Southern Health Service |
Yes |
Yes |
26 Aug 2011 |
Yes |
||
Heathcote Health |
Yes |
Yes |
25 Aug 2011 |
Yes |
||
Hepburn Health Service |
Yes |
Yes |
26 Aug 2011 |
Yes |
||
Hesse Rural Health Service |
Yes |
Yes |
30 Aug 2011 |
Yes |
||
Winchelsea Hostel and Nursing Home Society |
O |
Yes |
30 Aug 2011 |
Yes |
||
Heywood Rural Health |
Yes |
Yes |
24 Aug 2011 |
Yes |
||
Inglewood and Districts Health Service |
Yes |
Yes |
29 Aug 2011 |
Yes |
||
Kerang District Health |
Yes |
Yes |
24 Aug 2011 |
Yes |
||
Kilmore and District Hospital |
Yes |
Yes |
25 Aug 2011 |
Yes |
||
Kooweerup Regional Health Service |
Yes |
Yes |
26 Aug 2011 |
Yes |
||
Kyabram and District Health Service |
Yes |
Yes |
26 Sep 2011 |
Yes |
||
Kyneton District Health Service |
Yes |
Yes |
31 Aug 2011 |
Yes |
||
LMHA Network Ltd |
C |
Yes |
11 Oct 2011 |
Yes |
||
Lorne Community Hospital |
Yes |
Yes |
23 Aug 2011 |
Yes |
||
Maldon Hospital |
Yes |
Yes |
30 Aug 2011 |
Yes |
||
Mallee Track Health and Community Services |
Yes |
Yes |
31 Aug 2011 |
Yes |
||
Mansfield District Hospital |
Yes |
Yes |
19 Aug 2011 |
Yes |
||
Maryborough District Health Service |
Yes |
Yes |
30 Aug 2011 |
Yes |
||
Moyne Health Services |
Yes |
Yes |
23 Aug 2011 |
Yes |
||
Moyne Health Services Inc. |
A |
Yes |
19 Aug 2011 |
Yes |
||
Nathalia District Hospital |
Yes |
Yes |
26 Aug 2011 |
Yes |
||
Numurkah District Health Service |
Yes |
Yes |
30 Aug 2011 |
Yes |
||
Omeo District Hospital |
Yes |
Yes |
30 Aug 2011 |
Yes |
||
Orbost Regional Health |
Yes |
Yes |
29 Aug 2011 |
Yes |
||
Otway Health & Community |
Yes |
Yes |
22 Aug 2011 |
Yes |
||
Portland District Health |
Yes |
Yes |
18 Aug 2011 |
Yes |
||
Robinvale District Health Service |
Yes |
Yes |
30 Aug 2011 |
Yes |
||
Rochester and Elmore District Health Service |
Yes |
Yes |
31 Aug 2011 |
Yes |
||
Rural Northwest Health |
Yes |
Yes |
30 Aug 2011 |
Yes |
||
Seymour District Memorial Hospital |
Yes |
Yes |
29 Aug 2011 |
Yes |
||
South Gippsland Hospital |
Yes |
Yes |
29 Aug 2011 |
Yes |
||
Stawell Regional Health |
Yes |
Yes |
31 Aug 2011 |
Yes |
||
Stawell District Hospital Foundation |
Yes |
Yes |
31 Aug 2011 |
Yes |
||
Tallangatta Health Service |
Yes |
Yes |
30 Aug 2011 |
Yes |
||
Terang and Mortlake Health Service |
Yes |
Yes |
19 Aug 2011 |
Yes |
||
Timboon and District Health Service |
Yes |
Yes |
19 Aug 2011 |
Yes |
||
Upper Murray Health and Community Services |
Yes |
Yes |
24 Aug 2011 |
Yes |
||
West Gippsland Healthcare Group |
Yes |
Yes |
26 Aug 2011 |
Yes |
||
Yarram and District Health Service |
Yes |
Yes |
31 Aug 2011 |
Yes |
||
Yarrawonga District Health Service |
Yes |
Yes |
30 Aug 2011 |
Yes |
||
Yea and District Memorial Hospital |
Yes |
Yes |
31 Aug 2011 |
Yes |
||
2010–11 Total number of entities = 62 |
57 |
5 |
62 |
0 |
||
Per cent |
100 |
0 |
||||
2009–10 Total number of entities = 62 |
57 |
5 |
62 |
0 |
||
Per cent |
100 |
0 |
||||
Note: Non-FMA audit types: A – Associations Incorporation Act 1981, C – Corporations Act 2001 and O – other reporting framework.
Source: Victorian Auditor-General's Office.
Appendix C. Financial sustainability
Financial sustainability risk assessment criteria
The financial sustainability of public hospitals has been assessed using the risk assessment criteria outlined in Figure C1.
Figure C1
Financial sustainability indicators—risk assessment criteria
Risk |
Underlying result |
Liquidity |
Average number of days cash available |
Self-financing |
Capital replacement |
|---|---|---|---|---|---|
High |
Negative 10% or less |
Equal to or less than 0.7 |
Equal to or less than 15 days |
Less than 10% |
Less than 1.0 |
Insufficient revenue is being generated to fund operations and asset renewal. |
Insufficient current assets to cover liabilities. |
Insufficient cash is being generated to fund operations. |
Insufficient cash from operations to fund new assets and asset renewal. |
Spending on capital works has not kept pace with consumption of assets. |
|
Medium |
Negative 10% to 0 |
0.7–1.0 |
15–30 days |
10–20 % |
1.0–1.5 |
A risk of long-term run down to cash reserves and inability to fund asset renewals. |
Need for caution with cash flow, as issues could arise with meeting obligations as they fall due. |
May indicate insufficient cash is available to fund operations. |
May not be generating sufficient cash from operations to fund new assets. |
May indicate spending on asset renewal is insufficient. |
|
Low |
More than 0 |
More than 1.0 |
More than 30 days |
20% or more |
More than 1.5 |
Generating surpluses consistently. |
No immediate issues with repaying short-term liabilities as they fall due. |
Low risk of insufficient cash available to fund operations. |
Generating enough cash from operations to fund assets. |
Low risk of insufficient spending on asset renewal. |
Source: Victorian Auditor-General's Office.
The overall financial sustainability risk assessment is calculated using the ratings determined for each indicator as outlined in Figure C1. This assessment is performed at the sector level, at the metropolitan, regional and rural category level, and at the individual hospital level.
Figure C2
Overall financial sustainability risk assessment
Red text |
High risk of shorter-term and immediate sustainability concerns indicated either by:
|
Amber text |
Medium risk of longer-term sustainability concerns indicated either by:
|
Green text |
Low risk of financial sustainability concerns—there are no high-risk indictors. |
 |
A deteriorating trend |
 |
No substantial trend |
 |
An improving trend |
Note: Red financial sustainability indicator outcomes represent a high-risk assessment based on the criteria in Figure 3E.
Source: Victorian Auditor-General's Office.
To be financially sustainable, hospitals must be able to meet their short-term financial obligations, and maintain some excess capacity to finance future capital and infrastructure development. As detailed in Figure C2, shorter-term and immediate sustainability concerns are assessed as high risk, and longer-term sustainability concerns are assessed as medium risk
Metropolitan hospitals
Figure C3
Underlying result 2007–2011
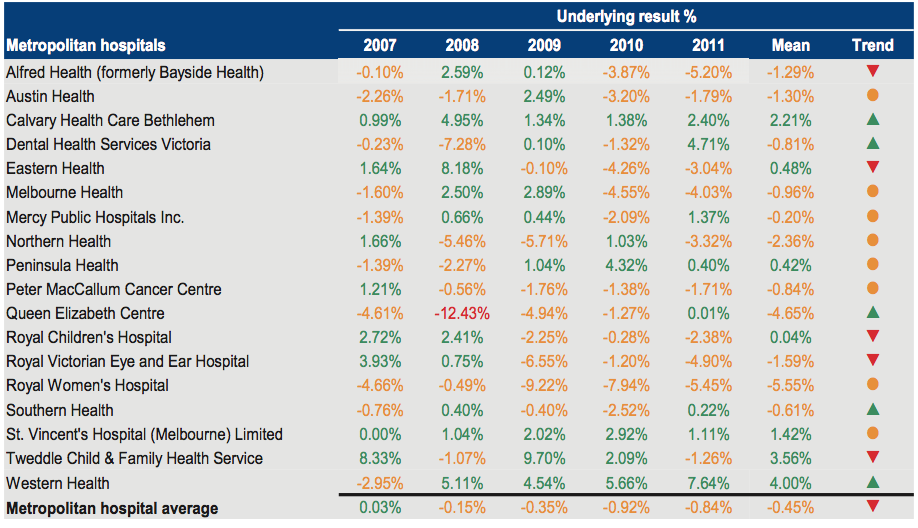
Source: Victorian Auditor-General's Office.
Figure C4
Liquidity 2007–2011
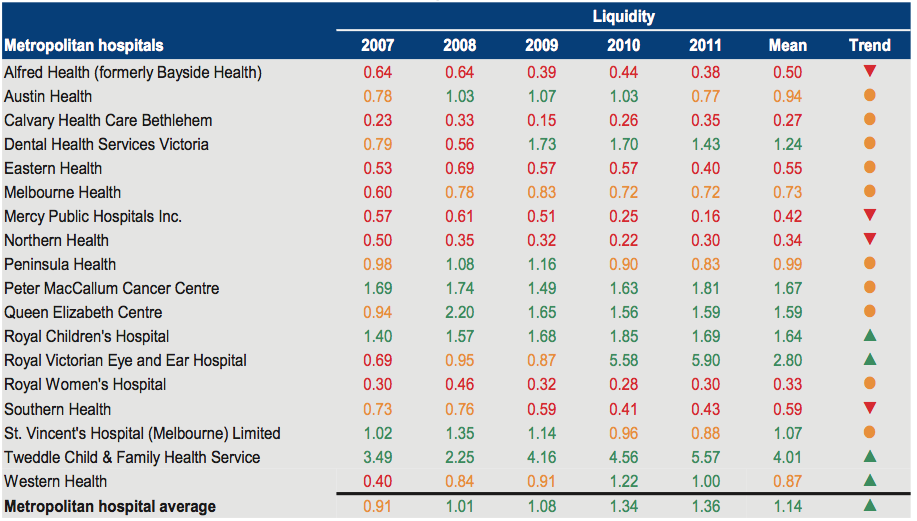
Source: Victorian Auditor-General's Office.
Figure C5
Average number of days cash available 2007–2011
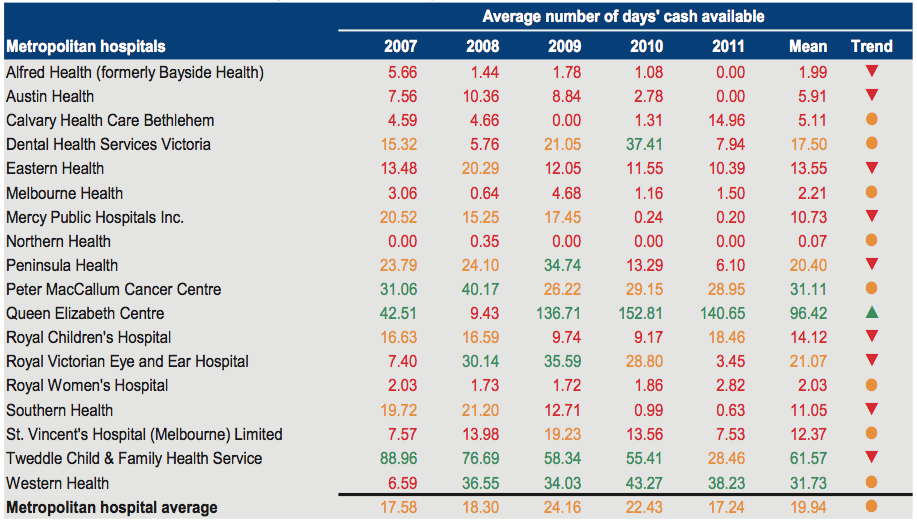
Source: Victorian Auditor-General's Office.
Figure C6
Self-financing 2007–2011
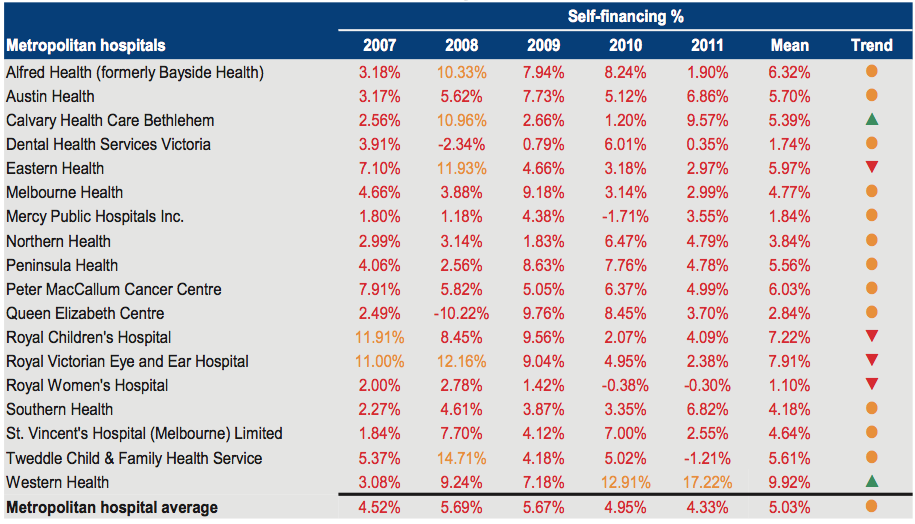
Source: Victorian Auditor-General's Office.
Figure C7
Capital replacement 2007–2011
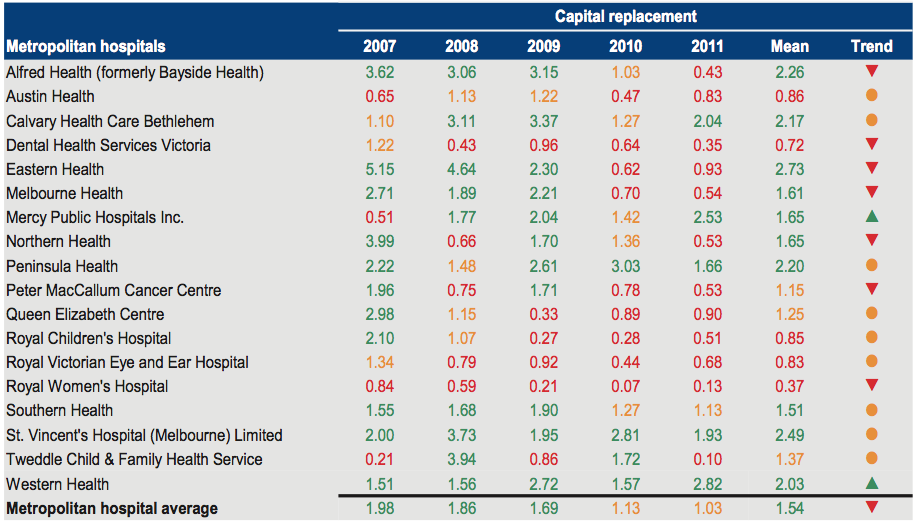
Source: Victorian Auditor-General's Office.
Regional hospitals
Figure
C8
Underlying result 2007–2011
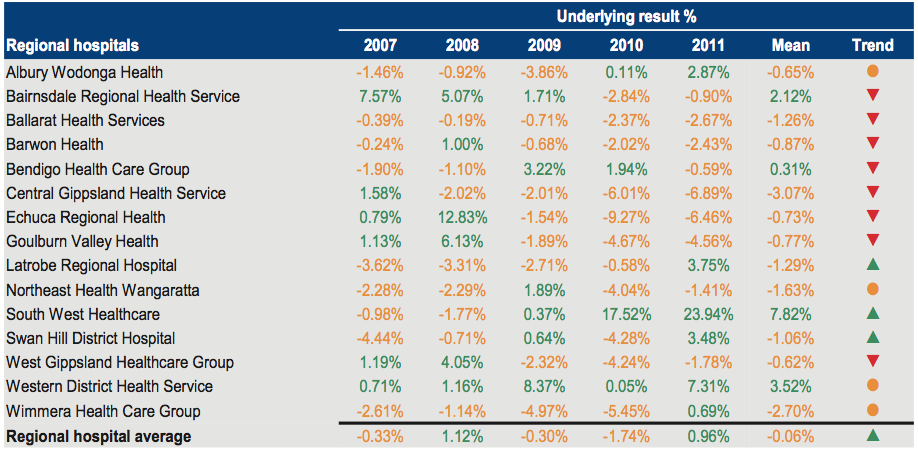
Source: Victorian Auditor-General's Office.
Figure C9
Liquidity 2007–2011
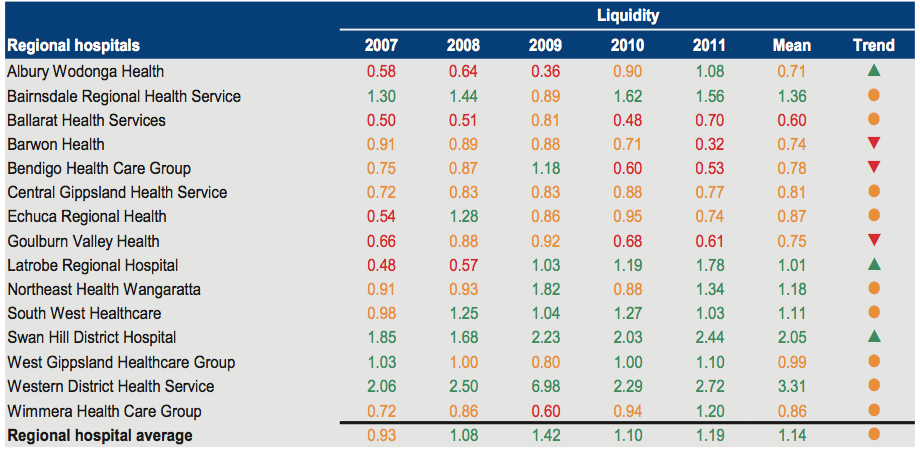
Source: Victorian Auditor-General's Office.
Figure C10
Average number of days cash available 2007–2011
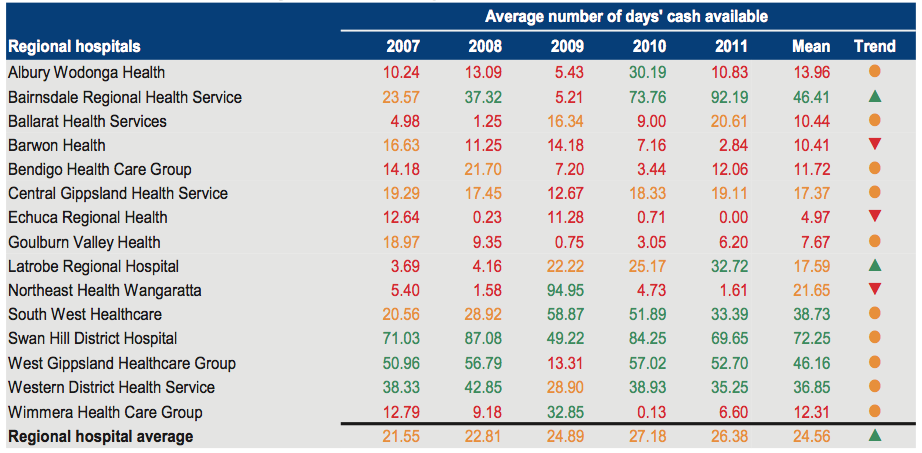
Source: Victorian Auditor-General's Office.
Figure C11
Self-financing 2007–2011
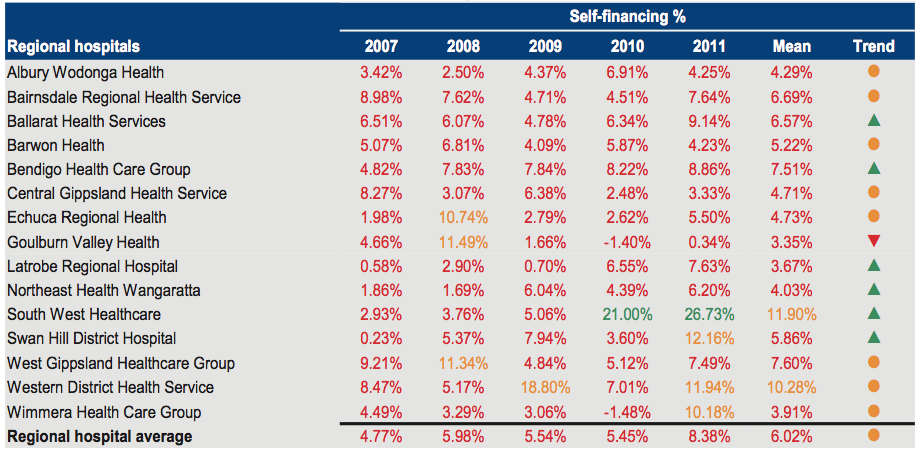
Source: Victorian Auditor-General's Office.
Figure C12
Capital replacement 2007–2011
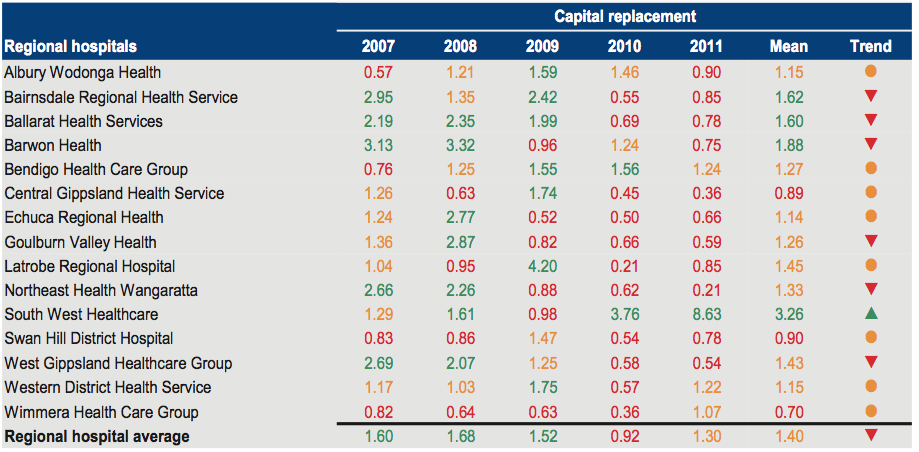
Source: Victorian Auditor-General's Office.
Rural hospitals
Figure C13
Underlying result 2007–2011
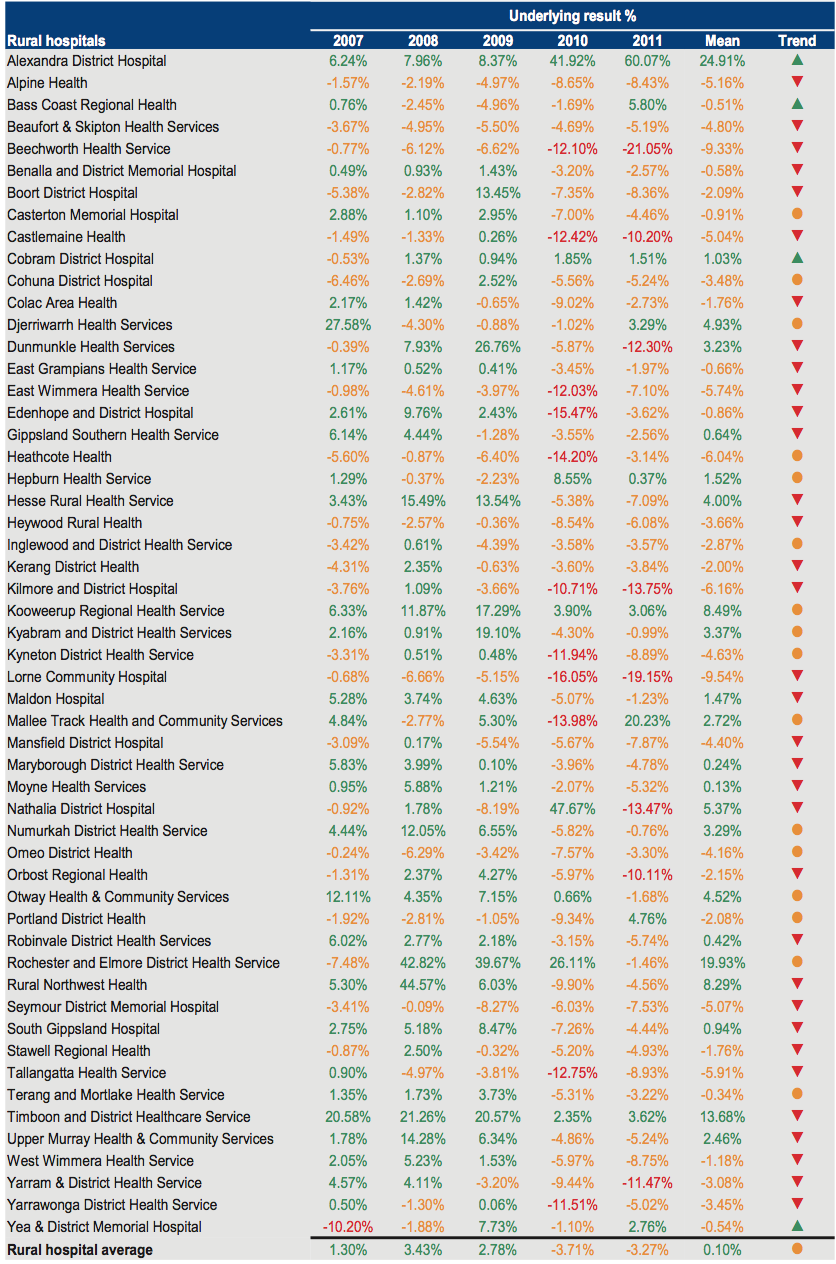
Source: Victorian Auditor-General's Office.
Figure C14
Liquidity 2007–2011
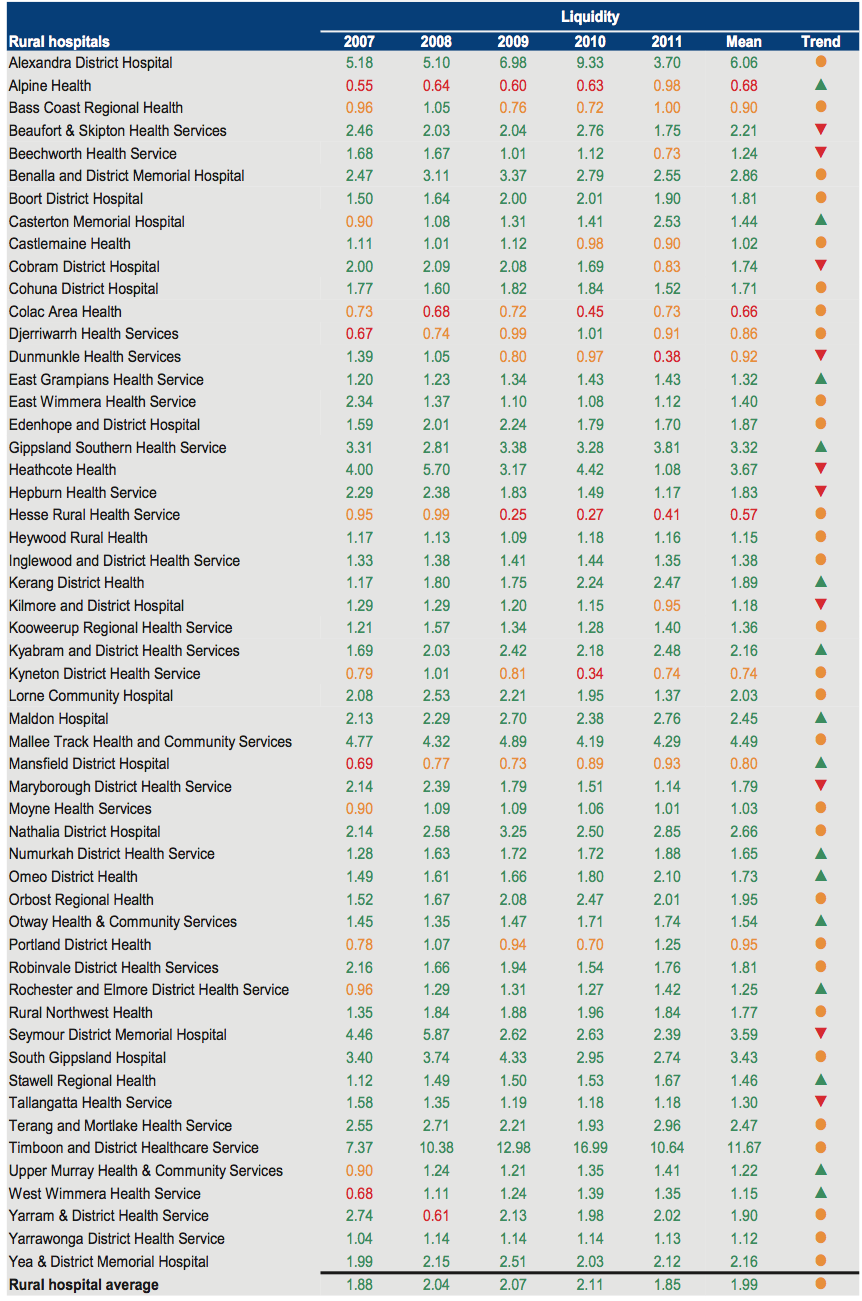
Source: Victorian Auditor-General's Office.
Figure C15
Average number of days cash available 2007–2011
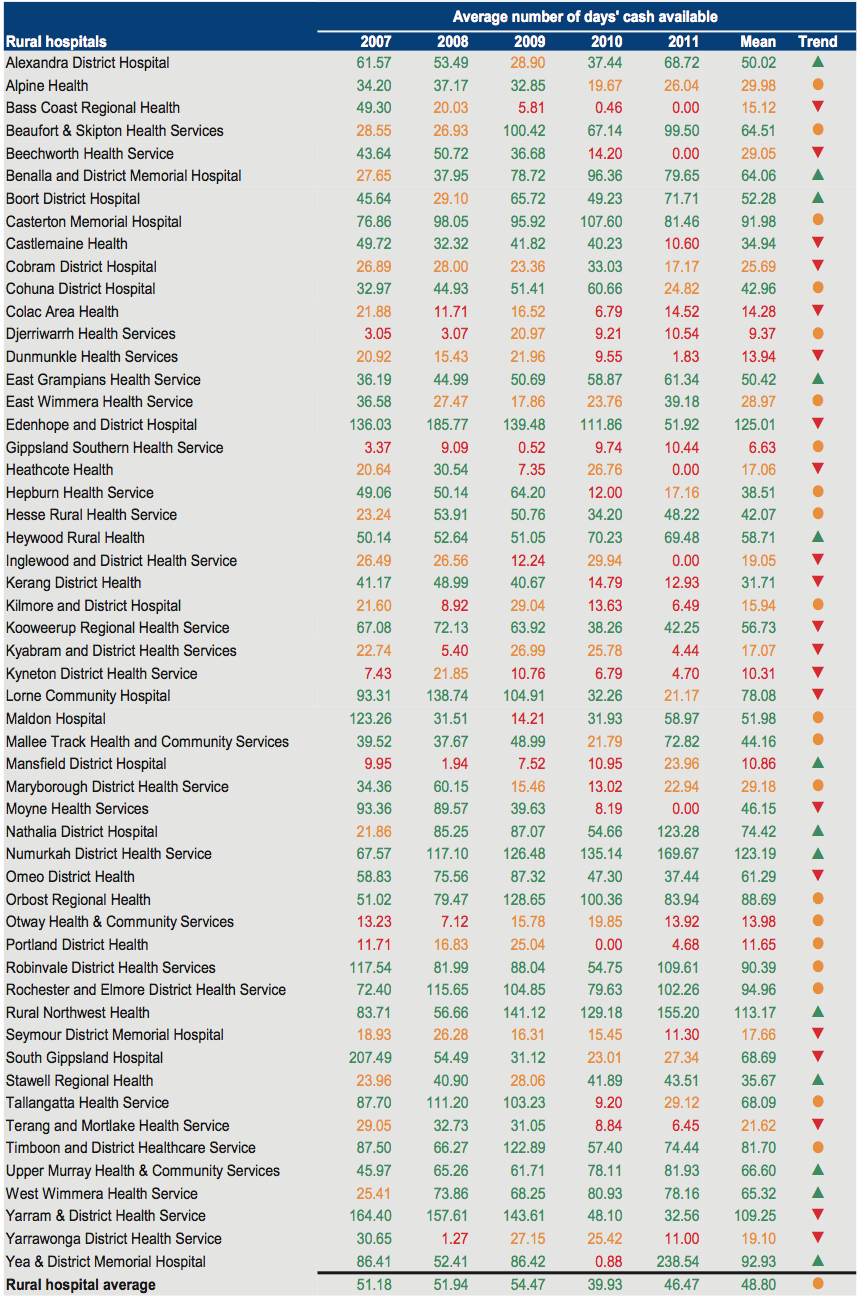
Source: Victorian Auditor-General's Office.
Figure C16
Self-financing 2007–2011
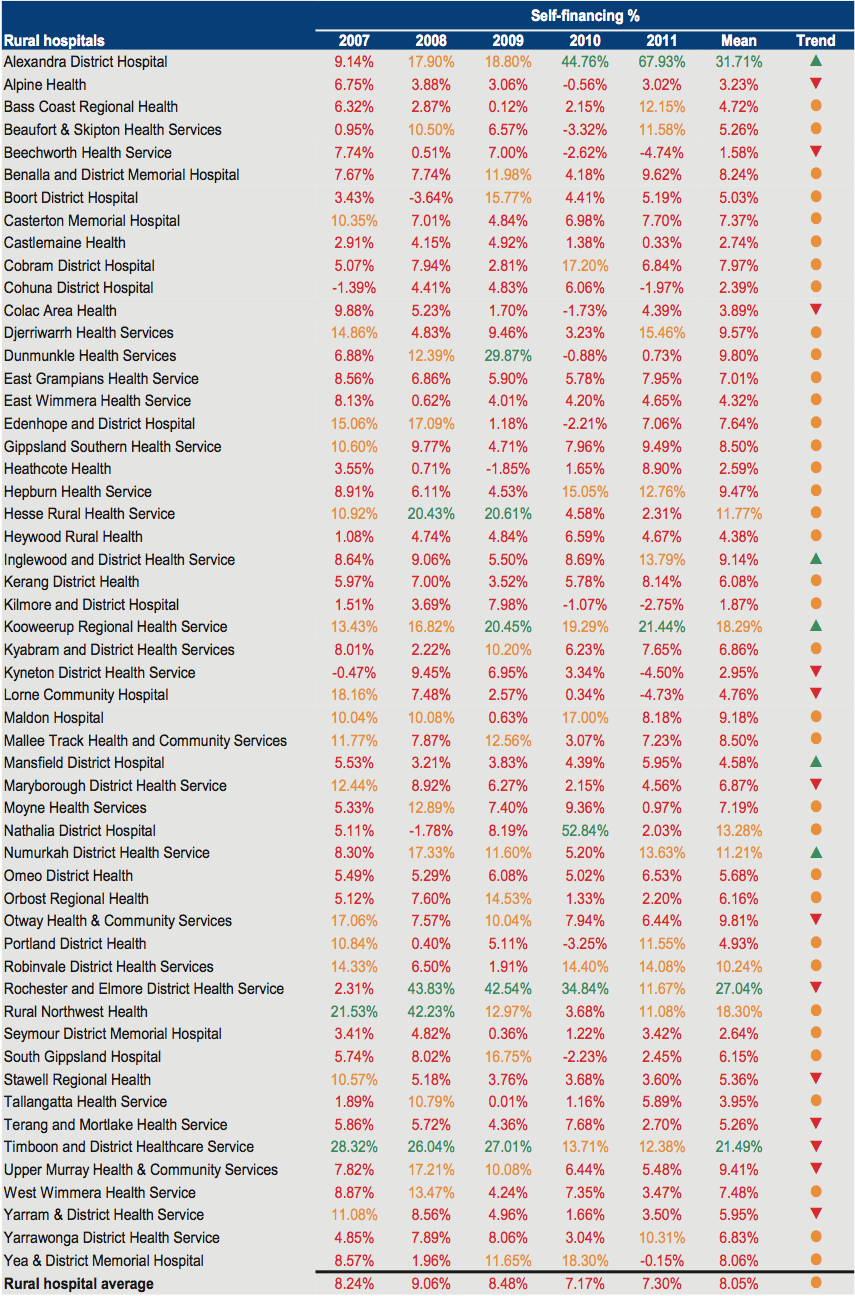
Source: Victorian Auditor-General's Office.
Figure C17
Capital replacement 2007–2011
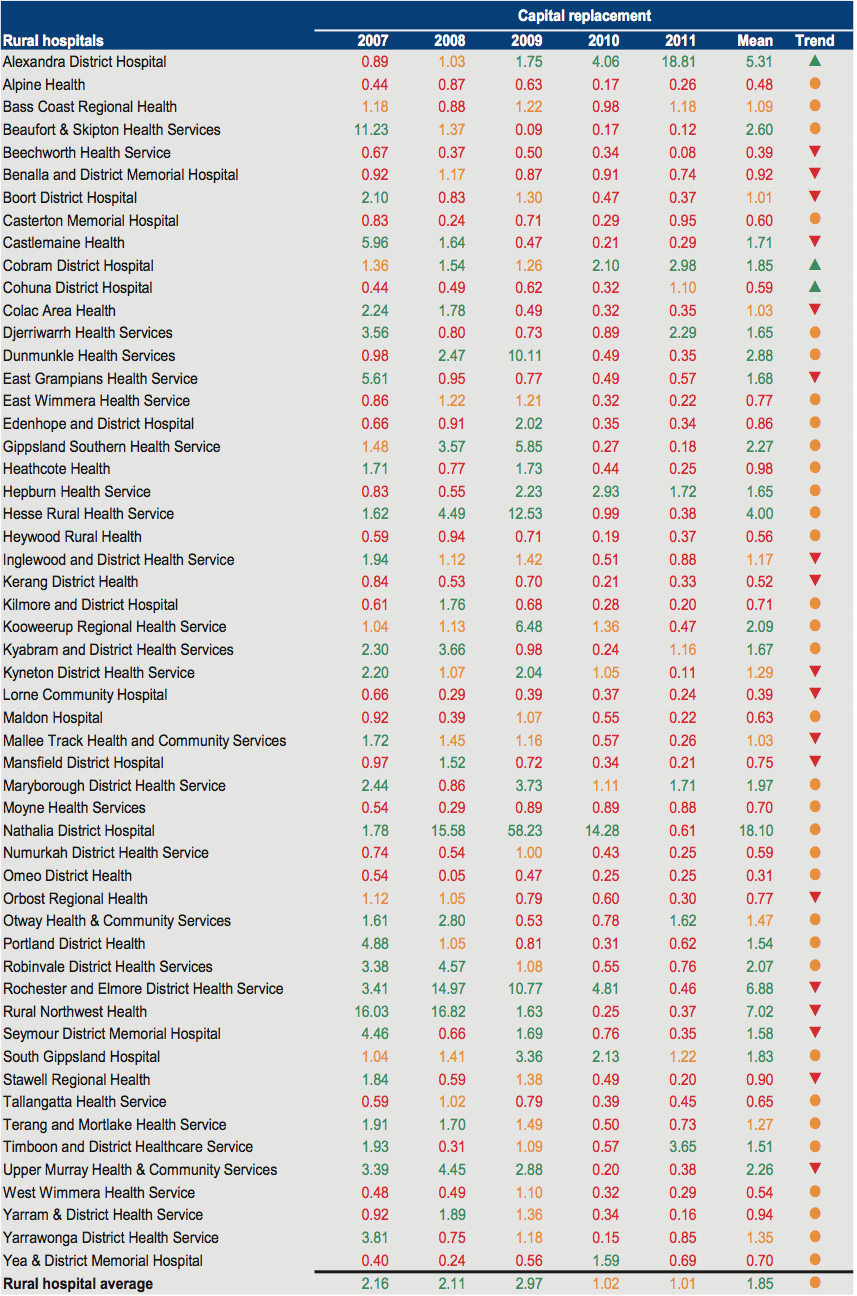
Source: Victorian Auditor-General's Office.
Appendix D. Audit Act 1994 section 16—submissions and comments
Introduction
In accordance with section 16A and 16(3) of the Audit Act 1994 a copy of this report, or relevant extracts from the report, was provided to the Department of Health with a request for submissions or comments.
The submissions and comments provided are not subject to audit nor the evidentiary standards required to reach an audit conclusion. Responsibility for the accuracy, fairness and balance of those comments rests solely with the agency head.