Responses to Performance Engagement Recommendations: Annual Status Update 2024
Review snapshot
Why we did this review
Our performance engagements assess if government agencies are effectively and efficiently meeting their objectives, using resources economically and complying with legislation.
They often identify opportunities for improvement, which are reflected in our recommendations.
There is no legislative requirement for audited agencies to accept, complete or publicly report on our recommendations.
We conduct this annual review to monitor how agencies address our findings. This makes agencies’ responses to our recommendations more transparent to the Victorian public and parliamentarians.
Key background information
Source: VAGO.
What we concluded
At this review, most agencies reported that they accept and are implementing our recommendations. Nothing has come to our attention to indicate that agencies are not implementing recommendations they have accepted.
Of the 1,645 recommendations from reports we tabled between July 2018 and June 2023, agencies had:
- still accepted 1,577 (96 per cent)
- completed 1,340 (85 per cent) of accepted recommendations
- taken a median of 13 months to complete them.
There are 237 accepted recommendations (15 per cent) that are unresolved. Agencies should complete these recommendations to mitigate the risks we found in their engagements.
What we examined
In this report, we looked at the status of recommendations we made between July 2018 and June 2023. Figure 1 shows the status of these recommendations in December 2023.
Figure 1: Recommendations we examined in this report

*'Not applicable' refers to recommendations that agencies accepted at the time the report was tabled that are no longer being implemented by agencies.
Source: VAGO.
Data dashboard
How agencies responded to our recommendations
We asked agencies to update us on their progress in implementing our recommendations.
Covered in this section:
- Most agencies accepted our recommendations
- Time agencies take to complete our recommendations
- Agencies’ target completion dates
- Unresolved recommendations made before July 2018
Performance engagements and recommendations
This review
We conduct performance engagements to assess if Victorian public sector agencies and their programs and services are operating effectively, economically, efficiently and in compliance with relevant Acts.
Our performance engagements include findings and recommendations to agencies about how they can improve their performance.
We give agencies the opportunity to respond to our recommendations before we table our reports, and we include their responses in our reports.
Agencies may accept each recommendation in full, in part, in principle or not at all. They may also state the actions they will take to address each recommendation and give a target date for completing them.
We conduct this review each year to ask agencies if they have progressed in completing the recommendations.
Agency
Any public service organisation that meets the definition of a public body under the Audit Act 1994. This includes government departments, local councils, health and education services, and other authorities.
Engagement
An engagement is a performance audit or review that we conduct.
Recommendation
Recommendations refer to the suggestions or advice we provide to an agency about how they can improve their performance.
Tabling date
The tabling date is the date a report is presented to Parliament.
Follow-up on
unresolved
recommendations
During this review, we followed up on unresolved recommendations. We asked agencies for updates on:
- their acceptance of the recommendation
- what actions they have taken in response to the recommendation
- if the recommendation is now complete
- when they completed the recommendation or their updated target date for completion.
This section summarises the recommendation updates agencies have given us.
For full detail on specific recommendations, see Appendix E or the accompanying dashboard published on our website.
Why this is important
We make recommendations to public sector agencies about their programs and services. We aim to help agencies address the root causes of poor performance.
Our recommendations, like the public sector, encompass a broad range of agencies and services. We tabled 94 reports between July 2018 and June 2023 that made 1,645 recommendations to 108 agencies. Government departments received just over half (55 per cent) of the recommendations, followed by local government, which received 27 per cent of the recommendations.
As there are no legislative requirements for agencies to accept, implement or publicly report on actions they have taken, this review provides an update to the public and parliamentarians. It may help them to hold agencies more accountable for how they implement our recommendations.
Further information
For more information about the scope of this review and our methods, please see Appendix C.
Consultation with agencies
When reaching our conclusions, we consulted with the reviewed agencies and considered their views. You can read their full responses in Appendix A.
Most agencies accepted our recommendations
Acceptance status
Before tabling a report, we ask audited agencies if they accept our recommendations. In this review, we asked agencies again so that we could see if there were any changes.
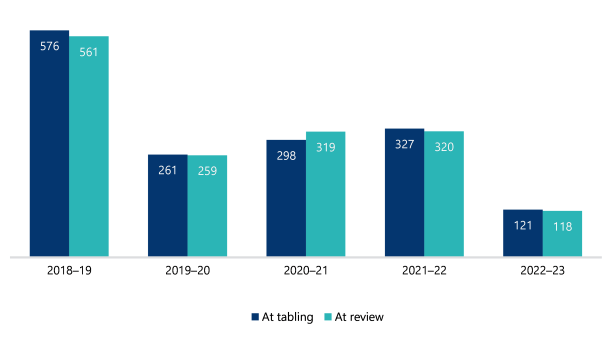
Of the 1,645 recommendations we made in our reports between July 2018 and June 2023, agencies accepted 1,583 (96 per cent) at time of tabling. At the time of this review, agencies told us that they still accepted 1,577 (96 per cent) (see Figure 2).
Figure 2: Acceptance of recommendations at the time of this review

Source: VAGO.
As shown in Figure 3 below, most agencies still accepted the recommendations at the time of this review as they did at tabling.
Agencies may change the acceptance status to ‘no’ or ‘not applicable’. Common reasons agencies gave for changing their acceptance status included:
- the recommendations are no longer relevant (circumstances may have changed or other work is underway that makes the recommendation no longer relevant)
- the agencies do not have the resources (time or budget) to implement the recommendations.
Figure 3: Number of recommendations accepted at the time of tabling and at the time of this review

Note: Agencies accepted more recommendations from 2020–21 at this review compared to at tabling. This was because agencies did not initially specify their acceptance status for some recommendations, but later accepted these recommendations at the time of review.
Source: VAGO.
Completion of accepted recommendations
We classify recommendations as complete when agencies attest to us that they have established processes to make sure that the recommended action is ongoing.
Agencies attested:
- they had completed 1,340 (85 per cent) of the 1,577 accepted recommendations
- 237 (15 per cent) of the 1,577 accepted recommendations were unresolved.
Working well: Completion of accepted recommendations
Agencies reported that 85 per cent of the accepted recommendations have been completed.
We categorise unresolved recommendations as either ‘in progress’ or ‘not started’.
Agencies reported 227 unresolved recommendations were in progress, while 10 were not started.
Figure 4: Status of accepted recommendations by tabled year
| 2018–19 | 2019–20 | 2020–21 | 2021–22 | 2022–23 | Total | |
|---|---|---|---|---|---|---|
| Complete | 536 | 250 | 245 | 266 | 43 | 1340 |
| In progress | 25 | 9 | 72 | 53 | 68 | 227 |
| Not started | 0 | 0 | 2 | 1 | 7 | 10 |
Source: VAGO.
Completion by type of agency
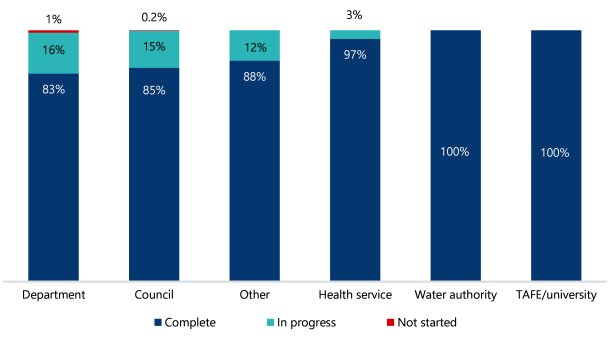
We looked at the completion of accepted recommendations by type of agency. Figure 5 shows the percentage and breakdown of accepted recommendations at each stage.
We categorised agencies by type:
- department
- council
- health service
- TAFE/university
- water authority
- others (for example, Victorian Planning Authority, Victoria Police and Parks Victoria).
TAFEs/universities and water authorities reported they had completed all the recommendations we made between July 2018 and June 2023. Departments, councils, other agencies and health services reported they had recommendations that are ‘in progress’ or ‘not started’.
Figure 5: Status of accepted recommendations by type of agency

| Department | Council | Other | Health service | Water authority | TAFE/ university | |
|---|---|---|---|---|---|---|
| Complete | 713 (83%) | 370 (85%) | 144 (88%) | 83 (97%) | 20 (100%) | 10 (100%) |
| In progress | 140 (16%) | 64 (15%) | 20 (12%) | 3 (3%) | 0 | 0 |
| Not started | 9 (1%) | 1 (0.2%) | 0 | 0 | 0 | 0 |
| Total | 862 | 435 | 164 | 86 | 20 | 10 |
Source: VAGO.
Completion by department
Of the 1,645 recommendations we made between July 2018 and June 2023, 903 (55 per cent) were to government departments.
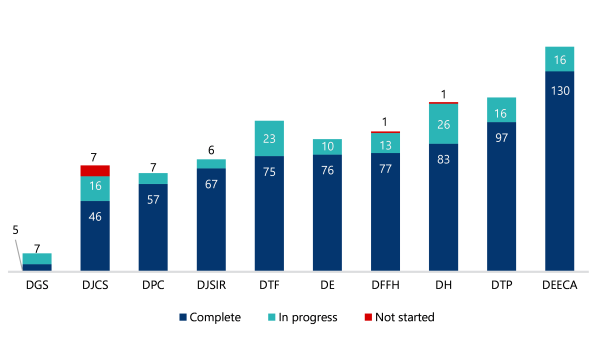
Government departments accepted 862 (96 per cent) of these recommendations. They have completed 713 (83 per cent) of the recommendations they accepted. Figure 6 shows the status of accepted recommendations by department.
Figure 6: Status of accepted recommendations by department

Note 1: Acronyms used are for the Department of Government Services (DGS), Department of Justice and Community Safety (DJCS), Department of Premier and Cabinet (DPC), Department of Jobs, Skills, Industry and Regions (DJSIR), Department of Treasury and Finance (DTF), Department of Education (DE), Department of Families, Fairness and Housing (DFFH), Department of Health (DH), Department of Transport and Planning (DTP), Department of Energy, Environment and Climate Action (DEECA).
Note 2: Department of Government Services (DGS) was established on 1 January 2023.
Source: VAGO.
Time agencies take to complete our recommendations
Importance of timely completion of recommendations
Our recommendations aim to address the root causes of poor performance. When agencies complete our recommendations, they help address the issues identified in our performance engagements.
When we table our performance engagement reports in Parliament, agencies can set target completion dates for the recommendations they accept. They may also revise their target completion dates as many times as needed.
While some recommendations are more complex than others, agencies should seek to complete recommendations:
- in a timely manner
- in accordance with their own target completion dates.
Overall time of completion
Agencies took a median of 13 months to complete recommendations tabled between July 2018 and June 2023.
The time taken to complete these recommendations varied from zero to 63 months.
Departments’ completion times
Departments took a median of 13 months to complete their recommendations.
Specifically, we found:
- DGS had the longest median completion time at 22 months. However, it is important to note that DGS was established on 1 January 2023. Recommendations to DGS were transferred from other departments after functions and responsibilities were reallocated.
- DPC had the second-longest median completion time at 19 months.
- DTF had the shortest median completion time at 10 months.
- DEECA completed the highest number of recommendations (130) at a median of 13 months.
Figure 7: Recommendations completed by departments against median completion times

Note: Recommendations to DGS were transferred from other departments after DGS was established in 2023. Two of these recommendations were completed before they were transferred.
Source: VAGO.
Agencies’ target completion dates
Initial target completion dates
Agencies may set target completion dates for recommendations before a performance engagement tables in Parliament. Of the 1,577 accepted recommendations made between July 2018 and June 2023, 1,333 had an initial target date (85 per cent). The median target date agencies set was 7 months after tabling.
Agencies completed 436 (33 per cent) of the recommendations by the initial target date. Agencies completed 679 recommendations (51 per cent) after the initial target date.
The maximum delay from the initial target date was 49 months.
Key issue: Initial target dates unmet
Half the recommendations were completed later than their initial target completion dates.
Revised target completion dates
During our annual review, we ask agencies if they have changed their target completion date for a recommendation.
Of the 1,333 accepted recommendations with an initial target completion date, agencies changed that date for 556 recommendations (42 per cent) by a median of 14 months. Of these, 90 per cent were further extended.
Of the 556 recommendations with changed dates, 324 have been reported as ‘completed’.
The median revised target date set by agencies was 25 months after tabling.
Not meeting revised target dates
Some agencies still did not meet their revised target completion dates despite revising them.
Of the 324 recommendations with revised target dates, agencies completed 135 (42 per cent) later than their revised dates. The length of additional delay was at a median of 61 days, or about 2 months.
Key issue: Some recommendations have been further delayed
Despite revisions, some agencies still did not meet their revised target completion date.
Status of unresolved recommendations
There are 237 accepted but unresolved recommendations.
Agencies set initial target completion dates for 218 of these unresolved recommendations. As at 31 December 2023, these unresolved recommendations were a median of 6 months behind their initial target dates.
Agencies have set revised target dates for 179 of these unresolved recommendations. The length of delay from their initial to revised target dates was at a median of 21 months.
Unresolved recommendations made before July 2018
Older recommendations
We requested updates on 23 unresolved recommendations made before July 2018.
Of these, 15 remain unresolved after this review. These relate to 7 agencies across 5 engagements.
These older recommendations have been tabled for a median of 69 months (over 5 years).
We urge the relevant agencies to resolve these recommendations. This will address the risks we found and make necessary improvements.
Key issue: Unresolved older recommendations
At this review, there are 15 recommendations made before July 2018 that remain unresolved.
Figure 8: Audits made before July 2018 with unresolved recommendations (in order of tabling date)
| Audit title | Unresolved recommendations | Responsible agency | Tabling date |
|---|---|---|---|
| Managing Public Sector Records | 4 | DGS | 8 March 2017 |
| ICT Disaster Recovery Planning | 1 | DFFH | 29 November 2017 |
| ICT Disaster Recovery Planning | 2 | DH | 29 November 2017 |
| Protecting Victoria’s Coastal Assets | 3 | East Gippsland Shire Council | 29 March 2018 |
| Protecting Victoria’s Coastal Assets | 1 | Great Ocean Road Coast and Parks Authority | 29 March 2018 |
| Protecting Victoria’s Coastal Assets | 2 | Mornington Peninsula Shire Council | 29 March 2018 |
| Safety and Cost Effectiveness of Private Prisons | 1 | DJCS | 29 March 2018 |
| Community Health Program | 1 | DH | 6 June 2018 |
Source: VAGO.
Appendix A: Submissions and comments
Download a PDF copy of Appendix A: Submissions and comments.
Appendix B: Abbreviations, acronyms and glossary
Download a PDF copy of Appendix B: Abbreviations, acronyms and glossary.
Appendix C: Review scope and method
Download a PDF copy of Appendix C: Review scope and method.
Appendix D: Performance engagements and agencies in this review
Download a PDF copy of Appendix D: Performance engagements and agencies in this review.
Download Appendix D: Performance engagements and agencies in this review
Appendix E: Agency responses to assurance review
Download a PDF copy of Appendix E: Agency responses to assurance review.

