Results of 2022–23 Audits: Local Government
Overview
View the dashboard full screen
Dashboard data
Click the links below to download CSV copies of the following datasets:
1. Audit outcomes
We gave clear audit opinions for financial reports and performance statements across the local government sector. Parliament and the community can confidently use these reports.
Financial reports and performance statements are reliable
The local government sector
The Victorian local government sector consists of 105 agencies, including 79 councils.
Each council and agency prepares a financial report. Each council also prepares a performance statement.
We audit all of these reports and statements.
See Appendix B for more information about the local government sector, including annual reporting timelines and requirements.
Number of clear audit opinions
To date, we have given 180 clear audit opinions across the sector for 2022–23 (see Figure 1). This means Parliament and the community can confidently use these reports.
Figure 1: Clear audit opinions for 2022–23

Source: VAGO.
Clear audit opinion
A ‘clear’ or ‘unmodified’ audit opinion means we have reviewed an agency’s financial report and performance statement (where applicable) and believe they are reliable and comply with relevant reporting requirements.
Audits in progress
At 29 February 2024, the following financial audits for 2022–23 were still in progress:
- West Wimmera Shire Council
- Wimmera Regional Library Corporation
- MomentumOne Shared Services Pty Ltd
See Figure E2 in Appendix E for more information about these audits.
Councils can improve their reporting processes
Role of internal processes
To prepare a financial report or performance statement within agreed timelines, internal processes should be:
- documented and sufficiently detailed to enable staff to perform the assigned task
- communicated to key stakeholders
- understood by members of the finance team and other business units involved with the:
- preparation of the financial report or performance statement
- provision of supporting information and advice.
It is critical that these processes include quality assurance procedures.
The maturity and effectiveness of a council’s internal processes affect its ability to finalise a financial report and performance statement in good time.
In 2022–23 financial report and performance statement timeliness were affected by:
- staff turnover
- varied maturity in planning and preparing for year-end
- disconnect between finance teams and other internal teams
- staff understanding of the financial reporting process.
These factors, individually and collectively, show councils can improve their internal processes to drive better outcomes.
Staff turnover
In 2022–23 the sector continued to experience staff turnover at a rate higher than pre-pandemic levels due to a competitive labour market.
The sector’s average staff turnover was 18 per cent in 2022–23. This was down from 20 per cent in 2021–22, but it is still higher than the 14 per cent that occurred in 2018–19.
All council cohorts, except for small shire councils, experienced a slight decline in staff turnover, as Figure 2 shows.
Small shire councils had a turnover rate of 22 per cent, which is higher than the sector average. For the past 5 years, small councils have experienced staff turnover at a rate above the sector average.
Figure 2: Average staff turnover by council cohort for 2018–19 to 2022–23

Source: VAGO.
Staff turnover affects an entity’s ability to prepare financial reports and performance statements, because:
- the entity loses corporate knowledge
- it takes time to replace and train staff
- new staff may be unfamiliar with the council’s legislative reporting obligations, policies and procedures.
A council can reduce these risks by making sure its:
- induction program, mandatory training and refresher training build staff’s awareness of its:
- governance arrangements
- operations
- legislative obligations
- policies and procedures
- internal processes are documented well enough to enable a new starter (whether a permanent employee or a contractor) to understand what must be done, how to do it and by when.
Recruiting and retaining appropriately skilled staff is a risk that requires active management to ensure the council meets its obligations.
Planning and preparing for year-end
To meet annual financial reporting timelines, an entity should have a plan that:
- outlines its legislative reporting requirements
- details tasks to be performed, by whom and when
- specifies the resources, milestones, key stakeholders, information systems, materiality threshold, oversight and quality assurance practices it needs to help the staff who prepare it.
In 2022–23 some councils did not provide their draft financial reports, performance statements and supporting schedules for audit within agreed timelines.
Only 22 of the 79 councils (28 per cent) submitted their draft financial report and performance statement to their auditors within agreed timelines. Figure 3 shows, for the 57 councils that were late, delays ranged from up to 7 days to in excess of 28 days (over 4 weeks).
Figure 3: Number of councils that submitted their draft financial report late, by days late

Source: VAGO.
These delays indicate challenges with the maturity and effectiveness of reporting plans and resource availability.
The delays had a snowball effect on the finalisation of audits across the sector. VAGO assigns audit teams to council audits for specific timeframes. If the information they need is delayed, the audit becomes stop–start in nature. Delays on more than one audit, leading to an ever-increasing backlog across multiple audits, increase the risk of timelines not being achieved across the sector.
We acknowledge that VAGO’s audit teams had challenges. Delays in finalising 2021–22 financial reports and performance statements after the COVID-19 pandemic meant some councils’ 2022–23 audit started later than they would have liked.
Nevertheless, councils need a detailed financial reporting plan and the resources to produce the required documents in required timeframes.
This is even more critical for the 2023–24 financial year, given there will be council general elections in October 2024. The Local Government Act 2020 (the Act) requires council annual reports – including audited financial reports and performance statements, and the associated audit reports – to be finalised no later than one day prior to the election.
Disconnect between finance teams and other internal teams
At some councils, we again saw a disconnect between the finance team and other internal teams. This led to teams not understanding:
- the interdependencies between teams’ outputs
- how the finance team uses other teams’ information and advice to prepare the council’s financial report and performance statement.
As a result, some teams did not always give the finance team timely, complete and accurate information based on sound records. This resulted in VAGO’s audit teams finding errors and the finance team needing to make adjustments.
Councils could improve the quality of their financial reports and performance statements by:
- strengthening their internal teams’ relationships
- making sure other internal teams understand the finance team’s information needs, timelines and outputs.
Staff understanding of the financial reporting process
From our work, we see opportunities for councils to enhance their staff’s understanding of the financial reporting process. We observed:
- a number of councils were not sure what documents they needed to provide VAGO to enable the release of the audit reports
- at times, the signed financial report or performance statement submitted to VAGO were missing pages, such as the certification page
- management representation letters, which should accompany the signed financial report and performance statement, were not signed or lodged with them (or both)
- there were delays in receiving the signed financial report and performance statement after their adoption and sign-off
- there were instances of poor governance around finalisation, signing and releasing reports to the public.
Councils have yet to streamline their financial reports
Over the years, financial reports have become longer and more complex. They also do not always cater to users’ needs. As a result, readers often struggle to find the information they are looking for.
Financial report preparers find it difficult to decide what information:
- is material, so must be disclosed in their financial report
- is not material, so should not be included.
Material
Information is material if misstating or not including it could influence a user’s decision or understanding.
Last year we recommended that councils streamline their financial reports. Streamlining financial reports helps entities tell their story in a simple and easy-to-understand way. It focuses on understanding users’ needs and providing material information while also ensuring compliance with applicable laws, regulations and accounting standards.
Streamlining is particularly important in the local government sector, due to the broad range of primary users of the financial reports. These include ratepayers, recipients of goods and services, and creditors. Some of these users will not have financial accounting knowledge, so it is essential that financial reports are presented in a simple and comprehensible format, with a specific focus on material information.
Each year Local Government Victoria (LGV) releases a model financial report and performance statement to help councils meet their reporting requirements. The Local Government (Planning and Reporting) Regulations 2020 (the Regulations) require councils to comply with these models.
LGV, in conjunction with a Local Government Finance Professionals working group, considered feedback from various stakeholders to enhance the model financial report.
In 2022–23 the vast majority of councils did not streamline their financial reports, even though the model financial report released by LGV allowed them to remove disclosures relating to immaterial balances. The sector missed an opportunity to streamline their financial report and save time and costs.
We found more errors in council financial reports and performance statements
Summary of financial reports errors
Councils must fix material errors before we can issue a clear audit opinion.
In 2022–23 we found 180 errors that councils adjusted in their financial reports. This compares to 149 errors in 2021–22. This indicates councils can improve their quality assurance processes when preparing financial reports.
We continued to find:
- issues with the quality of disclosures – either incomplete or missing content
- errors with councils’ property, infrastructure assets, plant and equipment (PIPE) balances. Section 3 has further commentary on asset management and valuation issues.
Figure 4 shows the number of errors we found in the last 2 years by category.
Figure 4: Adjusted errors by category for 2021–22 and 2022–23

Source: VAGO.
It was pleasing to see a reduction in errors relating to provisions and revenue.
Summary of performance statement errors
A council’s performance statement has measures to assess:
- how its services are performing
- its sustainability
- its financial performance.
In 2022–23, councils made 67 adjustments to their performance statements, compared to the 56 adjustments made in 2021–22.
Types of adjustments to performance statements
As Figure 5 shows, councils still need to focus on the calculation of performance measures and the quality of their disclosures.
Calculation errors were largely driven by:
- not using the latest data for non-financial indicators in the calculation
- misunderstanding the variables to include or exclude in calculating a performance measure
- finance teams not updating their calculations in the performance statement after correcting an error in the financial report.
The disclosure errors were driven by:
- finance teams not ensuring compliance with mandatory sections of the model performance statement before submitting the document for audit (noting that staff from other business units at times have responsibility for preparing the performance statement)
- finance teams’ internal quality assurance processes not being robust enough to identify anomalies
- the current structure of the model performance statement.
While preparers are responsible for their performance statement, LGV could help them by improving the structure and layout of its model performance statement. Improvements could include:
- presenting the required information in a logical sequence
- including a contents page
- assigning a note reference to key disclosures, as in the approach adopted with the financial report
- using more meaningful headings and subheadings.
LGV did release a publication, Local Government Better Practice Guide Performance Reporting for Council's Annual Report 2022–23 Edition, to help preparers meet their reporting obligations. It contained checklists and an example workplan detailing tasks that can be tackled before and after 30 June. Using the checklists would help councils avoid some of the disclosure adjustments.
Figure 5: Performance statement adjustments for 2021–22 and 2022–23

Source: VAGO.
| A … | Happens when … |
|---|---|
calculation error
| there is an error in either:
|
disclosure adjustment
| a council’s performance statement either:
|
Some councils did not meet annual report timelines
Councils’ reporting timelines
An annual report shows the operational and financial performance of an agency for the preceding financial year.
We audit the financial report, which represents the agency’s financial performance. We also audit the performance statement, which contains financial and non-financial performance measures. It provides further insights into the operational performance of the agency.
A council must hold a public meeting to consider its annual report within 4 months of the end of each financial year. In the year of a general election the meeting must be held not later than the day before the election.
The Act states the annual report must contain the following items:
- a report of operations
- an audited financial report
- an audited performance statement
- the associated audit opinions with respect to the financial report and performance statement.
Twenty of the 79 councils did not present their finalised 2022–23 annual report at a council meeting open to the public by 31 October 2023, the legislated date. Of these:
| There were ... | That … |
|---|---|
| 6 councils | had not finalised their financial report and performance statement by 31 October 2023. This meant they could not finalise their annual report and present it at a council meeting by the legislated date. |
| 10 councils | resolved to adopt their financial report and performance statement at a council meeting in October 2023, with their annual report to be presented at the next scheduled council meeting in November 2023. |
| 4 councils | presented an annual report at a council meeting in October 2023, but did not include the signed audit opinions as required by the Act. |
Governance arrangements across the sector can be improved
Corporate governance
Corporate governance refers to the framework for directing and controlling an agency and holding it accountable for achieving its strategic objectives.
It is important that councillors and their audit and risk committee, which consists of councillors and a majority of independent members:
- have a clear understanding of their role and responsibilities
- are familiar with the requirements of the Act and the associated regulations
- continue to enhance their knowledge and skills.
Need for continuous training and support
A learning and development program can help staff understand the requirements of their role. It should include an array of activities delivered over time and target specific areas or topics.
Councillors must complete induction training within 6 months of the day they take the oath or affirmation of office. The council’s chief executive officer is responsible for ensuring induction training is available and conducted as prescribed.
The Act does not say what ongoing training or learning and development program should be provided to councillors or audit and risk committee members.
Our audits indicate there is an opportunity for the sector to enhance the effectiveness of the governance arrangements in place with respect to financial reporting.
LGV or the Municipal Association of Victoria, as key stakeholders in the sector, may be best positioned to develop and deliver a structured training program for councillors and their audit and risk committee members. This may include appropriate resource material.
Developing a structured training program within the next 12 months could deliver real benefits straight away, given council general elections will be held in October 2024.
Recommendations
All councils
1. We recommend that all councils:
- arrange for training or briefing sessions to be held with key internal stakeholders before 30 June 2024 to enhance their understanding of the financial reporting process and their legislative obligations
- assess the adequacy of their financial reporting plan given their legislative obligations, namely:
- task allocation and timelines
- the nature and timing of liaison with other business units
- quality assurance processes
- critically assess whether they have the resources and expertise to fulfil their financial reporting obligations throughout the year and, if not, that they consider engaging an external party.
Local Government Victoria
2. We recommend that Local Government Victoria enhance the structure and layout of its local government model performance statement for the 2023–24 financial year.
Local Government Victoria and the Municipal Association of Victoria
3. We recommend that Local Government Victoria or the Municipal Association of Victoria, or both in partnership deliver a governance training program, which may include tailored resource material, to support councillors and their audit and risk committee members throughout their term of appointment.
2. Financial analysis
Councils started to see a return to pre-COVID-19 pandemic activities in 2022–23.
The sector’s financial performance improved slightly. A number of revenue and income streams increased, but growth in councils’ expenses outpaced this for another year. Financial performance would have declined had the Australian Government not advanced 100 per cent of the 2023–24 financial assistance grants in 2022–23.
Councils’ balance sheets remain strong and over the short term their financial health is fine. They face longer-term challenges that require sound financial planning and management to maintain this financial health. These challenges include:
- continued variability in government funding
- constraints on their ability to grow own-source revenue
- persistent inflation, increasing costs of materials and services
- population growth, which increases demand for services
- delivery of large capital works programs to maintain, renew and develop intergenerational assets
- lack of maturity of internal processes and the level of integration between council budgets, asset management plans and the 10-year financial plans.
The sector’s actual capital expenditure for 2022–23 was $3.163 billion. This was 26 per cent (or $1.128 billion) less than its budgeted spending. This underspending is consistent with previous years.
Results improved because of government funding and increases in other revenue and income streams
Net result
Net result is councils’ revenue and income from transactions minus their expenses from transactions.
In 2022–23, Victorian councils generated a combined net surplus of $2.394 billion.
This was $0.070 billion, or 3.0 per cent, more than in 2021–22. However, the sector's financial performance would have declined had the Australian Government not advanced 100 per cent of the 2023–24 financial assistance grant in 2022–23.
Total expenses grew by 9.3 per cent, outpacing the increase in revenue and income.
Financial performance snapshot
| The sector reported … | Which is a … | From … |
|---|---|---|
| $13.635 billion in revenue and income (including the financial assistance grant) | 8.2 per cent increase | $12.605 billion in 2021–22. |
| $11.241 billion in expenses | 9.3 per cent increase | $10.281 billion in 2021–22. |
Revenue and income by category
Rates and charges, and government grants are still councils’ biggest revenue and income sources, as Figure 6 shows.
Figure 6: Breakdown of councils’ revenue and income by category for 2021–22 and 2022–23

Source: VAGO.
Why total revenue and income increased
| In 2022–23, councils' revenue or income from … | Increased by … | Because … |
|---|---|---|
rates and charges
| $0.295 billion or 4.3 per cent to $7.083 billion
|
|
developer contributions (monetary and non-monetary)
| $0.214 billion or 12.6 per cent to $1.919 billion
|
|
user fees
| $0.180 billion or 21.4 per cent to $1.023 billion
|
|
interest revenue
| $0.185 billion or 485.4 per cent to $0.224 billion
|
|
Government funding continued to increase
Government grants are the second highest source of revenue for councils after rates and charges. Figure 7 shows that government grants have been increasing year on year since 2019–20.
Figure 7: Source of grant revenue 2018–19 to 2022–23

Source: VAGO.
The increase has been driven by:
- Australian Government capital grant programs such as the Local Roads and Community Infrastructure Program, which was introduced in 2020–21. From 2020–21 to 2022–23 the program allocated $0.546 billion to the sector.
- the Australian Government increasing the percentage of financial assistance grants it advanced ahead of the financial year to which the funding relates, as discussed above.
Government grants received in advance
Councils get annual funding from the Australian and Victorian governments.
How much they receive and when varies each year, depending on the governments’ program initiatives or capital projects.
Australian Government financial assistance grants are treated as income when received. Before 2021–22, councils typically received 50 per cent of the following year’s funding in advance. In the past 2 financial years, the proportion of advance payments has been increasing (see Figure 8).
Figure 8: Percentage of financial assistance grant paid in advance by year
| Financial assistance grants | 2022–23 (%) | 2021–22 (%) | 2020–21 (%) |
|---|---|---|---|
| Percentage of funding paid in the year to which the funding relates | 25 | 50 | 50 |
| Percentage of funding paid in advance of the financial year to which the funding relates | 100 | 75 | 50 |
| Total | 125 | 125 | 100 |
Source: VAGO.
In June 2023, the Australian Government paid 100 per cent of the 2023–24 financial assistance grants to councils in advance. The payments totalled $0.746 billion.
The sector received and recognised as income a total of $0.929 billion in financial assistance grants in the 2022–23 financial year. This includes the 25 per cent of financial assistance grants relating to the 2022–23 financial year that were paid in 2022–23.
Even if the Australian Government advances 100 per cent of the 2024–25 financial assistance grants in 2023–24, councils will record a 25 per cent decrease in grant income in 2023–24, if all other funding arrangements remain consistent with 2022–23. If the amount advanced is less than 100 per cent, the decrease in grant income will be even greater.
The small and large shire council cohorts are more reliant on government funding than the other cohorts, so their net surplus or deficit may experience greater fluctuation in 2023–24.
Given the variability of government funding, it is critical that councils effectively manage their cash reserves within the context of council budgets, asset management plans and their 10-year financial plans.
Councils’ expenses by category
As Figure 9 shows, councils continue to spend the most on:
- employee costs
- materials and services.
Figure 9: Breakdown of councils’ expenses by category for 2021–22 and 2022–23

Source: VAGO.
Change in expenses
In 2022–23 councils’ total expenses grew by 9.3 per cent to $11.241 billion.
This was mainly because the cost of councils’ materials and services increased by 11.6 per cent from 2021–22, due to:
- persistent inflation
- increased council activities
- reliance on contractors to fill vacant staff roles
- costs incurred with flood recovery.
The actual material and services costs were also 9.7 per cent greater than approved 2022–23 council budgets.
Adjusted underlying result indicator
The adjusted underlying result indicator measures a council’s ability to generate a surplus from its ordinary course of business (excluding capital receipts) to fund its capital spending.
It is important that councils generate enough money to deliver community services. A longer-term negative trend in this indicator could force councils to reduce the services they offer their communities.
In 2022–23 the sector’s adjusted underlying result deteriorated to 0.15 per cent, compared to 1.41 per cent in 2021–22. The adjusted underlying result before the pandemic was greater than 4 per cent (see Figure 10).
Figure 10: Councils’ adjusted underlying results and net results from 2018–19 to 2022–23

Source: VAGO.
Figure 11 provides a breakdown of the number of councils with an adjusted underlying result in surplus or deficit in 2022–23 compared to 2018–19 (pre-COVID).
Figure 11: Councils’ adjusted underlying result
| Adjusted underlying result | 2022–23 number of councils | 2018–19 number of councils |
|---|---|---|
| Surplus | 41 | 56 |
| Deficit | 37 | 23 |
Note: 78 councils for 2022–23, as one council yet to finalise their financial report.
Source: VAGO.
The adjusted underlying surplus includes the advance financial assistance grant payments from the Australian government. Had the total financial assistance grants not remained at the same percentage as the previous year, more councils would be reporting an adjusted underlying deficit.
The sector’s financial position remains sound, with low debt levels
Financial position snapshot
At 30 June 2023, councils’ net assets totalled $137.398 billion. This is an increase of $7.010 billion, or 5.4 per cent, from 2021–22.
In particular:
| The sector reported ... | Which is an increase of …. | From … |
|---|---|---|
| $142.811 billion in total assets | $7.254 billion, or 5.4 per cent | $135.557 billion at 30 June 2022. |
| $5.413 billion in total liabilities | $0.244 billion, or 4.7 per cent | $5.170 billion at 30 June 2022. |
Increase in assets
The main reason councils’ assets increased by $7.254 billion was because the value of their PIPE assets grew by $6.637 billion in 2022–23.
All council cohorts recorded an increase in PIPE value.
| PIPE value increases were mainly driven by ... | And were mainly offset by ... |
|---|---|
| $4.862 billion of revaluations on councils’ land, buildings and infrastructure assets | $1.977 billion of annual depreciation expenses. |
| councils spending $3.163 billion on new PIPE assets |
Depreciation expenses
Depreciation expenses are an estimate of how much of an asset’s service potential was used during the year.
The sector’s cash and other financial asset balances have been increasing
At 30 June 2023, the sector’s average liquidity ratio remained positive at 2.43, which is consistent with the prior year. This means the sector’s cash and other liquid assets are more than double its short-term liabilities.
Councils’ cash and financial assets had increased by $0.335 billion (or 4.7 per cent) at 30 June 2023. The main drivers for this increase were:
- a slight increase in the value of financial assistance grants received compared to the prior year
- councils deferring or experiencing delays with the completion of planned capital work programs, allowing surplus funds to be invested.
Figure 12 summarises councils’ cash assets and other financial assets at 30 June 2023 and 30 June 2022.
Figure 12: Summary of councils’ cash assets and other financial assets by year
| Asset category | 30 June 2023 ($ billion) | 30 June 2022 ($ billion) |
|---|---|---|
| Cash assets | 2.323 | 2.242 |
| Other financial assets | 5.212 | 4.958 |
| Toal | 7.535 | 7.200 |
Other financial assets
Other financial assets include term-deposits. Those term deposits with terms greater than 90 days but less than a year are classified as ‘Other financial assets (current)’. If the terms are greater than 12 months, they are classified as ‘Other financial assets (non-current)’.
Borrowing levels increased
At 30 June 2023 the sector had total borrowings of $1.271 billion, an increase of $0.189 billion (or 17 per cent) compared to the prior year.
The increase was driven by some councils borrowing money to fund their capital works programs.
The sector’s total borrowings represented 0.9 per cent of its total assets, up from 0.8 per cent in the prior year.
Financing ratios show an opportunity for councils to invest their cash more effectively
The internal financing indicator measures a council’s ability to finance capital works from its operating cash flow. When it is greater than one, it means that after paying for all its day-to-day expenses and capital works, there is still cash left over at the end of the year.
Figure 13 shows that for the past 5 years, this indicator has been greater than one, which contributed to growing cash and other financial assets.
The indebtedness indicator assesses whether councils can service their debts and meet their repayment obligations using their own-source revenue.
Own-source revenue
Own-source revenue takes total revenue and income and excludes income streams over which councils have limited control. These are government grants and developer contributions.
Figure 13 also shows that for the last 5 years, councils’ total long-term debt has been equal to just 0.2 (or 20 per cent) of their own-source revenue in any given year.
Figure 13: The sector’s internal financing indicator and indebtedness indicator results from 2018–19 to 2022–23

Source: VAGO.
The 2 indicators show that every year the sector:
- generates more cash than it spends
- generates enough in one year to cover its long-term liabilities.
Therefore, there is little need to keep a high level of current cash and investments.
Councils should review whether their treasury function is sufficient
Given their growing cash balances, councils should ensure their long-term financial plans are sufficiently detailed and accurate to obtain the best return.
Under the Act, councils can only hold fixed-income investments unless approved by the Minister for Local Government. Their financial assets are therefore mostly cash and other financial assets.
Figure 14 shows the investment profile of council cash and investments.
Figure 14: Cash and investment by maturity and cohort in $ billions for 2022–23

Source: VAGO.
This graph shows that councils prefer term deposits that mature in less than 12 months. Given the balance of cash held, historical rates of spending and low levels of debt, there is an opportunity for councils to take advantage of longer-term deposits and benefit from a higher rate of return.
To allow this, councils must be able to forecast accurately to ensure the timing of their cash needs is matched with the maturity of the term deposits.
Currently, we see a high level of underspend on councils’ capital works programs, which indicates their long-term financial planning needs more development.
The metro and interface councils are the 2 cohorts with the largest cash and other financial assets. They are also the 2 cohorts with the biggest capital budget underspend year on year.
Actual capital expenditure continues to be below budget
Capital expenditure
Each council’s financial report includes a capital works statement. The statement:
- compares the council’s budgeted capital expenditure with its actual capital expenditure
- explains any material variations between its budgeted and actual capital expenditure.
In 2022–23 the sector’s actual capital expenditure was $3.163 billion. This was 26.2 per cent (or $1.128 billion) less than it budgeted.
Figure 15 compares the sector’s budgeted capital expenditure to its actual capital expenditure for 2018–19 to 2022–23 and reveals a trend of underspend. This trend existed pre-pandemic and may indicate challenges with effective capital budgeting and ongoing management by the sector.
Figure 15: Budgeted versus actual capital expenditure and percentage underspend from 2018–19 to 2022–23

Source: VAGO.
Councils can improve their financial planning for capital works
In our 2021-22 report we made recommendations that all councils assess their capital works budgeting processes and investigate root causes of under-delivery. The recommendations remain relevant for the sector.
There has been an improvement in the number of councils that met or exceeded budget, coming in at 16 councils (2021–22: 11). However, the sector has room to improve, given more than half had underspend between 15 and 40 per cent of their budget:
| Councils that underspent their budgeted capital spend by … | Numbered ... | And made up … |
|---|---|---|
| 0 per cent | 16 | 20.8 per cent of all councils. |
| 0–15 per cent | 6 | 7.8 per cent of all councils. |
| 15–40 per cent | 39 | 50.6 per cent of all councils. |
| more than 40 per cent | 16 | 20.8 per cent of all councils. |
Of the 16 councils that met or exceeded their budget, we note that 12 are from either the small or large shire cohorts, both of which have smaller capital work programs.
It appears that, as capital work programs get larger, more councils underspend, as Figure 16 shows.
Figure 16: Total and average capital budgeted expenditure and percentage of councils that underspent within the cohort for 2022–23
| Cohort | Total capital budgeted expenditure ($ million) | Average capital budgeted expenditure ($ million) | Percentage of councils that underspent |
|---|---|---|---|
| Interface | 957 | 106.34 | 89% |
| Metro | 1,716 | 77.99 | 91% |
| Regional | 679 | 67.92 | 90% |
| Large shire | 670 | 35.29 | 74% |
| Small shire | 269 | 14.95 | 59% |
Source: VAGO.
Indicator of growing dissatisfaction of council asset condition
Included in the performance statement is a measure of satisfaction with council roads.
Over the past 2 years we have seen a downward trend for all cohorts, as shown in Figure 17. Three cohorts reported a significant decline in satisfaction of council roads. The regional, large and small council cohorts reported a decline in road satisfaction of at least 9 per cent in that time.
The downward trend is probably caused by various factors, such as:
- weather conditions that contribute to a deterioration of the road network or delay planned capital works
- capacity of suppliers to do planned work
- supply chain issues
- confusion over whether the federal, state or local government is responsible for maintaining a road.
Figure 17: Average road satisfaction of council roads by cohort from 2019–20 to 2022–23

Source: VAGO.
Figure 18 indicates the actual expenditure on roads has been less than budgeted the past 2 years.
Figure 18: Roads expenditure budgeted versus actual expenditure from 2021–22 to 2022–23

Source: VAGO.
The metro and interface councils had the largest level of underspend in 2022–23 (see Figure 19).
Figure 19: Roads expenditure budgeted versus actual expenditure by cohort for 2022–23

Source: VAGO.
Consistent underspending of councils’ capital works program increases the risk of ratepayers being dissatisfied with the condition of council assets.
On 19 November 2023 the Australian Government announced a doubling of the Road to Recovery funding program to fix condition of roads around Australia.
Councils, in preparing their capital expenditure budget for 2024–25, should consider this development when estimating their level of planned roads expenditure over the forward period. Councils will also need to consider supplier and materials availability when estimating costs and likely timing of the capital works.
Capital replacement and renewal gap indicators
Capital replacement and renewal gap ratios are longer-term measures that assess the sector’s spending on infrastructure assets compared to depreciation. A result higher than one indicates that spending is faster than depreciation rates.
The sector’s average capital replacement ratio and renewal gap ratio over the last 5 years remained above one (see Figure 20).
However, this indicator does not consider councils’ planned capital expenditure. The underspend that is occurring indicates spending on asset expansion, renewal, upgrade or replacement may not be keeping pace with the needs of the community.
At 30 June 2023 the sector’s:
- average capital replacement ratio was 1.72
- average renewal gap ratio was 1.12.
Figure 20: The sector’s average capital replacement and renewal gap ratios from 2018–19 to 2022–23

Source: VAGO.
3. Internal controls and financial reporting issues
Councils have adequate internal controls for preparing reliable financial reports and performance statements, but there is room for improvement.
Information technology (IT) controls and asset management weaknesses continue to be key areas for improvement across the sector.
It can also improve its oversight of balances that are subject to management judgement.
Internal control snapshot
Councils must have an effective internal control system to keep proper accounts and records.
We assessed if councils’ internal controls, which include people, systems and processes, allow them to prepare reliable financial reports and performance statements.
Overall, councils’ internal controls remain adequate for reliable reporting, but there are areas for improvement.
Communicating internal control and financial reporting issues
We alert a council’s management and audit and risk committee to any internal control and financial reporting issues we find during an audit, as required by the Australian Auditing Standards. This includes:
- raising new issues
- giving updates on unresolved issues we raised in a prior period.
Councils can strengthen their internal controls and financial reporting processes by promptly responding to the issues we raise.
While councils need to address all weaknesses, they should prioritise higher-risk issues.
There was an increase in unresolved issues from the previous year
New and unresolved issues
As Figure 21 shows:
- new internal control and financial reporting issues decreased slightly from 133 in 2021–22 to 124 in 2022–23
- councils’ unresolved issues from previous years increased from 81 in 2021–22 to 98 in 2022–23.
The increase is due to councils not resolving prior-year general IT control and asset management weaknesses (see Figure 22).
Of the new and unresolved issues in 2022–23, we rated:
- 5 unresolved and 3 new issues as high risk
- all remaining issues as medium risk.
Figure 21: New issues and unresolved prior-period issues from 2018–19 to 2022–23
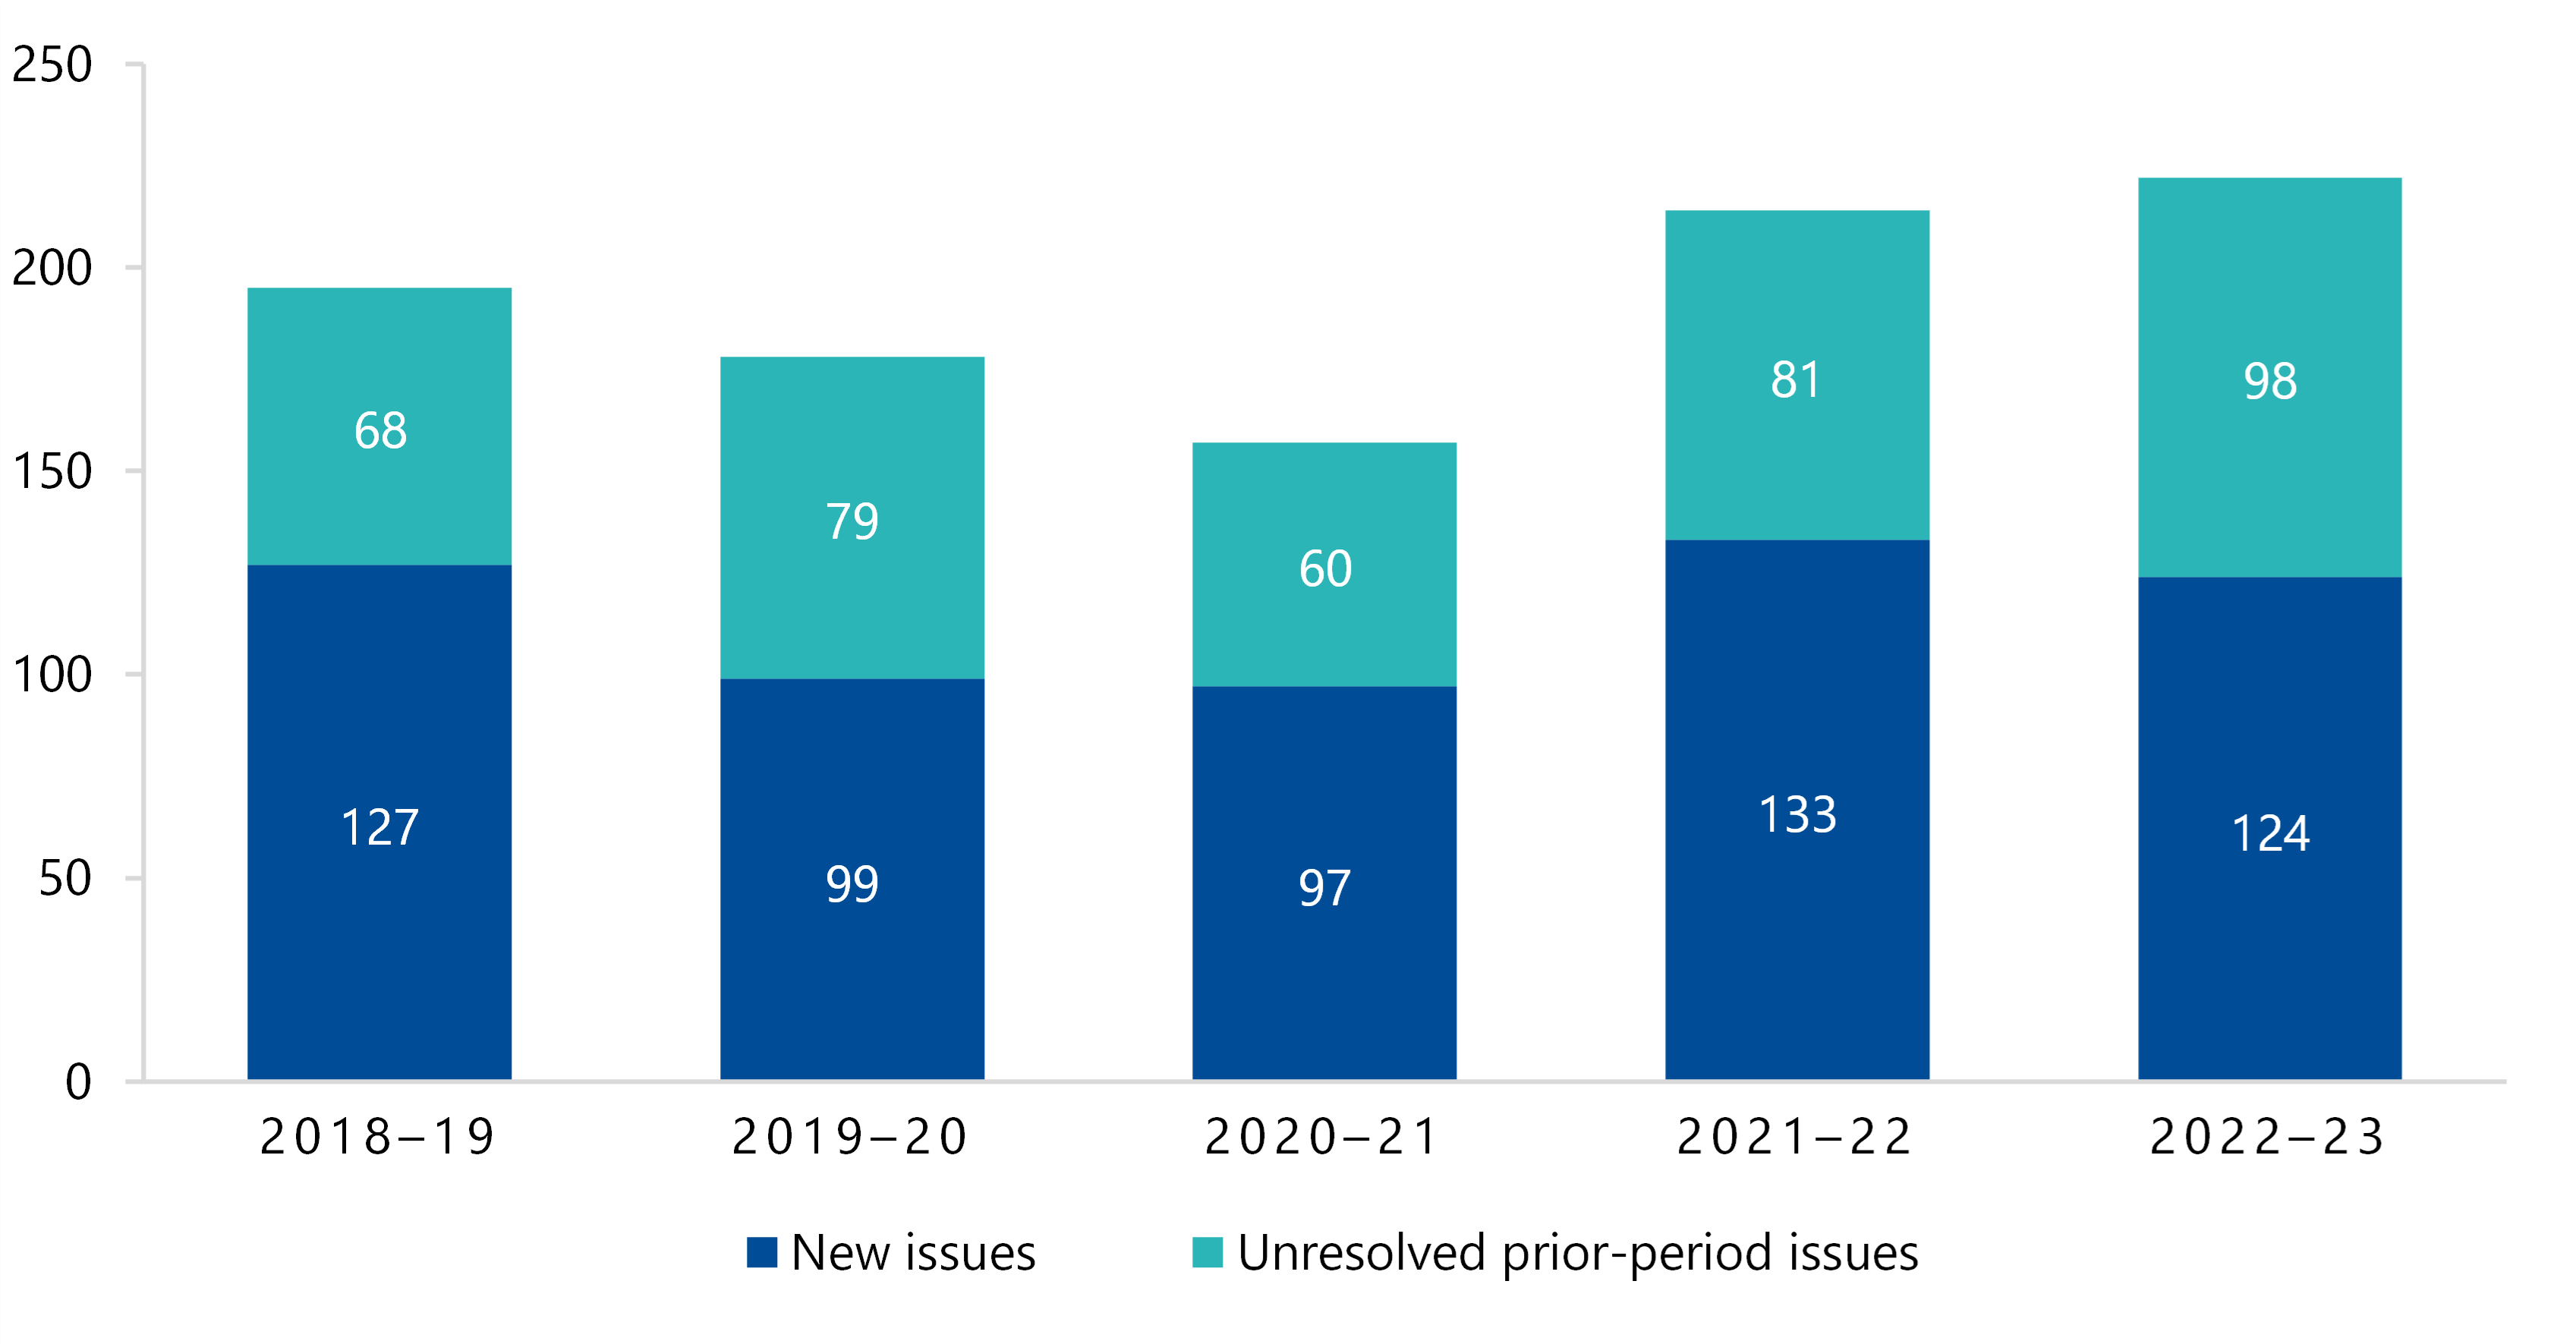
Note: We excluded low-risk issues because we consider these as minor issues or opportunities to improve.
Source: VAGO.
Medium and high-risk findings by category
Figure 22 shows the number of open medium and high-risk issues by category for the last 2 years.
Figure 22: Medium and high-risk issues by category for 2021–22 and 2022–23
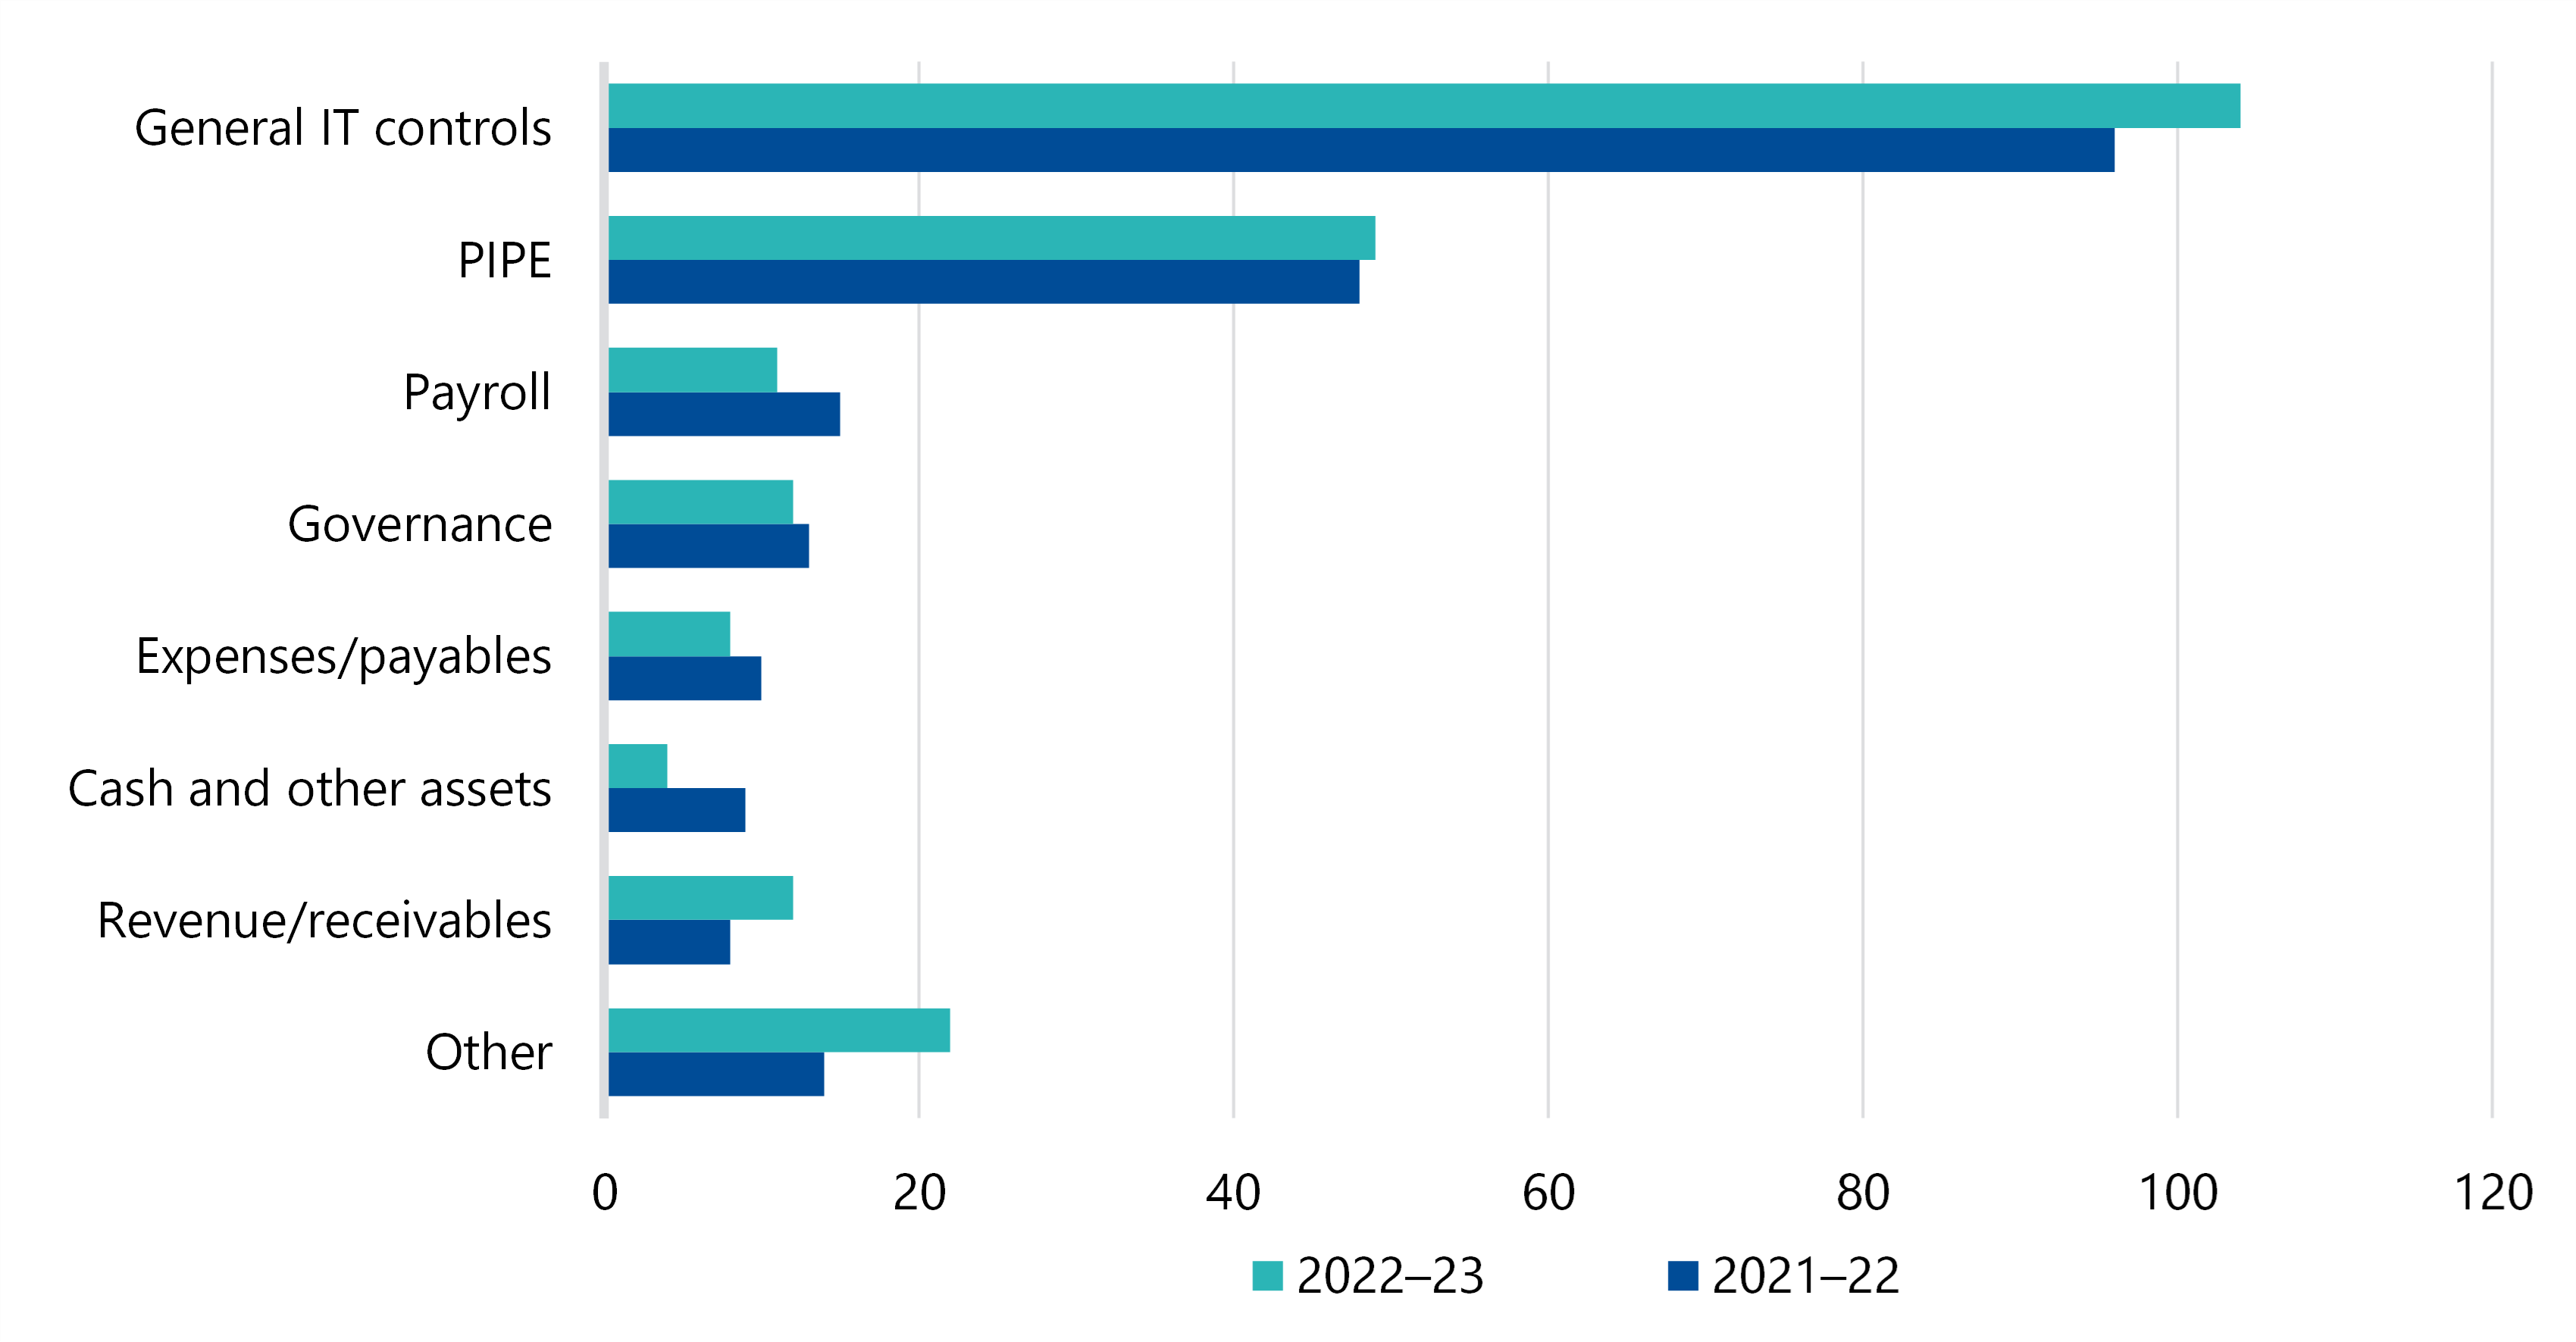
Source: VAGO.
The most significant internal control areas that we continue to see issues in are:
- general IT controls
- accounting for PIPE, in particular their fair values.
IT control weaknesses
Importance of IT controls
Effective IT controls reduce the risk of unauthorised people accessing and changing councils’ systems. They also help protect the integrity of councils’ data and support the preparation of reliable financial reports.
As the use of IT systems to manage operational and financial data increases, it is increasingly important that councils have effective IT controls.
We continue to find many IT weaknesses
Poor IT controls increase the risk of unauthorised access, cyber attacks, fraud, error, data manipulation and information theft. Management should resolve them promptly, to ensure systems are secure and financial information is reliable.
We tailor our audits to match the risks councils face and continue to place increased focus on IT controls.
There was an increased focus on IT controls in 2022–23 following amendments to Australian auditing standard ASA 315 Identifying and Assessing the Risks of Material Misstatement.
As Figure 23 shows, though weaknesses in ‘policies and procedures’ and ‘intrusion detection’ fell, there was an increase across all other categories in the number of unresolved IT weaknesses we identified.
Figure 23: Unresolved IT control weaknesses by type for 2021–22 and 2022–23

Source: VAGO
We rated all these issues as medium risk.
User access management and authentication controls reduce the likelihood of unauthorised access to an entity’s systems and underlying data.
Audit logging and monitoring controls detect unauthorised access and changes after they occur. Audit logs also ensure that an entity captures all critical changes as part of its change management controls.
Intrusion detection means an application that monitors network traffic and searches for known threats and suspicious or malicious activity.
Many IT issues are still unresolved
A council’s risk of experiencing a major disruption, such as a cyber attack, increases if it does not fix IT control issues promptly.
Of the 104 medium unresolved IT control weaknesses, we found 46 in a prior year. Including low risk IT weaknesses, there are a total of 62 weaknesses that have not been addressed by councils within one year. As figure 24 shows, this is an increase from 49 identified weaknesses in 2021–22.
Figure 24: Aging of unresolved medium and low-risk IT issues for 2021–22 and 2022–23

Source: VAGO
When we alert a council’s management and audit and risk committee to any internal control issues, we recommend a time within which councils should address these weaknesses (see Appendix F). We recommend that weaknesses are resolved within 12 months at the longest, so these 62 weaknesses have not been addressed within our recommended timeframe.
IT-related issues can take time to resolve, especially if a council needs to work with a system’s supplier to address them. But it is important that they resolve these issues as soon as possible, to ensure the protection and reliability of the data in these systems.
Asset management and valuation processes
Asset valuation
Councils must have robust asset management and valuation processes to meet their communities’ needs. These processes continue to be an area that councils need to improve.
Councils construct, maintain and renew significant physical infrastructure for their municipalities. They record their PIPE assets at fair value.
Arriving at an asset’s fair value can be complex and is subject to judgement. Councils need to use many assumptions about the assets. Sometimes they engage valuation experts and they may draw upon industry indices.
Asset valuation issues we commonly find include councils:
- not conducting regular fair value assessments for all their asset classes and documenting their assessments
- not obtaining or not accurately applying condition information to assets
- incorrectly calculating the revaluation increment or decrement that results from a revaluation
- incorrectly accounting for the movement in value in line with Australian Accounting Standards.
A council’s finance, asset management and, sometimes, engineering teams must work together to consider fair value issues early in a reporting cycle.
Asset recognition and record-keeping
We also commonly see councils:
- not capitalising new assets in a timely way, understating depreciation expenses
- not recognising developer-contributed assets in a timely way, which leads to understating:
- income
- depreciation expense
- assets
- not ensuring controls and procedures are consistently being applied to prevent or detect errors in asset data
- not updating and reconciling their fixed-asset registers regularly, leading to inaccurate and perhaps invalid financial asset information.
Inaccurate or incomplete asset records can also affect the asset valuation process. Management may incorrectly include or exclude assets from the valuation process based on this inaccurate data.
PIPE issues by type
Figure 25 shows the number of unresolved medium and high-risk PIPE findings by category that we reported to councils in 2021–22 and 2022–23.
Figure 25: PIPE internal control and financial reporting on medium and high-risk issues by category for 2021–22 and 2022–23

Source: VAGO.
We first reported 21 of the medium and high findings in 2022–23. The number of unresolved prior-period findings increased from 19 in 2021–22 to 28 in 2022–23, which includes 5 findings we rated as high risk.
We reported a further 53 unresolved low-risk issues to councils in 2022–23 about asset management and valuation.
Focusing on asset valuations and strengthening their asset management processes will help councils have more robust and accurate data on their infrastructure network for financial and performance reporting.
Councils can also use this data to develop mature asset management plans and improve their capital expenditure budget estimates.
Councils can improve their oversight of balances subject to management judgement
Effectiveness of oversight of fair value assessments and asset valuations
PIPE represents approximately 90 per cent of total assets for every council. The valuation of such assets and the annual fair value assessment involves significant management judgement.
VAGO’s Results of 2021–22 Audits: Local Government report contained a recommendation that finance teams prepare and present a paper to their audit and risk committee prior to 30 June. It should outline the:
- requirements of the council's accounting policy with respect to PIPE
- approach to assessing the fair value PIPE, including the engagement of an expert valuer and key milestones
- likely outcomes for that reporting cycle (in other words, expected movements in fair value and the resultant impact on the financial report).
Only 17 of the 79 councils prepared and presented a paper at an audit and risk committee meeting prior to 30 June 2023. A further 7 councils presented a paper detailing valuation outcomes at their audit and risk committee meeting after the balance date.
Without a paper being prepared and considered at a council's audit and risk committee meeting prior to 30 June, the committee’s ability to effectively oversight key accounting issues is reduced.
Issues can be resolved quickly through early dialogue with key stakeholders. This should cover the council’s planned approach to assessing fair value, the key assumptions underpinning the valuation methodology and the engagement of a valuation expert.
Queries raised at an audit and risk committee meeting in August or September can delay the clearance and signing of the financial report. This increases the risk that a council will be unable to meet its annual reporting obligations within the timeframe set by the Act.
The fair value assessments and valuation outcomes are also important for long-term financial management, as they provide insight into the current replacement cost of assets.
Councils are responsible for the management and ongoing maintenance of a significant number of assets. This makes it critical that decisions on asset acquisitions, upgrades, renewal, replacement, decommissioning and maintenance are based on the latest available information. It should also take into account the council’s corporate plan, asset management plan and 10-year financial plan.
Accordingly, it is critical that a council’s audit and risk committee scrutinises the fair value assessments and valuation outcomes to support executive decision-making.
Recommendations
All councils
4. We recommend that finance teams:
- prepare and present a paper to their audit and risk committee prior to 30 June each year that outlines the:
- requirements of the council’s accounting policy with respect to property, infrastructure assets, plant and equipment
- approach to assessing the fair value of each class of property, infrastructure assets, plant and equipment, including the engagement of an expert valuer and key milestones
- likely outcomes for the respective reporting cycle (expected movements in fair value and resultant impact on the financial report).
5. We recommend that audit and risk committees:
- prior to balance date, review the finance team’s accounting paper
- after balance date and at the time of reviewing the draft financial report:
- determine whether there have been any changes to circumstances that would indicate that key assumptions behind the finance team’s initial advice and key judgements no longer hold true
- assess the reasonableness of the valuation and fair value assessment outcomes.
- update their annual work plan to include the above tasks.
6. We recommend that councils:
- prioritise and promptly address the internal control and financial reporting issues we raise with them and that their audit and risk committee monitor this
- review the actions and timelines established to resolve internal control weaknesses, with a focus on older and higher-risk findings
- for longer-term action plans, ensure adequate compensating safeguards are in place.
Appendix A. Submissions and comments
Click the link below to download a PDF copy of Appendix A: Submissions and comments.

Appendix B. Sector context
Click the link below to download a PDF copy of Appendix B: Sector Context.
Appendix C. Audit context
Click the link below to download a PDF copy of Appendix C: Audit context.
Appendix D. Abbreviations, acronyms and glossary
Download a PDF copy of Appendix D: Abbreviations, acronyms and glossary.
Appendix E. Audit opinions
Appendix F. Control issues risk ratings
Download a PDF copy of Appendix F: Control issues risk ratings.
Appendix G: Financial sustainability indicators
Download a PDF copy of Appendix G: Financial sustainability indicators.