Results of 2023–24 Audits: Local Government
Report snapshot
About this report
This report presents the results of our financial and related audits of local councils and their controlled entities, library corporations and associated entities. We also provide our independent perspective on the sector’s financial outcomes and highlight common internal control and financial reporting issues and make recommendations for improvements.
Audit outcomes
Report users can be assured that the financial reports and performance statements are reliable. We issued clear audit opinions on all financial reports and performance statements finalised for the 2023–24 financial year. Three financial reports remain to be finalised.
Nonetheless some councils can strengthen their reporting processes and improve the timeliness of their reporting.
Financial analysis
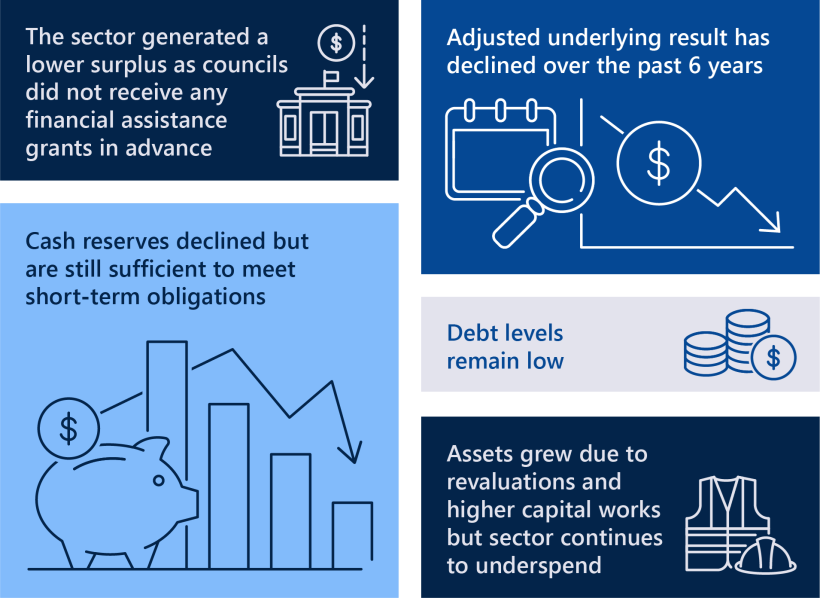
The sector overall recorded an operating surplus, albeit lower than last year. Sector revenues and income from rates, fees and charges, and interest grew, while grant income fell. However, spending grew faster than revenue and income.
Last year councils were paid this year’s financial assistance grants in advance, but this did not happen again this year. So only 50 councils recorded a surplus this year, compared to 74 last year. But if we adjust the timing of grants and allocate them to the intended financial year, performance is better than reported. For 2023–24, only 8 councils would have reported a net loss if they had received their grants in the year intended.
The value of physical assets in the sector grew by $3.461 billion through new additions, though it underspent its capital works budget by 17 per cent this year. Revaluations also increased the value of assets by $4.934 billion reflecting the higher cost of replacing physical assets with their modern equivalents – an important factor for long term asset management and financial planning.
While the sector’s cash and other financial assets were lower at 30 June 2024 compared to the prior year, the sector had sufficient working capital for the short-term. Almost all councils reported positive cash inflows from operations, although 5 smaller councils experienced net cash outflow positions, highlighting their significant dependence on the timing of government grant funding.
Total liabilities remained stable at $5.454 billion, with a slight increase in borrowings to fund some capital works programs.
Internal controls and financial reporting issues
Councils have adequate internal controls for preparing reliable financial reports and performance statements, but there is room for improvement. Key areas that need attention include information technology (IT) controls, asset management and oversight of asset valuations.
The sector is not as prepared as it should be for the Australian Accounting Standards Board (AASB) 13 Fair Value Measurement amendments, which will impact financial reports for the first time in the 2024–25 financial year. This could affect the timely preparation and finalisation of financial reports. We encourage councils to prioritise preparations for these amendments in advance of year-end.
Data dashboard
Our recommendations
We consulted with the audited agencies and considered their views when reaching our conclusions. The agencies' full responses are in Appendix A.
This year's recommendations
| Recommendation | Agency response | |||
|---|---|---|---|---|
Councils
| 1
| For councils that did not prepare draft financial reports or performance statements by the timelines agreed with their auditor:
| -
| |
2
| Councils take the lead in the formation of a ‘developer non-cash contribution’ working party to create guidance materials that will strengthen internal processes. Councils could also consider hosting workshops to support the sector in applying the guidance effectively.
| -
| ||
3
| Councils resolve the open recommendations from the Results of 2022–23 Audits: Local Government report.
| -
| ||
4
| Councils that have not yet done so:
| -
| ||
Local Government Victoria
| 5
| Formally advise and remind the councils of their annual reporting obligations.
| Accept
| |
6
| Reassess the appropriateness of the mandated:
| Accept
| ||
Municipal Association of Victoria
| 7
| Develop and deliver the intended councillor development program with input from Local Government Victoria, as applicable.
| -
| |
Follow-up on prior-year recommendations
| Recommendation | Recommendation addressed | |||
|---|---|---|---|---|
All councils
| 1
|
| In progress –see Appendix H for details
| |
2
| that finance teams prepare and present a paper to their audit and risk committee prior to 30 June each year that outlines the:
| In progress –see Appendix H for details
| ||
3
| that audit and risk committees:
| In progress –see Appendix H for details
| ||
4
|
| In progress –see Appendix H for details
| ||
Local Government Victoria
| 5
| enhance the structure and layout of its local government model performance statement for the 2023–24 financial year.
| Completed
| |
Local Government Victoria and/or the Municipal Association of Victoria
| 6
| deliver a governance training program, which may include tailored resource material, to support councillors and their audit and risk committee members throughout their term of appointment.
| In progress –see Appendix H for details
| |
1. Audit outcomes
Snapshot
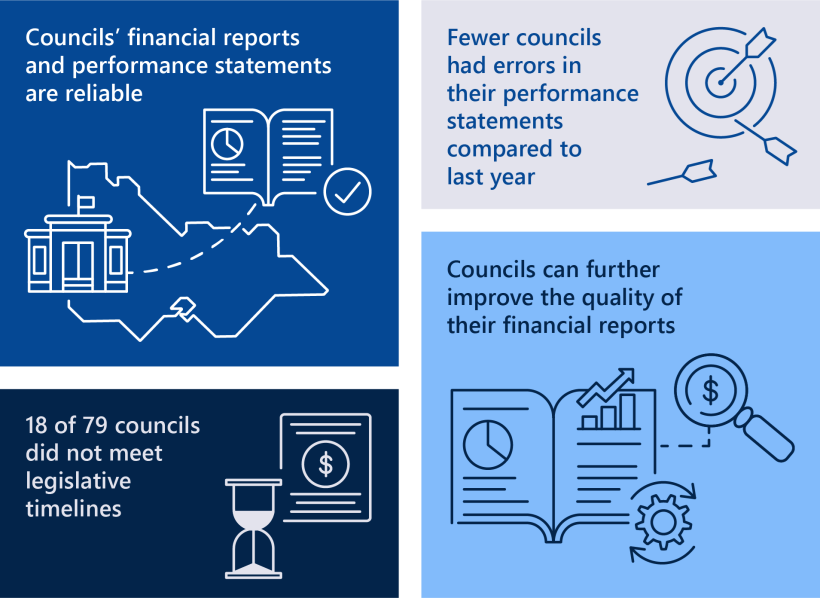
We provided clear audit opinions on all finalised financial reports and performance statements across the local government sector for the 2023–24 financial year.
Our clear opinion provides reasonable assurance that the financial reports and performance statements are reliable.
Councils have the opportunity to strengthen their reporting processes and improve the timeliness of their reporting.
Financial reports and performance statements are reliable
Council’s reporting requirements
Financial and performance reporting requirements
The Victorian local government sector consists of 104 agencies, including 79 councils.
Each council prepares a financial report and a performance statement, both of which we audit.
The Local Government (Planning and Reporting) Regulations 2020 prescribe the content of a council’s financial report and performance statement.
The Regulations require the financial report to be prepared in accordance with the Local Government Model Financial Report, as issued by Local Government Victoria (LGV).
See Appendix B for more information about the local government sector, including annual reporting timelines and requirements.
Audit outcomes
Clear audit opinions
We have issued 179 clear audit opinions across the local government sector for 2023–24. This means Parliament and the community can confidently use these reports.
Figure 1: Clear audit opinions 2023–24
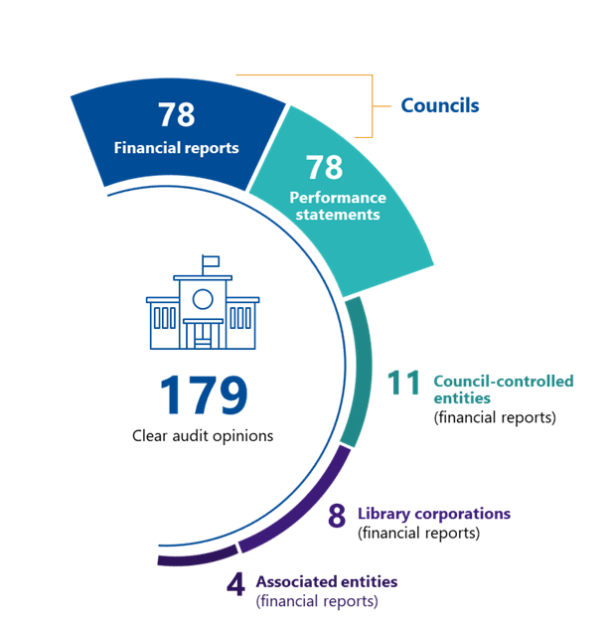
Source: VAGO.
Clear audit opinion
A clear audit opinion means we have reviewed an agency’s financial report and performance statement (where applicable) and believe they are reliable and comply with relevant reporting requirements.
Audits in progress
On 14 March 2025, the following financial audits were still in progress:
- councils:
- Yarriambiack Shire Council
- associated entities:
- MomentumOne Shared Services Pty Ltd
- Regent Management Company Pty Limited.
See Figure E2 in Appendix E for more information about these audits.
Areas for improvement needed in reporting processes
Councils should develop a comprehensive plan with realistic timelines
To meet annual financial reporting timelines, each entity should have a financial reporting plan that:
- outlines its legislative reporting requirements
- identifies the required resources
- details tasks to be performed, by whom and when
- specifies key milestones, key stakeholders and information systems
- contains a materiality threshold to guide the finance team
- addresses quality assurance practices needed to help the staff who prepare it.
A plan provides clarity for all involved with the preparation of the financial report and performance statement. Accurate and timely reporting is enhanced when the plan:
- contains sufficient detail
- involves realistic target dates
- is underpinned by the right level of resources.
Our audits show that councils can improve their financial reporting processes, as highlighted in the following insights.
Timeliness of draft financial reports and performance statements
Preparation of financial reports and performance statements
In 2023–24, 31 of 79 councils (39 per cent) submitted their draft financial reports and performance statements for audit within the agreed timelines, marking an improvement from the previous year where only 22 councils (28 per cent) did so.
However, the sector can still improve their timeliness: 48 councils were late with providing drafts to audit, with delays from up to 7 days to more than 4 weeks.
VAGO assigns audit teams to council audits for specific timeframes. When councils submit necessary information – such as the audit requests, the draft financial report and performance statement – on time, the audit process runs smoothly. However, if there are delays, the audit process can become stop-start in nature. Delays in multiple audits can lead to an ever-increasing backlog, increasing the risk of not achieving timelines across the sector. By submitting high-quality information requests and reports on time, councils can ensure a smoother and efficient audit process.
Figure 2: Number of councils that submitted their draft financial reports and performance statements late, by days late compared to prior year
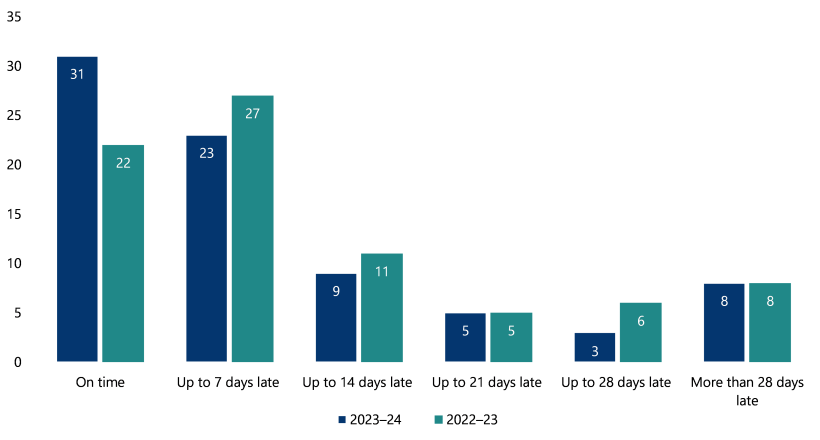
Source: VAGO.
These delays continue to indicate challenges with the maturity and effectiveness of councils financial reporting processes and resource availability.
Enhancing the quality of financial reporting
Increase in reported prior period errors
Ideally, councils will prepare and submit for audit a financial report and performance statement that is free of adjustments and errors. Councils must fix any material errors we detect before we can issue a clear audit opinion.
From time to time, financial reports may include a restatement to correct a prior-year error. Councils will restate comparative figures in the current year financial report if prior-period errors are material. Councils may also elect to restate comparative figures even where the prior-period error is not material.
In 2023–24, 17 of 78 councils processed a prior-year error, compared to 2022–23 when 6 councils restated figures. Of these, 5 councils addressed prior-year errors in both years. All council cohorts had instances of prior-period errors.
Prior-period errors
Prior-period errors are omissions from, and misstatements in, the entity’s financial report for one or more prior periods arising from a failure to use, or misuse of, reliable information that:
- was available when financial reports for those periods were authorised for issue
- could reasonably be expected to have been obtained and taken into account in the preparation and presentation of those financial reports.
Such errors include the effects of mathematical mistakes, mistakes in applying accounting policies, oversights or misinterpretations of facts, and fraud.
Figure 3: Number of councils that disclosed a prior-year error and restated comparative figures, by cohort
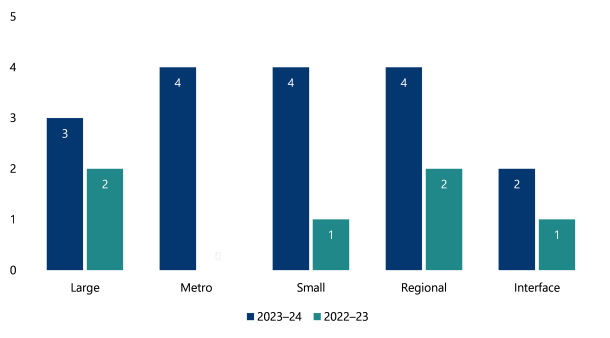
Source: VAGO.
Council cohorts
LGV classifies councils into 5 local government comparator groups:
- A metropolitan council is urban in character and located within Melbourne's densely populated urban core.
- An interface council is one of the 9 municipalities that form a ring around metropolitan Melbourne.
- A regional council is urban and partly rural in character.
- A large shire is a municipality with more than 16,000 inhabitants that is predominantly rural in character.
- A small shire council is a municipality with fewer than 16,000 inhabitants that is predominantly rural in character.
Most restatements relate to property, infrastructure assets, plant and equipment (PIPE), which account for 93 per cent of the sector's total assets. The errors stem from:
- ineffective internal processes
- poor record keeping
- a disconnect between finance teams and other teams, such as asset management and planning.
When a council undertakes an independent valuation of their assets, issues regarding the completeness and accuracy of the fixed asset register come to light. The register often:
- includes assets not controlled by the council
- excludes assets controlled by the council.
Delays in recognising developer-contributed assets in the correct reporting period are another common cause of prior-period errors across the sector.
These issues are repeated year after year at some councils. There is opportunity for the sector to come together to share knowledge and insights, reducing the risk of material errors occurring and recurring. Establishing working groups to share knowledge and refine internal processes may be an effective solution.
The rising number of material errors highlights the need for councils to strengthen internal relationships and the level of communication between teams involved in asset management and transactions.
Necessary adjustments to financial reports
Financial reports provide critical information for decision-making. Correcting errors ensures that decisions are made based on reliable information.
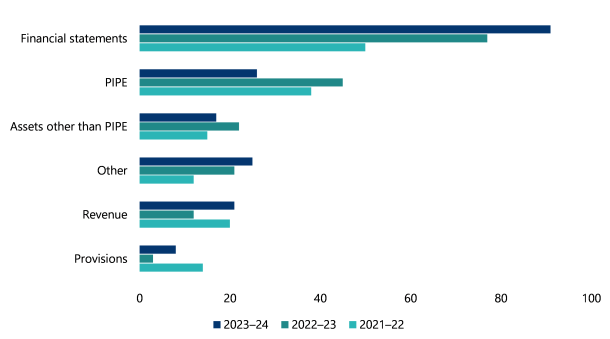
In 2023–24, we identified 188 adjustments, slightly up from 180 in 2022–23, highlighting the need for councils to improve quality assurance processes.
We continued to find:
- issues with the quality of disclosures – either incomplete or missing content
- errors in PIPE balances although there was a reduction compared to the previous year
- issues with revenue recognition, including grant funding.
Figure 4: Adjusted errors by category for 2021–22, 2022–23 and 2023–24
Source: VAGO.
Efforts by councils to streamline financial reports
Each year, LGV releases a model financial report and performance statement to help councils meet their financial reporting requirements.
LGV, together with Local Government Finance Professionals (an incorporated association known as FinPro), consider feedback from various stakeholders to enhance the model financial report and performance statement.
Model accounts provide comprehensive guidance and are designed to cover all potential disclosures a council might need. Councils can tailor their financial report by not including disclosures that are not material to their specific circumstances. This approach helps create more concise, relevant, and easier to understand reports.
Over the years, financial reports have grown longer and more complex, often not meeting user’s needs. This can make it difficult for readers to find key information. Streamlining financial reports addresses these challenges by simplifying the content, focusing on material information and ensuring compliance with laws, regulations and accounting standards.
In the local government sector, streamlining is especially important because of the diverse range of primary users, such as ratepayers, service recipients and creditors. Many of these users may lack financial expertise, so reports must be clear, concise, and focused on material details to ensure accessibility.
Last year, we recommended that councils streamline their financial reports to better cater to stakeholders' needs and improve overall transparency. Figure 5 shows 16 of 79 councils have taken the first step in streamlining their financial report.
Figure 5: Number of councils that streamlined their financial report by cohort, 2023–24
| Cohort | Number of councils per cohort | Number of councils that streamlined their financial report |
|---|---|---|
| Metropolitan | 22 | 2 |
| Interface | 9 | 3 |
| Regional | 10 | 4 |
| Large shire | 19 | 6 |
| Small shire | 19 | 1 |
| Total | 79 | 16 |
Source: VAGO.
There is still an opportunity for the whole sector to embrace streamlining to improve efficiency and make financial reports easier for users to understand.
Advances in performance statement reporting
Reduction in errors requiring adjustments
Under the Local Government Act 2020, councils must prepare performance statements.
A council’s performance statement evaluates service performance, sustainability and financial outcomes. It requires councils to explain significant variations by comparing actual results to prior year figures, current-year targets and forecasts.
Councils prepare these statements using a model template released by LGV.
LGV improved the format and structure of the 2023–24 model performance statement, leading to better-quality performance statements being submitted for audit.
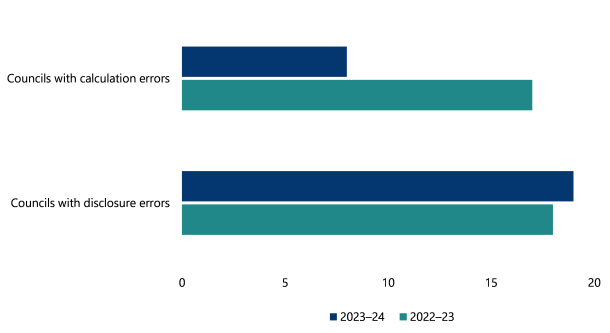
In 2023–24, there were 50 performance statement adjustments, down from 67 in 2022–23. The number of councils with errors requiring adjustments dropped to 27, compared to 35 in the previous year.
Figure 6: Number of councils with performance statement adjustments by error type for 2022–23 and 2023–24
Source: VAGO.
In 2023–24, calculation errors dropped by 62 per cent. The errors were mainly caused by:
- using outdated data for non-financial indicators
- misunderstanding what should be included or excluded in performance measure calculations.
Disclosure errors increased slightly compared to the prior year due to:
- failing to ensure compliance with the model performance statement's mandatory sections, often due to reliance on staff from other business units
- weak internal quality assurance processes
- inadequate or unclear variance analysis explanations.
Inconsistencies in the reporting of unrestricted cash
Councils’ annual reports include various audited and unaudited performance indicators based on the Local Government Performance Reporting Framework developed by LGV. The performance statement includes 28 indicators that we are required to audit.
In 2023–24 we noted that councils started to include commentary on indicator 'L2 – Unrestricted cash compared to current liabilities', explaining what they considered to be their ‘true’ unrestricted cash. The defined term set by LGV excluded term deposits greater than 90 days, but some councils believe these deposits are generally unrestricted and should be included in the calculation.
Quoting different performance outcomes can create inconsistency and confusion for readers assessing council or sector performance. We recommend that LGV reassess the relevance, meaning and practicality of the required reporting indicators and make any necessary adjustments.
Case study 1: Unrestricted cash
Unrestricted cash
'L2 – Unrestricted cash compared to current liabilities', which measures the cash available without restrictions, is a reporting indicator required by the Local Government (Planning and Reporting) Regulations 2020.
But the restricted cash definition used for this indicator does not align with the definition in the AASB Accounting Standards.
Figure 7: Internal flexibility and external restrictions
| The Regulations | AASB 107 |
|---|---|
| Includes cash set aside by councils for specific purposes, which can be reallocated or cancelled if priorities change | Includes only cash restricted by legal, contractual, or regulatory requirements, which cannot be altered by councils |
| Covers internally earmarked funds, such as those for future projects | Focuses on externally restricted funds, such as grants or agreements |
| Defines restricted cash broadly, allowing flexibility for council decisions | Defines restricted cash narrowly, limited to enforceable external restrictions |
Source: Local Government Better Practice Guide: Performance Reporting Indicator Guide, AASB 107 Statement of Cash Flows.
Improving overall council reporting processes
Greater focus on realistic planning
A greater focus on realistic planning is needed. Delays in preparing the financial report, performance statement and supporting schedules, along with an increase in the number of councils recording prior-period errors show that current plans lack detail, set unrealistic target dates, or do not have enough resources to support the process.
Impact of staff turnover on reporting
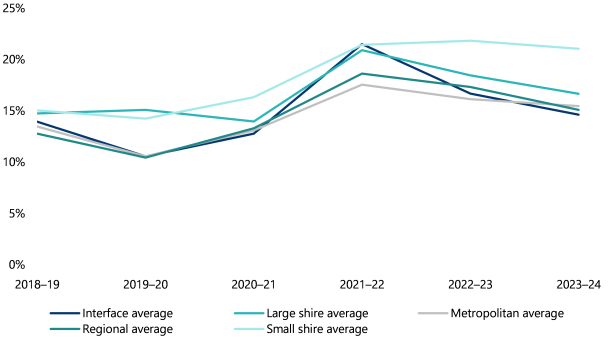
In 2023–24 the local government sector continued to experience lower staff turnover. The sector’s average staff turnover was 16 per cent, down from 18 per cent in 2022–23.
Figure 8 shows all council cohorts experienced a slight decline in staff turnover.
Figure 8: Average staff turnover by council cohort for 2018–19 to 2023–24
Source: VAGO.
Small shire councils experienced a 21 per cent turnover rate, higher than the sector average. For the past 6 years, their staff turnover has consistently exceeded the sector average.
Staff turnover impacts a council’s ability to prepare financial reports and performance statements, due to:
- the loss of corporate knowledge
- the time required to replace and train staff
- new staff who may be unfamiliar with the council’s legislative reporting obligations, policies and procedures.
Delays in meeting legislative timelines may reduce stakeholder trust and confidence in the council
Councils’ legislative obligations
It is important that councillors and their audit and risk committee (which consists of councillors and a majority of independent members):
- have a clear understanding of their role and responsibilities
- are familiar with the requirements of the Act and the associated regulations
- continue to enhance their knowledge and skills.
The Act requires councils to hold a meeting, open to the public, to consider the annual report within 4 months of the financial year's end. In a general council election year, such as 2024, it must be held before the election day. The Act also states an annual report must contain:
- a report of operations
- the audited financial report
- the audited performance statement
- a copy of the auditor's report on the financial report
- a copy of the auditor's report on the performance statement.
General council elections were held on 26 October 2024. The sector had until 25 October 2024 to present their annual reports. While the caretaker period commenced at 12pm on 17 September 2024, LGV advised:
- councillors could meet and adopt their financial report and performance statement during the car-taker period as the matter is considered routine business
- councils could present their annual report at a meeting open to the general public during the car-taker period.
2023–24 process insights
Eighteen of 79 councils did not present a compliant 2023–24 annual report at a council meeting open to the public by 25 October 2024. In comparison, 20 of 79 councils were non-compliant in 2022–23.
Several factors contributed to the non-compliance including:
- some councillors choosing not to meet after 17 September 2024 due to the general council election
- delays in preparing and submitting their financial report and performance statement to audit within agreed timeframes, which impacted the timing and completion of the audit
- the initial scheduling of the audit based on available audit resources.
Our audit process revealed that the sector has a varied understanding of its financial reporting obligations under the Act, including what needs to be presented in annual reports at public council meetings.
In our Results of 2022–23 Audits: Local Government report, VAGO recommended that LGV or the Municipal Association of Victoria (MAV), or both in partnership, develop and deliver a structured training program to improve the governance arrangements over financial and performance reporting.
MAV delivered a 2-day training program for Mayors and Deputy Mayors in December 2024 with a focus on the mandatory induction requirements per the Act and Regulations. It now plans to develop a councillor development program, comprising various modules, to provide councillors with opportunities to further develop their skills to meet the requirements of the Act and of good governance practices more broadly. One of the first modules to be developed is ‘Being an effective audit and risk committee member’.
The recent council elections resulted in a change in councillors at most councils, presenting an opportunity for LGV to provide regular education.
Timely annual reports are important for stakeholders, such as Parliament, ratepayers and suppliers, as they provide up-to-date information about a council’s financial outcomes and performance. Late and/or incomplete annual reports may affect stakeholders trust and confidence in the council.
At the time of the 26 October 2024 general elections, ratepayers across 18 councils voted without access to information that should have been publicly available per the Act.
Recommendations
Councils
We recommend for councils that did not prepare draft financial reports or performance statements by the timelines agreed with their auditor:
- assess their resources and expertise to confirm they can meet reporting obligations. If additional resources or support are required, they should explore how to secure the necessary support to successfully fulfill the requirements of the Local Government Act 2020
- strengthen their annual report plan to better align with legislative obligations, focusing on:
- clear task allocation and achievable timelines
- enhanced coordination with other business units
- engaging with subject matter experts
- quality assurance processes.
We recommend that councils take the lead in the formation of a ‘developer non-cash contribution’ working party to create guidance materials that will strengthen internal processes. Councils could also consider hosting workshops to support the sector in applying the guidance effectively.
LGV
We recommend that LGV formally advise and remind the councils of their annual reporting obligations.
We recommend that LGV reassess the appropriateness of the mandated:
- audited performance indicators included in the performance statement
- unaudited performance indicators included in the report of operations section of councils' annual report.
MAV
MAV develop and deliver the intended councillor development program with input from LGV, as applicable.
2. Financial analysis
Snapshot
Fifty councils recorded a surplus this year, compared to 74 last year. The sector surplus this year was lower, largely because of when annual financial assistance grants were paid. While rates, charges and interest income all grew, growth in spending outpaced this.
The sector's ‘adjusted underlying result’ measures councils’ ability to generate operating surpluses from their regular business. Over the past 6 years this result has fallen from plus 4 per cent to minus 15 per cent. This negative trend suggests some councils are becoming less financially sustainable and will need to adjust their revenue and expenditure policies.
The sector’s asset base grew by $3.461 billion through new acquisitions, though it underspent its capital works budget again; by 17 per cent this year. Revaluations also lifted the value of physical assets by $4.934 billion.
Cash and other financial assets were lower at 30 June 2024, but there was sufficient working capital for the short-term. Almost all councils reported positive operating cash inflows, although 5 smaller councils had net cash outflow positions. Total liabilities remained stable at $5.454 billion, with a slight increase in borrowings to fund some capital works programs.
Despite higher own-sourced revenue, the sector reported a lower net result because it did not receive financial assistance grants in advance
Financial performance snapshot
A council generates a surplus when total revenue and income exceed total expenses or a loss when total revenue and income is lower than total expenses. The surplus or loss is referred to as the net result in a council’s financial report.
In 2023–24, Victorian councils reported a combined surplus of $1.755 billion.
| The sector reported … | which is a … | from … |
|---|---|---|
| $13.520 billion in revenue and income | 2.4 per cent decrease | $13.849 billion in 2022–23. |
| $11.765 billion in expenses | 4.4 per cent increase | $11.272 billion in 2022–23. |
Source: VAGO.
Lower net result achieved
The sector’s combined net result, or surplus of $1.755 billion was $0.822 billion, or 31.9 per cent, lower than the surplus in 2022–23. The decline in revenue and income, along with the increase in expenses, caused the overall decrease.
Over the past 5 years, the growth in expenses outpaced the increase in revenue and income across 3 of these years. During that period councils:
- experienced significant variability in the timing of financial assistance grant funding from government
- dealt with the operational and financial impacts of COVID-19.
In 2023–24 councils did not receive their 2024–25 financial assistance grants in advance, whereas in 2022–23 councils received all of their 2023–24 financial assistance grants in advance. As a result, only 50 councils reported a surplus this year, compared to 74 councils last year. This shows how the timing of government financial assistance grants impacts key financial results.
Figure 9: Number of councils to generate a net surplus or loss in 2022–23 and 2023–24
| 2023–24 | 2022–23 | |
|---|---|---|
| Net surplus | 50 | 74 |
| Net loss | 28 | 5 |
| Total number of councils | 78 | 79 |
Note: One council yet to finalise their 2023–24 financial report.
Source: VAGO.
Adjusted underlying result deteriorates
To remain financially sustainable, councils must meet current and future expenditure requirements from revenue earned, absorb foreseeable changes and materialising risks and manage the impact from these factors to changing revenue and expenditure requirements. Councils must generate enough money to deliver community services.
In 2023–24, the sector’s adjusted underlying result deteriorated to negative 15.0 per cent, compared to 0.3 per cent in 2022–23. Over the past 6 years, it has dropped from 4 per cent to a negative 15 per cent. However, the timing of government financial assistance grants affects this trend, especially when the grants are received in advance. Adjusting for this timing and allocating the grants to their intended financial year, rather than the year they were received, the decline becomes much less significant, increasing in 2023–24.
Adjusted underlying results
The adjusted underlying result indicator measures a council’s ability to generate a surplus from its ordinary course of business (excluding capital receipts) to fund its capital spending.
Figure 10: Councils' adjusted underlying results and net results from 2018–19 to 2023–24
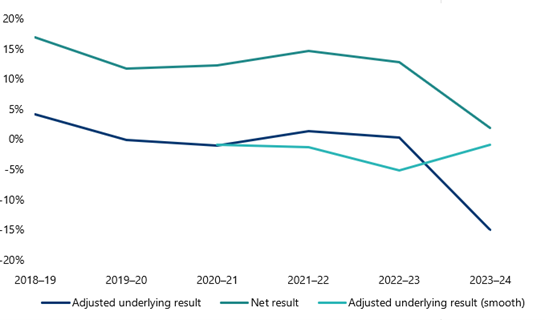
Note: The adjusted underlying result (smoothed) is presented from 2020–21.
Source: VAGO.
Assuming the financial assistance grants were received in the financial year they were intended, in 2023–24:
- only 8 councils would report a net result loss in 2023–24, compared to 28, of which:
- 5 are small councils
- 2 are large councils
- 1 is an interface council.
- 43 councils would report a negative adjusted net result, compared to 63 councils.
Smaller councils tend to rely more heavily on the financial assistance grants. Changes to the timing and amount paid in advance can impact their financial performance and position at balance date.
A long-term negative trend in this indicator can suggest a council is not managing its expenditure, growing its own-source revenue, or managing the viability of its service programs, which poses longer-term risks to financial sustainability.
Councils have increased their own-source revenue
Revenue and income streams
Rates and charges are the sector’s main source of revenue and income, followed by government grants, with other revenue and income sources contributing thereafter.
Rates and charges revenue account for at least 50 per cent of the sector’s total revenue and income each year.
Figure 11: Breakdown of councils’ revenue and income by category for 2022–23 and 2023–24
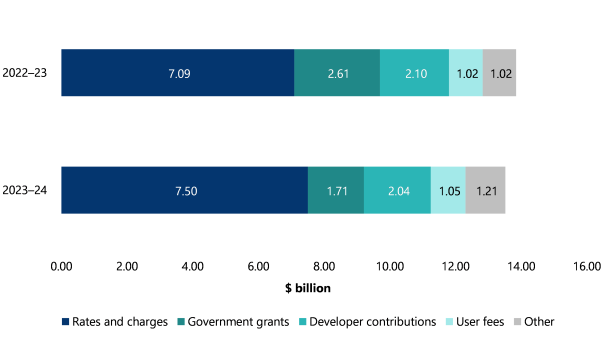
Source: VAGO.
Movement in revenue and income from the prior year
| In 2023–24 councils’ received … | which is a … | because … |
|---|---|---|
$7.50 billion in rates and charges revenue
| increase of $0.413 billion or 5.8 per cent
|
|
$1.71 billion in government grants
| decrease of $0.907 billion or 34.7 per cent
|
|
$0.343 billion in interest income
| increase of $0.119 billion or 53.1 per cent
|
|
Government grant funding was lower due to the timing of grant payments
Government grant funding
Councils get annual funding from the Australian and Victorian governments.
How much they receive and when varies each year, depending on the governments’ program initiatives or capital projects. Figure 12 shows funding in 2023–24 was at its lowest level over the past 6 years.
Figure 12: Source of government funding 2018–19 to 2023–24
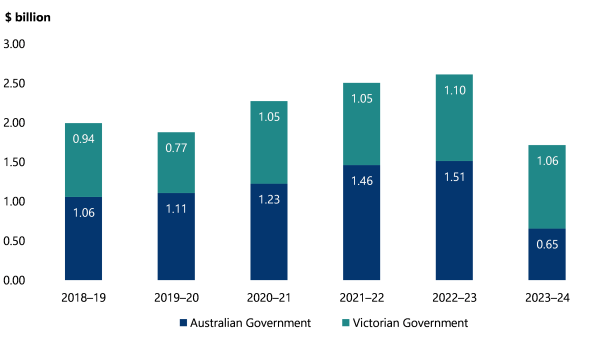
Source: VAGO.
Australian Government financial assistance grants are treated as income when received. Figure 13 shows the variability in funding, including the percentage paid in advance, over the past 4 years.
Figure 13: Percentage of financial assistance grants paid in the year to which the funding relates and paid in advance by year
| Financial assistance grants | 2023–24 (%) | 2022–23 (%) | 2021–22 (%) | 2020–21 (%) |
|---|---|---|---|---|
| Percentage of funding paid in the year to which the funding relates | 0 | 25 | 50 | 50 |
| Percentage of funding paid in advance of the financial year to which the funding relates | 0 | 100 | 75 | 50 |
| Total | 0 | 125 | 125 | 100 |
Source: VAGO.
In June 2023, the Australian Government paid 100 per cent of the 2023–24 financial assistance grants to councils in advance. The payments totalled $0.746 billion.
In June 2024, the Australian Government paid 85 per cent of the 2024–25 financial assistance grants to the Victorian Government for transfer to the 79 Victorian councils. But the Victorian Government did not transfer the $0.669 billion funding to councils until 5 July 2024.
Most expense categories increased
Council expenses
While total expenses grew by 4.4 per cent in 2023–24, this was lower than the prior year when expenses increased by 9.6 per cent.
As Figure 14 shows, the 3 main council expenses are:
- employee costs
- materials and services
- depreciation and amortisation.
Figure 14: Breakdown of councils’ expenses by category for 2022–23 and 2023–24
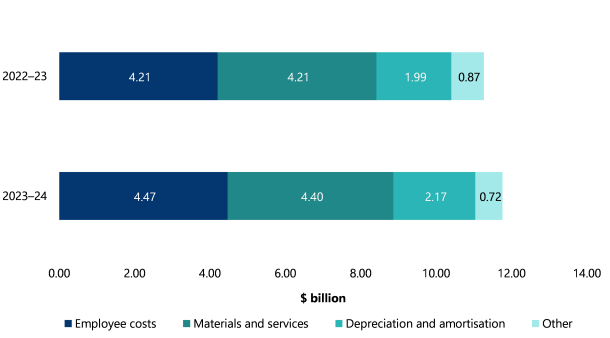
Source: VAGO.
Employee expenses grew by $0.266 billion, or 6.3 per cent, because of wage adjustments under new enterprise bargaining agreements (EBA) and the use of labour hire services to backfill vacant roles. In 2023–24, 17 councils implemented new EBAs, while the remaining councils made annual adjustments under their existing agreements.
Materials and services increased by $0.187 billion or 4.4 per cent due to inflationary pressure and the level of activity.
There was also a $0.183 billion or 9.2 per cent increase in depreciation and amortisation because of higher property, infrastructure assets, plant, and equipment balances.
Over the past 5 years total expenses have increased at a rate above the annual rate cap increase. In 2022–23 expenses grew by 9.6 per while the approved rate cap increase was 1.75 per cent. As rates and charges revenue represent at least 50 per cent of sector’s total revenue and income each year, councils need to continually review their service offerings and fees levied to ensure finances remain sustainable.
Figure 15: Growth in total expenses compared to approved rate cap increase 2019–20 to 2023–24
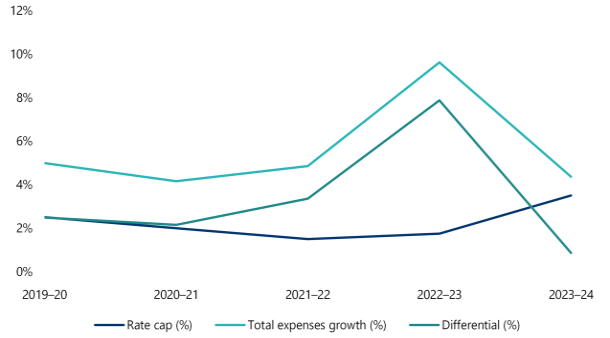
Source: VAGO.
Councils have experienced a high inflationary period post the height of the COVID-19 pandemic.
Rate capping
Rate capping has been in place since the 2016–17 financial year. Rate capping limits the maximum amount a council can increase its average rates in a year without seeking approval for a higher cap.
Each year the Minister for Local Government sets the average rate cap for the following rating year by general order.
A council may apply to the Essential Services Commission for a higher cap. Councils have until 31 March to apply for a higher cap with respect to the next rating and financial year. No councils applied for a higher rate cap for the period 2020–21 to 2024–25.
The total amount shown on an individual rate notice includes general rates, municipal charges, and other charges and levies. The rate cap only applies to general rates and municipal charges.
A council is able to increase other charges and levies at a percentage higher or lower than the rate cap percentage.
The increase in non-current assets caused the growth in the financial position again this year
Financial position snapshot
On 30 June 2024, councils’ net assets totalled $144.785 billion. This is a $6.812 billion increase, or 4.9 per cent, from 2022–23.
| The sector reported … | which is an increase of … | from … |
|---|---|---|
| $150.239 billion in total assets | $6.834 billion, or 4.8 per cent | $143.405 billion on 30 June 2023. |
| $5.454 billion in total liabilities | $0.022 billion, or 0.4 per cent | $5.432 billion on 30 June 2023. |
Increase in assets
Councils’ total assets increased by $6.834 billion in 2023–24 because the value of the PIPE assets grew by $7.125 billion.
The overall increase was partially offset by a $0.816 billion reduction in cash and other financial assets.
Cash reserves decline but remain sufficient to meet short-term obligations as majority of councils continue to generate cash inflows
Decrease in cash balances
The sector's cash balances, consisting of cash assets and other financial assets (such as, term deposits), decreased by $0.816 billion in 2023–24.
Figure 16: Composition of sector cash balances from 2019–20 to 2023–24 ($ billion)
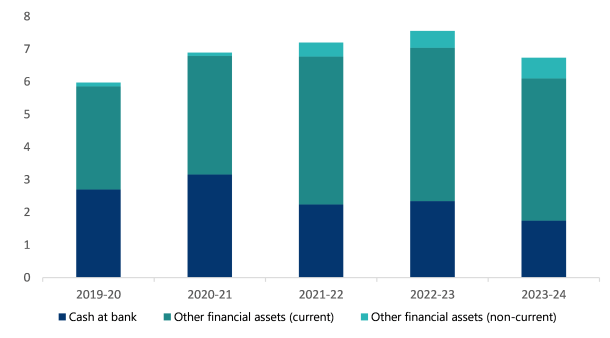
Source: VAGO.
The decrease in cash reserves is due to the draw down of cash to meet council operating costs and capital expenditure. At 30 June 2023 cash reserves included the 2023–24 financial assistance grants paid in advance.
Councils received 85 per cent of their 2024–25 financial assistance grants in July 2024, there was no advance payment in 2023–24, unlike the prior year.
Councils had positive cash inflows from operating activities despite not receiving funding in advance
Despite the 2024–25 financial assistance grants not being paid in advance, 73 councils continued to generate net cash inflows from operating activities in 2023–24. This means that most councils were able to fund their daily operations in the current year.
Five small councils reported net cash outflows from operating activities. Had they received the 2024–25 financial assistance grants in advance like prior years, they would have reported net cash inflows from operating activities.
The small councils are significantly dependent on the government grants, including the financial assistance grants. Where the growth in expenditure outpaces the increase in their revenue and income over a number of financial years, financial sustainability risks will need to be actively managed over the short-term and long-term.
If we remove cashflow items related to capital income inflows, such as capital grants and developer contributed cash (as these will be spent on capital items in the future), the sector is largely cashflow positive. The small and large council cohorts, the exception, given their reliance on government grants.
Figure 17: Councils with negative operating cash after removing capital items
| Cohort | Number of Councils | Percentage of cohort |
|---|---|---|
| Metropolitan | 0 | 0% |
| Interface | 1 | 11% |
| Regional | 1 | 10% |
| Large shire | 6 | 32% |
| Small shire | 14 | 74% |
Source: VAGO.
Councils are generating positive operating cash, meaning they have a surplus from their day to day operations. Much of this cash is typically reserved for capital works.
Due to underspending in capital budgets and advance payments received in prior years, councils have built up high cash balances, particularly in the interface council cohort.
Liquidity remains strong for the majority of councils
At 30 June 2024, the sector’s average liquidity ratio remained positive at 2.37:1 (slightly below 2.44:1 in the prior year). This means the sector’s cash and other liquid assets are more than double its short-term liabilities.
Liquidity ratio
This measures an entity’s ability to pay existing liabilities in the next 12 months.
A ratio of 1 or more means that an entity has more cash and liquid assets than short-term liabilities.
Figure 18: Liquidity ratio by cohort, 2019–20 to 2023–24
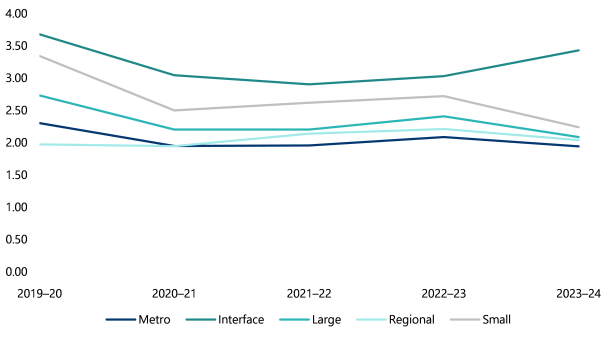
Source: VAGO.
An analysis of the liquidity ratio at a council level reveals 6 councils had a ratio less than 1:1 at 30 June 2024 compared to just one council in the prior year. These councils will need to actively manage their cash reserves.
Debt levels remain low
Liabilities
Liabilities remained stable at $5.454 billion in 2023–24, compared to $5.432 billion in 2022–23.
This slight increase was driven by higher borrowings, which rose to $1.395 billion (a $0.124 billion or 9.8 per cent increase), offset by a $0.197 billion or 20.7 per cent decrease in unearned revenue – funds received in the previous year for work completed during the current year.
The sector continues to maintain historically low levels of debt for 2023–24. The debt ratio has remained constant at 0.01 over the past 5 years, reflecting a stable financial position.
Debt ratio
This is a longer-term measure that compares all current and non-current interest-bearing liabilities to total assets.
It complements the liquidity ratio, which is a short‑term measure. A low ratio indicates less reliance on debt to finance the assets of an organisation.
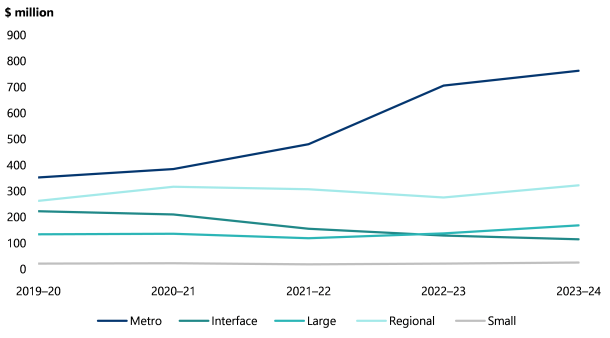
The metropolitan councils have increased their borrowings as can be seen in Figure 19. This is in line with the increase in their capital works programmes. Once built, new assets such as aquatic centres, enable councils to generate own-source revenue through user fees.
All other cohorts have maintained their low debt levels.
Figure 19: Total debt by cohort 2019–20 to 2023–24 ($ million)
Source: VAGO.
Internal financing and indebtedness indicators
The internal financing indicator measures a council’s ability to finance capital works from its operating cash flows. The higher the percentage, the greater the ability for the council to finance capital works from its own funds.
The indebtedness indicator assesses whether councils can service their debts and meet their repayment obligations using their own-source revenue. The lower the ratio, the less revenue the council is required to use to repay its total debt.
Own-source revenue
Own-source revenue takes total revenue and income and excludes income streams over which councils have limited control. These are government grants and developer contributions.
Figure 20 shows that over the past 5 years:
- the internal financing indicators has consistently exceeded 1, except for 2023–24
- the indebtedness indicator has remained at around 0.2.
Figure 20: The sector's internal financing indicator and indebtedness indicator results from 2019–20 to 2023–24
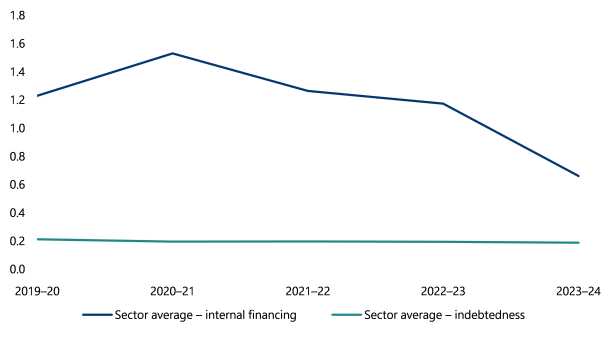
Source: VAGO.
The decline in the internal financing indicator is due to no advance payment of financial assistance grants from government. In prior years councils received funds in advance of the financial year in which the funding was intended. The grants are ‘untied’, councils can use the grants as required by local needs.
Capital investment and valuation adjustments driving increase in assets
Increase in fair value of property and infrastructure assets contributing to growth in total assets
The real growth in assets is smaller than overall increase in PIPE.
Of the $7.125 billion increase in PIPE assets in 2023–24, approximately $4.934 billion came from revaluation fair value adjustments.
| PIPE value increase mainly driven by … | and were mainly offset by … |
|---|---|
| $4.934 billion uplift in value following the revaluation of councils’ land, buildings and infrastructure assets | $2.056 billion of annual depreciation expenses. |
| $3.461 billion spent on new PIPE |
Seventeen councils would have reported a decline in their asset values in the absence of the revaluation fair value adjustment.
The fair value adjustment reflects higher current replacement costs and market price adjustments. The increase does not represent real growth in the form of new assets. But the higher fair values need to be considered by councils from a budgeting perspective when determining the planned level of asset expansion, renewal, upgrade or replacement works.
Capital expenditure higher than prior year, underspend continues
Capital expenditure trends
Figure 21 compares the sector’s budgeted capital expenditure to its actual capital expenditure for 2019–20 to 2023–24 and reveals a trend of underspend.
In 2023–24, the sector’s actual capital expenditure totalled $3.461 billion, which was 17 per cent ($0.705 billion) below budget. In the prior year the underspend was 26.2 per cent.
Councils, prior to approving the planned capital spend for the next financial year, should consider the impact of:
- carry-forward projects on the proposed capital works program
- current market conditions on project costs and project commencement and completion dates.
Figure 21: Budgeted versus actual capital expenditure and percentage underspend from 2019–20 to 2023–24
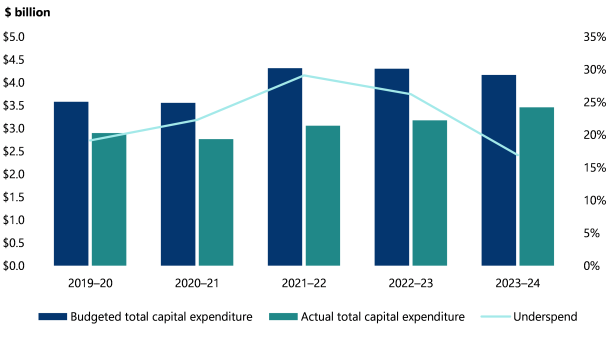
Source: VAGO
Councils can still improve their financial planning for capital works
The sector has shown improvement in meeting budgeted capital expenditure, but further progress is needed, particularly by those councils where the underspend is more than 40 per cent.
Figure 22: Number of councils in each category of underspend
| Underspend % | 2023–24 | 2022–23 |
|---|---|---|
| Met or exceed budget (0%) | 22 | 16 |
| 0–15% | 13 | 7 |
| 15–40% | 31 | 39 |
| More than 40% | 12 | 17 |
Source: VAGO.
The interface council cohort were able to significantly reduce the level of underspend.
Figure 23: Average underspend by cohort, 2019–20 to 2023–24
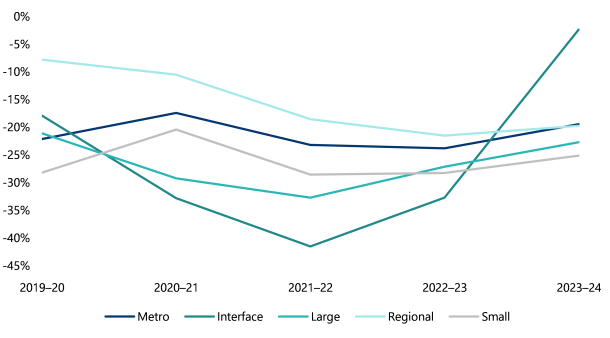
Source: VAGO.
Capital replacement and renewal gap indicators
Capital replacement and renewal gap ratios are longer-term measures that assess the sector’s spending on infrastructure assets compared to depreciation. A result higher than one indicates that spending is faster than depreciation rates.
Capital replacement ratio
This ratio indicates if a council is investing enough in asset replacement. A ratio above 1 means spending exceeds asset wear, a positive sign. Below 1 suggests insufficient investment, risking aging infrastructure.
Capital renewal gap ratio
This ratio focuses on how well the council is renewing its assets to keep them in good condition. It compares how much the council actually spends on renewing or repairing assets versus how much it should be spending based on the condition of those assets. If the ratio is high, it means the council is doing a good job of renewing assets. A lower ratio means the council is falling behind in keeping up with needed repairs and renewals, which can lead to increased maintenance costs and asset failures in the future.
The sector’s average capital replacement ratio and renewal gap ratio over the last 5 years remained above one (see Figure 24). However, this indicator does not consider councils’ planned capital expenditure. The underspend that is occurring indicates spending on asset expansion, renewal, upgrade or replacement may not be keeping pace with the needs of the community.
At 30 June 2024 the sector’s:
- average capital replacement ratio was 1.68
- average capital renewal gap ratio was 1.15.
Figure 24: The sector’s average capital replacement and renewal gap ratios from 2019–20 to 2023–24
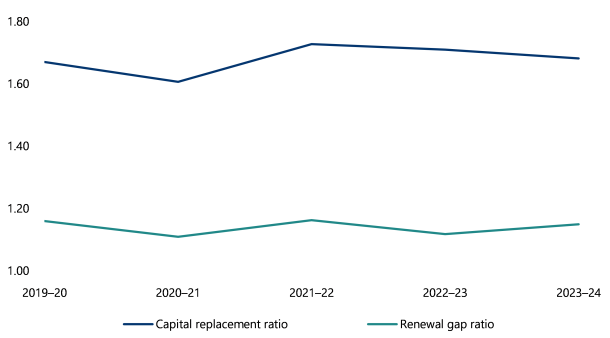
Source: VAGO.
Population growth will place extra demand on existing infrastructure assets and will need to be considered as councils set future capital expenditure budgets while considering the council’s 10-year financial plan.
3. Internal controls and financial reporting issues
Snapshot
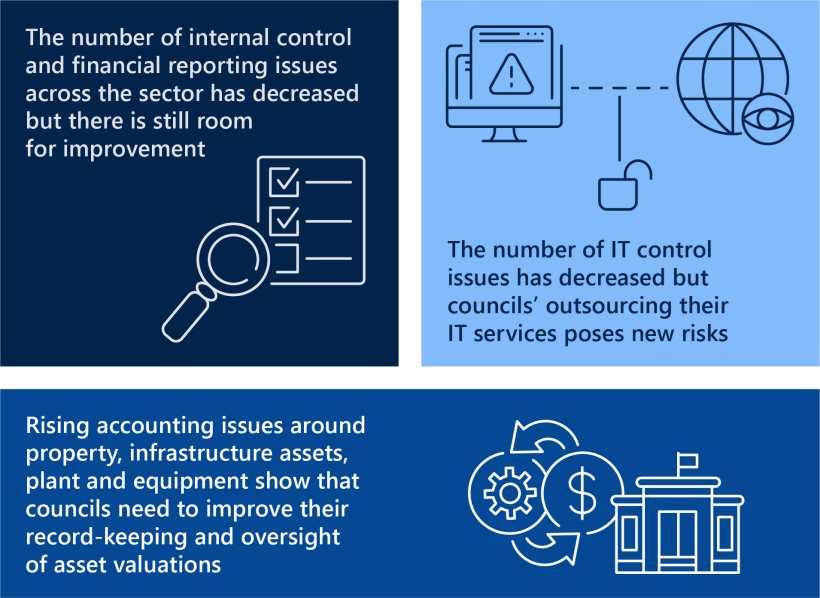
Councils have adequate internal controls for preparing reliable financial reports and performance statements, but there is room for improvement.
Key areas that need attention include information technology (IT) controls, asset management and oversight of asset valuations.
The sector is not as prepared as it should be for the AASB 13 Fair Value Measurement amendments, which will impact financial reports for the first time in the 2024–25 financial year. This could affect the timely preparation and finalisation of financial reports. We encourage councils to prioritise preparations for these amendments in advance of year-end.
Councils’ internal controls remain adequate for reliable reporting but there are areas for improvement
Internal control snapshot
Councils must have an effective internal control system to keep proper accounts and records.
We assessed if councils' internal controls, which include people, systems and processes allow them to prepare reliable financial reports and performance statements.
Overall, councils’ internal controls remain adequate for reliable reporting. But there are areas for improvement with respect to IT controls, asset management and the oversight of asset valuations.
Communicating internal control and financial reporting issues
We communicate any significant issues identified during our audit to the council’s management and its audit and risk committee, in line with the requirements of the Australian Auditing Standards. This includes:
- raising new issues
- updates on unresolved issues we raised in a prior period.
Councils can strengthen their internal controls and financial reporting processes by promptly addressing the issues we raise, with a focus on prioritising higher-risk matters.
New and unresolved issues
There has been an overall reduction in open issues, with 213 in 2023–24 compared to 232 in the previous year. Figure 25 shows:
- new internal control and financial reporting issues went down to 110 in 2023–24 from 136 in the previous year.
- unresolved issues from the previous year went up to 103 in 2023–24 from 96 in the previous year.
The increase in unresolved prior-period issues has been a trend year-on-year over the past 3 years and shows councils are not addressing issues within the recommended time period.
Figure 25: New issues and unresolved prior-period issues from 2019–20 to 2023–24
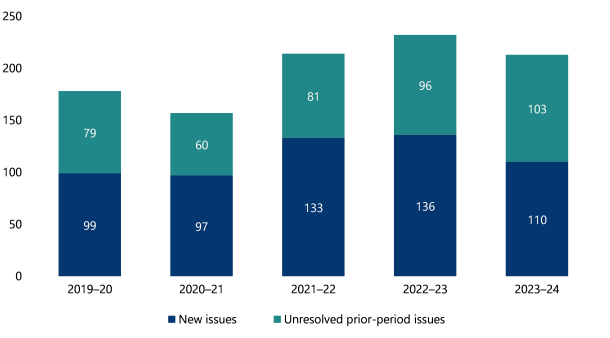
Note: We excluded low-risk issues because we consider these minor issues or opportunities to improve.
Source: VAGO.
Medium and high-risk findings
Figure 26 shows the number of open medium and high-risk issues by category for the past 2 years. IT controls, asset management and asset valuation continue to be key areas for improvement across the sector.
Figure 26: Medium and high-risk findings by category
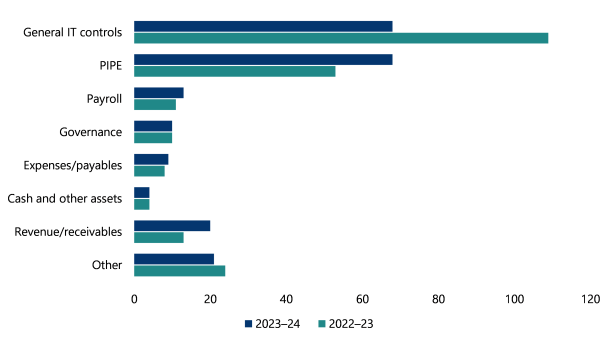
Source: VAGO.
Figure 27 shows the movement in the number of open issues at 30 June 2024 compared to 30 June 2023 for the 3 largest issue categories.
Figure 27: Increase or decrease in open issues since 30 June 2023
| Issue category | Open issues | Number |
|---|---|---|
| General IT control environment | Decreased by | 41 |
| PIPE | Increased by | 15 |
| Revenue/receivables | Increased by | 7 |
Source: VAGO.
We explain the nature of the first 2 issue categories in Figure 27 in the following sections.
Councils strengthen IT control environment, although new risk emerging
Importance of IT controls
IT is integral to an organisation's operations and success. IT systems support critical business processes and store sensitive data.
Effective IT controls reduce the risk of unauthorised access and changes to systems, fraud, error, data manipulation and information theft. They also help protect councils’ data integrity and support reliable financial reports preparation.
There were 68 open IT control issues at 30 June 2024 compared to 109 at 30 June 2023.
Figure 28: Unresolved IT control weaknesses by type for 2022–23 to 2023–24
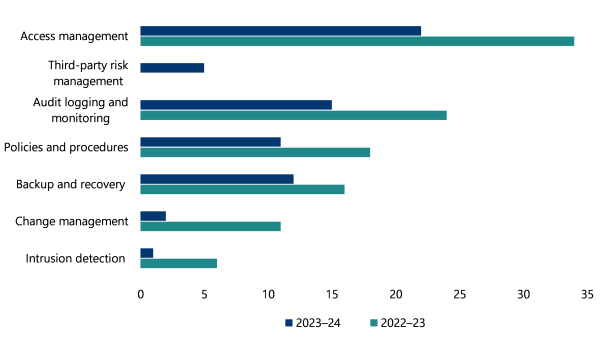
Source: VAGO.
Common IT control deficiencies identified at the councils include the following.
| IT control deficiencies include … | meaning … | This may result in … |
|---|---|---|
| access management | inadequate user access reviews, failure to implement role-based access control, inconsistent or delayed termination of system access and granting of access without proper request or approval were identified. | poor management of user accounts can give individuals more access than needed, increasing the risk of accidental or intentional misuse of systems and data. |
| audit logging and monitoring | system-generated audit logs were not always enabled to track critical and sensitive activities, including (but not limited to) changes to system user access, configurations, reports and master data. Where audit logging is enabled, we observed instances where there is no active monitoring of these logs. | unauthorised or suspicious activities can go unnoticed or undetected that may impact the integrity of financial reports. |
| backup and recovery | processes for backing up critical data and recovering it in the event of an incident, such as a system failure, data corruption, or a disaster (for example, fire, flood, cyber attack) not documented, tested or the backup is irregular and/or incomplete. | loss of critical data, prolonged system downtime, operational disruptions and reputational damage. |
| policies and procedures | there are weaknesses or gaps with policies and procedures put in place to effectively manage day to-day operations. | key internal controls may not operate as intended and be effective in preventing or detecting errors or fraud in a timely manner. |
IT-related issues can take time to resolve, especially if a council needs to work with a system’s supplier to address them. But it is important that they resolve these issues as soon as possible, to ensure the protection and reliability of the data in these systems.
Third-party risk management: an emerging risk
While councils have strengthened their IT control environment in the past 12 months, a new risk has emerged. Councils are moving their accounting systems to third-party cloud services. While providers handle key IT controls, councils are still responsible for making sure these controls are effective to protect their operations and data.
We found 5 councils did not obtain any assurance on the internal controls at their third-party provider for 2023–24. Councils need to actively manage risks when transitioning to or increasing their reliance on third-party IT service providers.
Councils should proactively assess and obtain assurance on the design and operational effectiveness of the key IT controls implemented by third-party service providers. Without this assurance, councils risk exposure to threats such as data breaches, information leaks, loss of sensitive data and service outages. These risks could damage council’s reputation, disrupt service delivery, and affect decision-making due to incomplete or inaccurate financial data. It is essential for councils to assess and ensure the reliability of third-party IT controls to mitigate these risks and safeguard the integrity of their systems.
Management needs to improve its focus on asset record keeping and valuation practices
Councils require connected teams to improve accuracy of asset records
Asset management
Councils build, maintain and renew significant physical infrastructure for their municipalities.
It is essential that they base decisions on acquisitions, upgrades, renewals, replacements, decommissioning and maintenance on accurate and up-to-date information. These decisions must align with the council’s corporate plan, asset management plan and 10-year financial plan.
Since property, infrastructure assets, plant and equipment make up 93 per cent of total assets at every council, it is vital to maintain accurate records supported by a robust asset management system with a strong oversight.
Effective communication and collaboration among internal teams – such as finance, asset management and planning departments (including project managers and engineers) – is essential. These teams must work together to:
- ensure timely recognition or disposal of assets
- incorporate asset condition data when assessing fair value, estimating asset useful lives and calculating depreciation
- plan for and carry out asset valuations
- reduce the risk of financial reporting errors.
Our audits indicate that internal teams at times work in isolation, resulting in recurring issues in asset record keeping and valuations.
Councils that strengthen connections across teams and develop a shared understanding of how each team’s activities contribute to annual financial reporting requirements can improve their reporting processes and save costs.
Asset record keeping
Councils need to improve their processes for asset record keeping. We continue to identify the following issues:
- failure to capitalise new assets, causing delays in applying depreciation and resulting in lower depreciation expense
- delays in recognising developer-contributed assets, leading to:
- lower income
- lower depreciation expenses
- underreported assets
- failure to identify assets the council controls but has not yet accounted for
- inconsistent application of internal controls and procedures, increasing the risk of errors in asset data
- irregular updating of the fixed-asset registers and delayed account reconciliations, causing inaccuracies in financial information about assets.
These issues can also affect the asset valuation process. Inaccurate data may lead management to incorrectly include or exclude assets from valuations, affecting the accuracy of their financial reports.
Asset valuation practices
Councils can record their PIPE assets at cost or fair value to comply with AASB 116 Property, Plant and Equipment. Councils have elected to record these assets at fair value.
AASB 13 Fair Value Measurement defines fair value and details valuation techniques that may be adopted.
Determining an asset’s fair value is complex and requires significant judgement by management. Councils must make numerous assumptions about their assets, often engaging valuation experts or referencing industry indices to support their assessments.
Common asset valuation issues we identify include:
- not conducting regular fair value assessments for all asset classes
- lacking an agreed scope of work, particularly when a council's internal valuer performs the valuation
- failing to document key assumptions underpinning valuations and fair value assessments
- not obtaining or accurately applying condition information to assets
- incorrectly accounting for changes in value, contrary to the requirements of AASB 116.
Councils need to improve their asset valuation practices.
Councils can improve their oversight of asset valuations
Fair value assessments and valuation oversight
Finalising land, building and infrastructure asset valuations before year-end enables timely reporting.
Early engagement with key stakeholders can resolve financial reporting concerns quickly.
A council’s audit and risk committee should review a paper on key accounting issues before 30 June. Without early discussion, the committee’s ability to address issues is diminished.
In relation to asset valuations, the finance team briefing paper should, as a minimum:
| Outline … | by detailing … |
|---|---|
the requirements of the council’s accounting policy with respect to property, infrastructure assets, plant and equipment
|
|
the date of the last independent valuation by asset class
|
|
their approach to assessing the fair value of each class of property, infrastructure assets, plant and equipment in the current year
|
|
likely outcomes for the current reporting cycle
|
|
Update on asset recommendations from our 2022–23 report
Fair value assessments and valuation outcomes provide critical insights into current asset replacement costs, supporting both long-term financial management and effective decision making.
Given the importance of these outcomes, it is critical that the audit and risk committee carefully scrutinises fair value assessments to support sound executive decision-making.
Our Results of 2022–23 Audits: Local Government report included 2 recommendations about asset valuation for all councils (see Appendix H for full recommendation). These were:
1. That finance teams, pre 30 June, prepare and present a paper on asset accounting policies, valuation approach and expected fair value impacts.
2. That audit and risk committees review the finance team’s paper pre 30 June and reassess outcomes post 30 June to ensure valuations remain appropriate.
A large number of councils are yet to address these recommendations.
In 2023–24, 47 finance teams briefed their audit and risk committees on their asset valuation plans and likely outcomes before to 30 June 2024. This represents a significant improvement from the previous year, when only 17 councils took this step. While progress has been made, opportunities for further improvement remain across the sector, particularly for the 32 councils yet to act on the recommendations.
AASB 13 amendments
AASB 13 Fair Value Measurement describes 3 different methods of measuring fair value, they are:
| Method | Basis |
|---|---|
| Cost approach | Current replacement cost reflects the cost of replacing physical assets with their modern equivalents |
| Market approach | Direct comparison with prices and other relevant market information |
| Income approach | Discounted net cash flows over the assets life |
The standard has been amended, effective for the 2024–25 financial year, primarily impacting fair valuation using the current replacement cost valuation technique. These changes allow councils to refine their approach to the fair valuation of PIPE assets, further improving asset accounting, budgeting and planning accuracy.
FinPro has proactively supported the sector with these amendments this year, by delivering training sessions and planning to release a guidance paper with worked examples prior to 30 June 2025.
While these initiatives are beneficial, asset valuations are complex and require sufficient time to plan and collaborate with subject matter experts and other business divisions. Undertaking this work late in the year that the amendments apply provides limited time to navigate and implement the changes effectively. With less than 3 months to 30 June 2025, the sector may not be as prepared as it could be, potentially impacting the preparation and finalisation of the financial reports.
If not already done so, councils must:
- assess the impact of the AASB 13 amendments on the asset classes recorded at fair value using current replacement cost valuation technique
- profile their asset classes, focusing on all material asset classes
- understand and evaluate the characteristics of assets within each asset class to ensure key judgements are appropriately applied
- estimate costs that may not have been considered in past asset valuations such as:
- disruption costs
- site preparation costs
- costs to restore assets of other entities that will be affected should an existing asset be replaced
- consider engaging engineers and or quality surveyors to assist with the estimation of costs
- confirm their valuer’s valuation methodology is aligned with the requirements of AASB 13.
We strongly encourage finance teams to brief key stakeholders and present their analysis and conclusions at an audit and risk committee meeting prior to 30 June 2025.
A council’s audit and risk committee must provide effective oversight of asset valuations, particularly when key management judgements and estimates are reviewed and revised due to changes in the applicable accounting standard.
Recommendations
Councils
We recommend that all councils resolve the open recommendations from the Results of 2022–23 Audits: Local Government report.
We recommend that all councils:
- ensure they have a thorough understanding of the AASB 13 amendments
- update their valuation policy to reflect the impact of the AASB 13 amendments
- consider the impact of the AASB 13 amendments on related entities (such as subsidiaries or joint ventures) where they adopt the same fair value policy
- conduct valuations with careful attention to AASB 13 amendments:
- ensure the valuation methodologies are aligned with the revised standard
- engage assistance where required
- for more contentious areas, engage with valuers or relevant industry sub-groups to stay updated on new practices occurring as a result of the amendments, namely:
- application of economic obsolescence
- how the new areas are being factored into the valuations (for example, disruption costs), problems arising and practical application challenges
- update internal policies and procedures to reflect any changes in processes (for example, changes to using unobservable inputs, benchmarking with others)
- develop a clear communications strategy to brief key stakeholders – including senior management, their audit and risk committee, councillors – on the material changes introduced by the AASB 13 amendments. This should cover the impact on valuation practices, financial reporting, and any new disclosure requirements. Also, where material, impacts to the asset management plan, long-term financial plan, operating and capital expenditure budgets
- engage with their auditors as soon as possible to discuss their impact assessment
- ensure financial report disclosures are aligned based on impact
- keep a record of key discussions and decisions made regarding valuation methodologies, disclosures and changes in accounting policies. This will help in future valuations.
Appendix A: Submissions and comments
Download a PDF copy of Appendix A: Submissions and comments.

Appendix B: Sector context
Appendix C: Audit context
Appendix D: Abbreviations, acronyms and glossary
Download a PDF copy of Appendix D: Abbreviations, acronyms and glossary.
Appendix E: Audit opinions
Appendix F: Internal control and financial reporting issues risk ratings
Download a PDF copy of Appendix F: Internal control and financial reporting issues risk ratings.
Download Appendix F: Internal control and financial reporting issues risk ratings
Appendix G: Financial sustainability indicators
Download a PDF copy of Appendix G: Financial sustainability indicators.
Appendix H: Prior-year recommendations
Download a PDF copy of Appendix H: Prior-year recommendations.