Results of 2023 Audits: Universities
Data dashboard
Data dashboard
View the dashboard full screen
Dashboard data
Download CSV copies of the following datasets:
1. Audit outcomes
We gave clear audit opinions for financial reports across the Victorian public university sector. Parliament and the community can confidently use these reports.
Financial reports are reliable
Victorian public university sector
The Victorian public university sector consists of 8 universities and their controlled entities (also known as subsidiaries). At 31 December 2023, the universities reported they controlled 46 entities in total, which comprised of entities incorporated in Australia and overseas.
Our analysis in this report focuses on the consolidated financial reports submitted by the 8 universities for the 2023 reporting period.
Consolidated financial report
The financial report of a group in which the assets, liabilities, equity, income, expenses and cash flows of the parent and its subsidiaries are presented as those of a single economic entity.
See Appendix B for more information about the sector.
Number of clear audit opinions
We are required to audit the financial reports of the 8 Victorian public universities and their Australian controlled entities. Some universities also control entities incorporated overseas.
Of the 46 controlled entities, 10 were set up in an overseas jurisdiction. The enabling legislation of each university states we are not required to audit entities incorporated overseas. We have not included these entities in our analysis, except as part of the financial information contained in the consolidated financial report of each university.
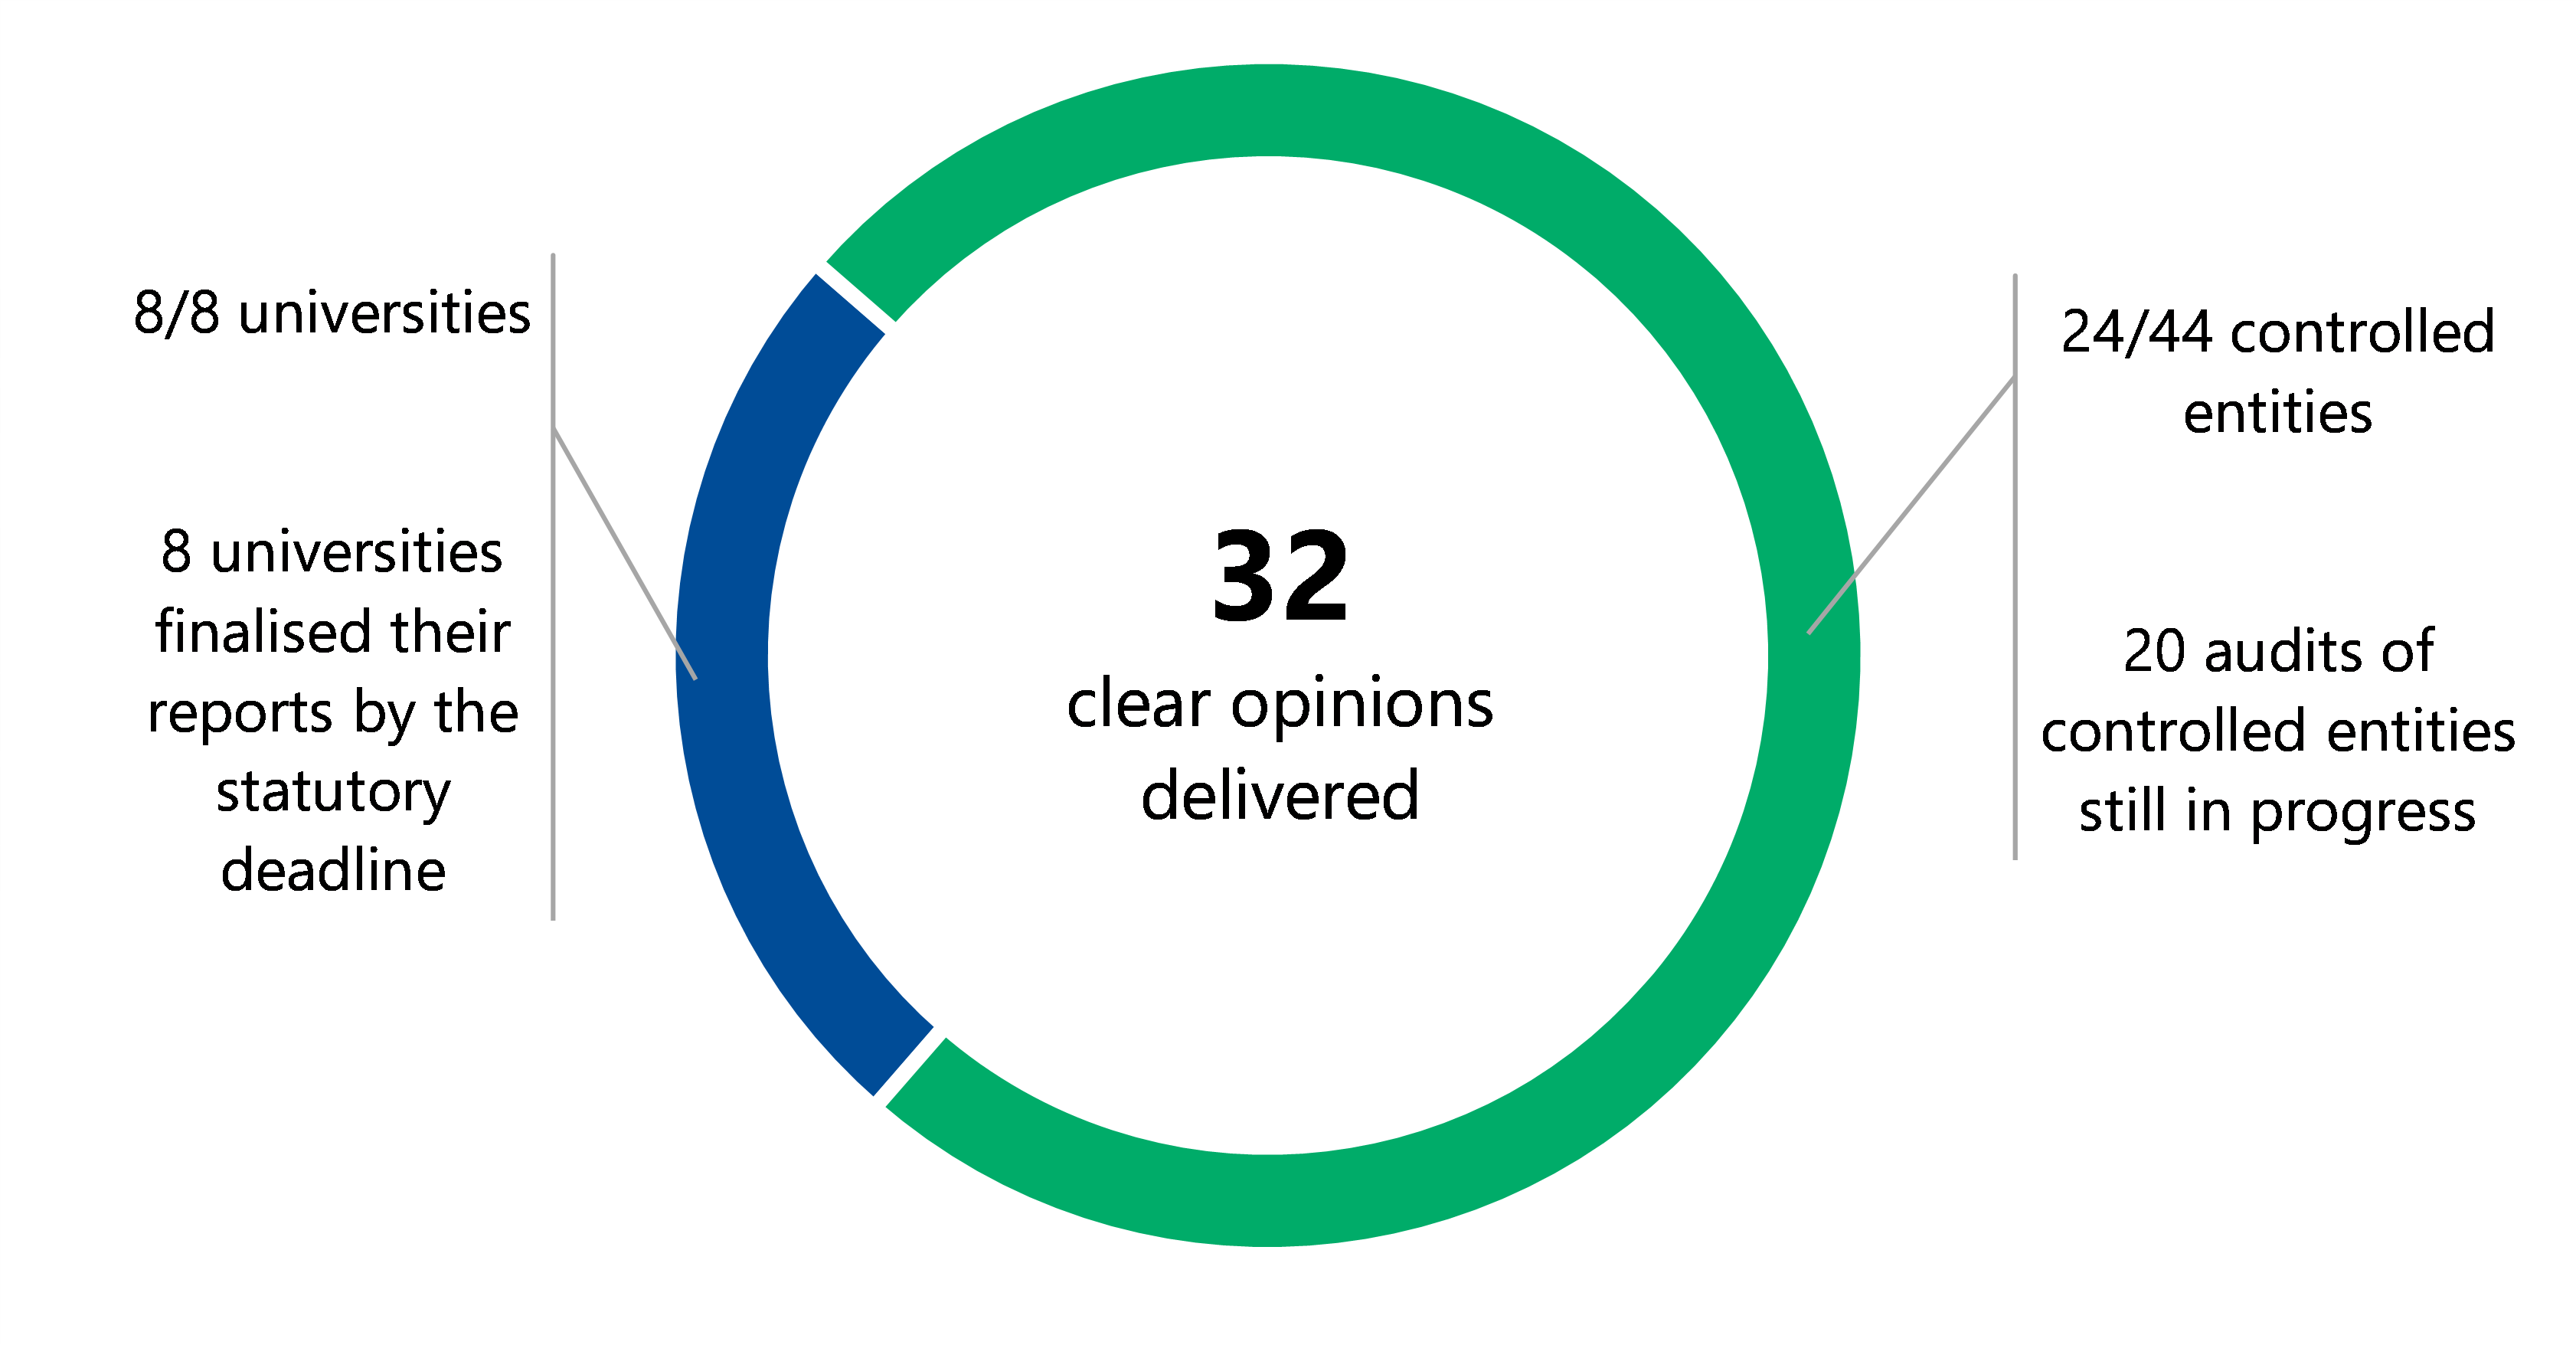
In total, we were required to issue 52 audit opinions for the 2023 year for the sector.
To date, we have issued 32 clear audit opinions across the sector for 2023 and there are 20 audits of controlled entities still in progress, which Figure 1 shows. This means Parliament and the community can confidently use the completed reports.
Figure 1: Clear audit opinions we issued and outstanding audits for 2023
Source: VAGO.
Clear audit opinion
A ‘clear’ or ‘unmodified’ audit opinion means we have reviewed an entity's financial report and believe it is reliable and complies with relevant reporting requirements.
Audits still in progress
As at 15 May 2024, the audits of 20 controlled entities' financial reports remain in progress for 2023. This did not affect our ability to issue audit opinions on the universities' consolidated financial reports because the operations of these remaining controlled entities are not significant, either individually or collectively, to each university's operations.
See Appendix C for more information about these audits.
Universities met their reporting timeframes
Reporting timeframes
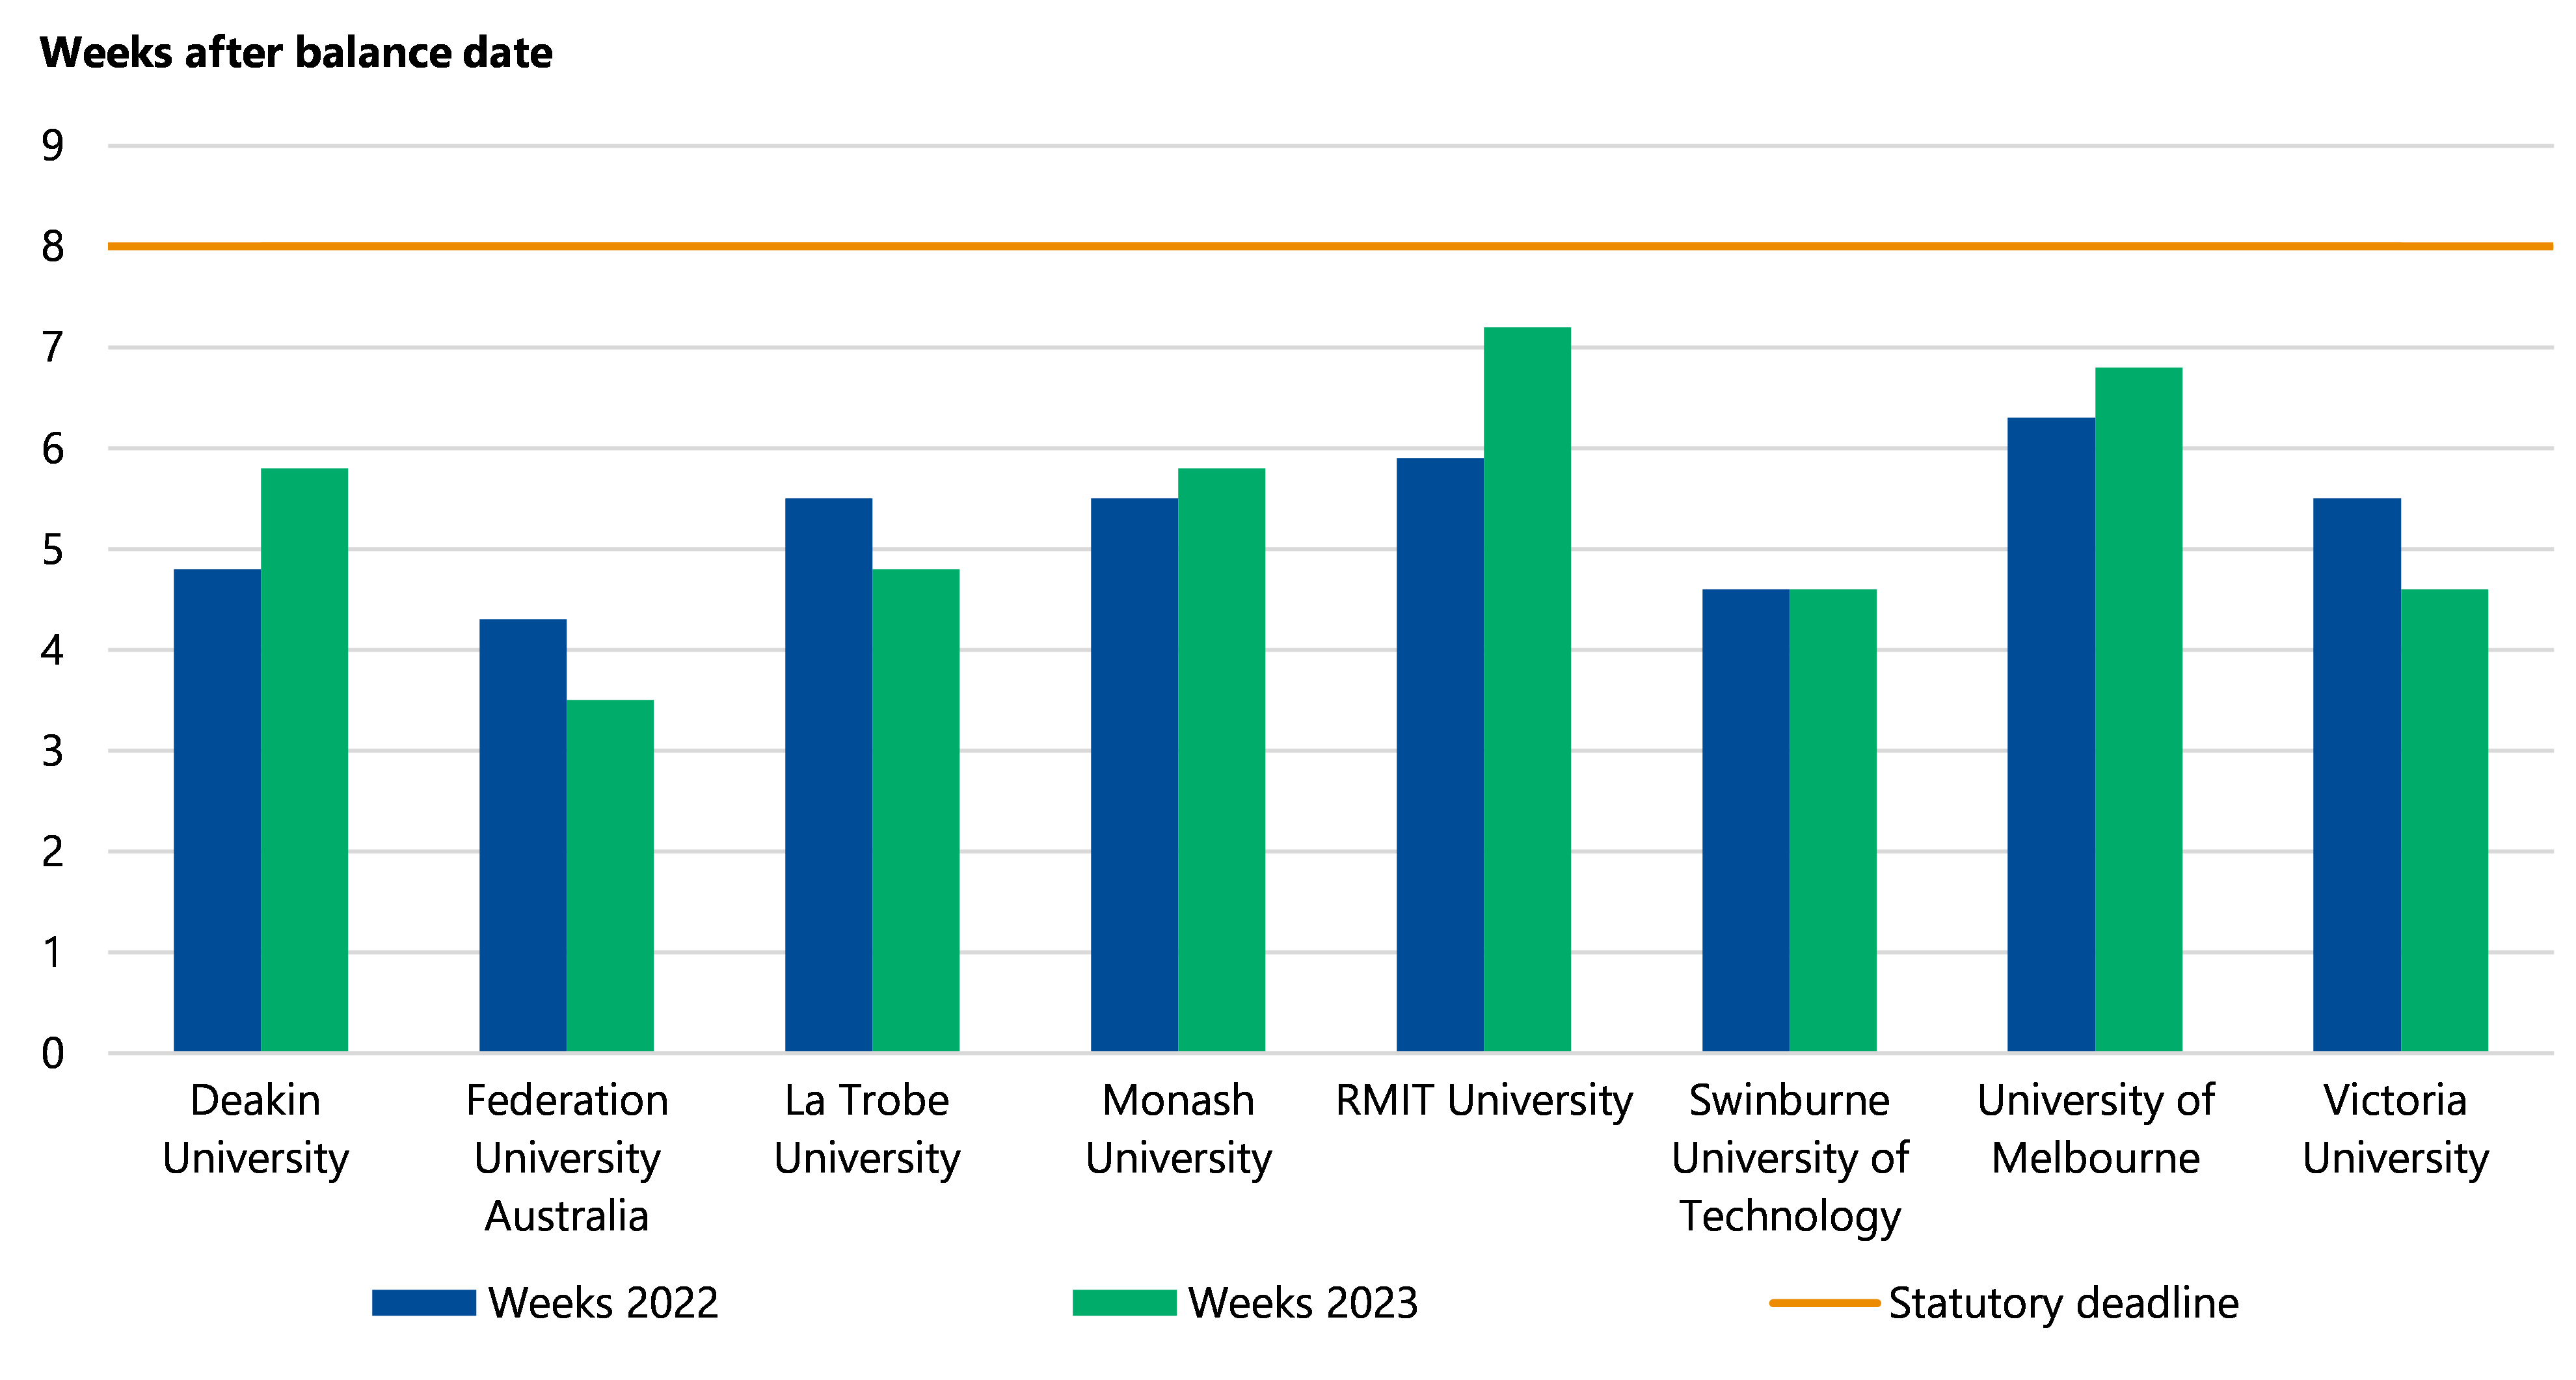
Under the Financial Management Act 1994, universities must submit their draft consolidated financial reports for audit within 8 weeks from the end of the reporting period, which is 31 December.
Under each of the universities' enabling legislation, controlled entities need to give us their draft financial report within 3 months of their balance date for audit.
Timeliness
As Figure 2 shows, all universities gave us their draft financial reports within the 8-week deadline, with 3 universities improving their timing from last year.
Figure 2: Timeliness of universities' financial reports for 2022 and 2023
Source: VAGO.
Controlled entities' timeliness
Thirty-six out of the 44 Australian controlled entities we audit gave us their draft financial reports within the 3-month deadline. This was a slight improvement from the prior year, where 33 gave us their draft financial reports within the 3-month deadline.
Some controlled entities did not meet their deadline because universities diverted their resources to make sure the financial reports of the universities are prepared within the deadline, ahead of focusing on the controlled entities.
While it is important that the universities and their significant controlled entities are prioritised, it is also important for controlled entity legislated timelines to be met, to ensure validity for users.
As at 15 May 2024, the financial reports of 3 controlled entities are still being prepared and we are still auditing the financial reports of 17 others.
Financial reports continue to be of good quality
Errors
The nature, number and size of errors in financial reports submitted for audit are measures of their quality and of the effectiveness of the systems and processes used to compile them. During an audit we sometimes find an item that an entity has not prepared in line with relevant reporting requirements.
Error or misstatement
Misstatement means a difference between the amount, classification, presentation or disclosure of a reported financial report item and the amount, classification, presentation or disclosure that is required for the item to be in accordance with the applicable financial reporting framework.
We classify these errors as either material or immaterial errors. We assess errors individually and in total with other errors identified during the audit.
| If an error is … | Then ... |
|---|---|
| material | the entity needs to adjust, or correct, it before we can issue a clear audit opinion. |
| immaterial | we recommend the entity corrects it, but we can still issue a clear audit opinion without the entity correcting it. |
Error correction
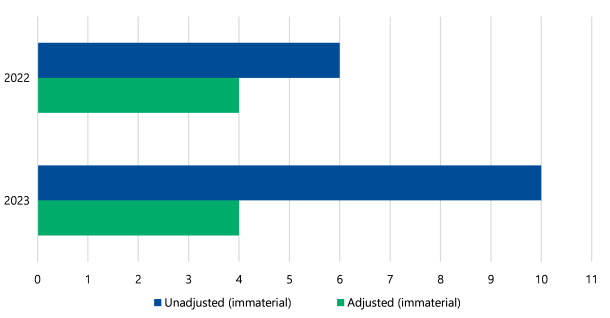
Consistent with 2022, we found no material errors in 2023, indicating good quality and effective systems and processes are in place to produce financial reports.
As shown in Figure 3, we found 14 immaterial errors in 2023, which increased from 10 errors in 2022. Out of the 14 errors, the universities corrected 4 and left 10 uncorrected.
The increase in error rate in 2023 is mainly related to a sector-wide issue relating to whether a franking credit receivable from the Australian Tax Office (ATO) should be impaired based on new information about its collectability.
Figure 3: Errors we found in 2022 and 2023
Source: VAGO.
Recommendation
All universities
We recommend universities with later controlled entity financial reporting timelines assess their processes, resource allocation and milestones to ensure they meet legislative requirements going forward.
2. Financial analysis
The sector as a whole broke even for 2023, but this was only because of fair value gains on investments recorded as income. The sector otherwise would have recorded an overall net deficit for the year, a continued declining trend from 2022.
Revenue from international students grew, while domestic student revenue growth remained flat when compared to 2022. Overall, revenue earned from teaching students has not fully recovered to pre-pandemic levels, however moved positively since 2022.
Expenditure on employees grew at a rate faster than student revenue in 2023. While universities needed more staff to teach the increasing number of students, if this trend continues, it could cause cash flow difficulties in the future. This corresponds with a deteriorating operating cash margin over the last 2 years.
At the end of 2023, universities' balance sheets remained strong, with enough short-term cash and financial assets to pay short-term expenses.
Future challenges remain for the sector, with cost of living pressures impacting student enrolments, potential increases in employee costs from current enterprise bargaining agreement negotiations and uncertainty around longer-term reform initiatives from the Australian Government's Australian Universities Accord recommendations.
To remain financially sustainable in the long term, the sector must set its revenue policies to meet current and future expenditure requirements, considering these foreseeable changes and any materialising risks.
The sector broke even in 2023 due to fair value gains on investments accounted for as income
Sector's net result
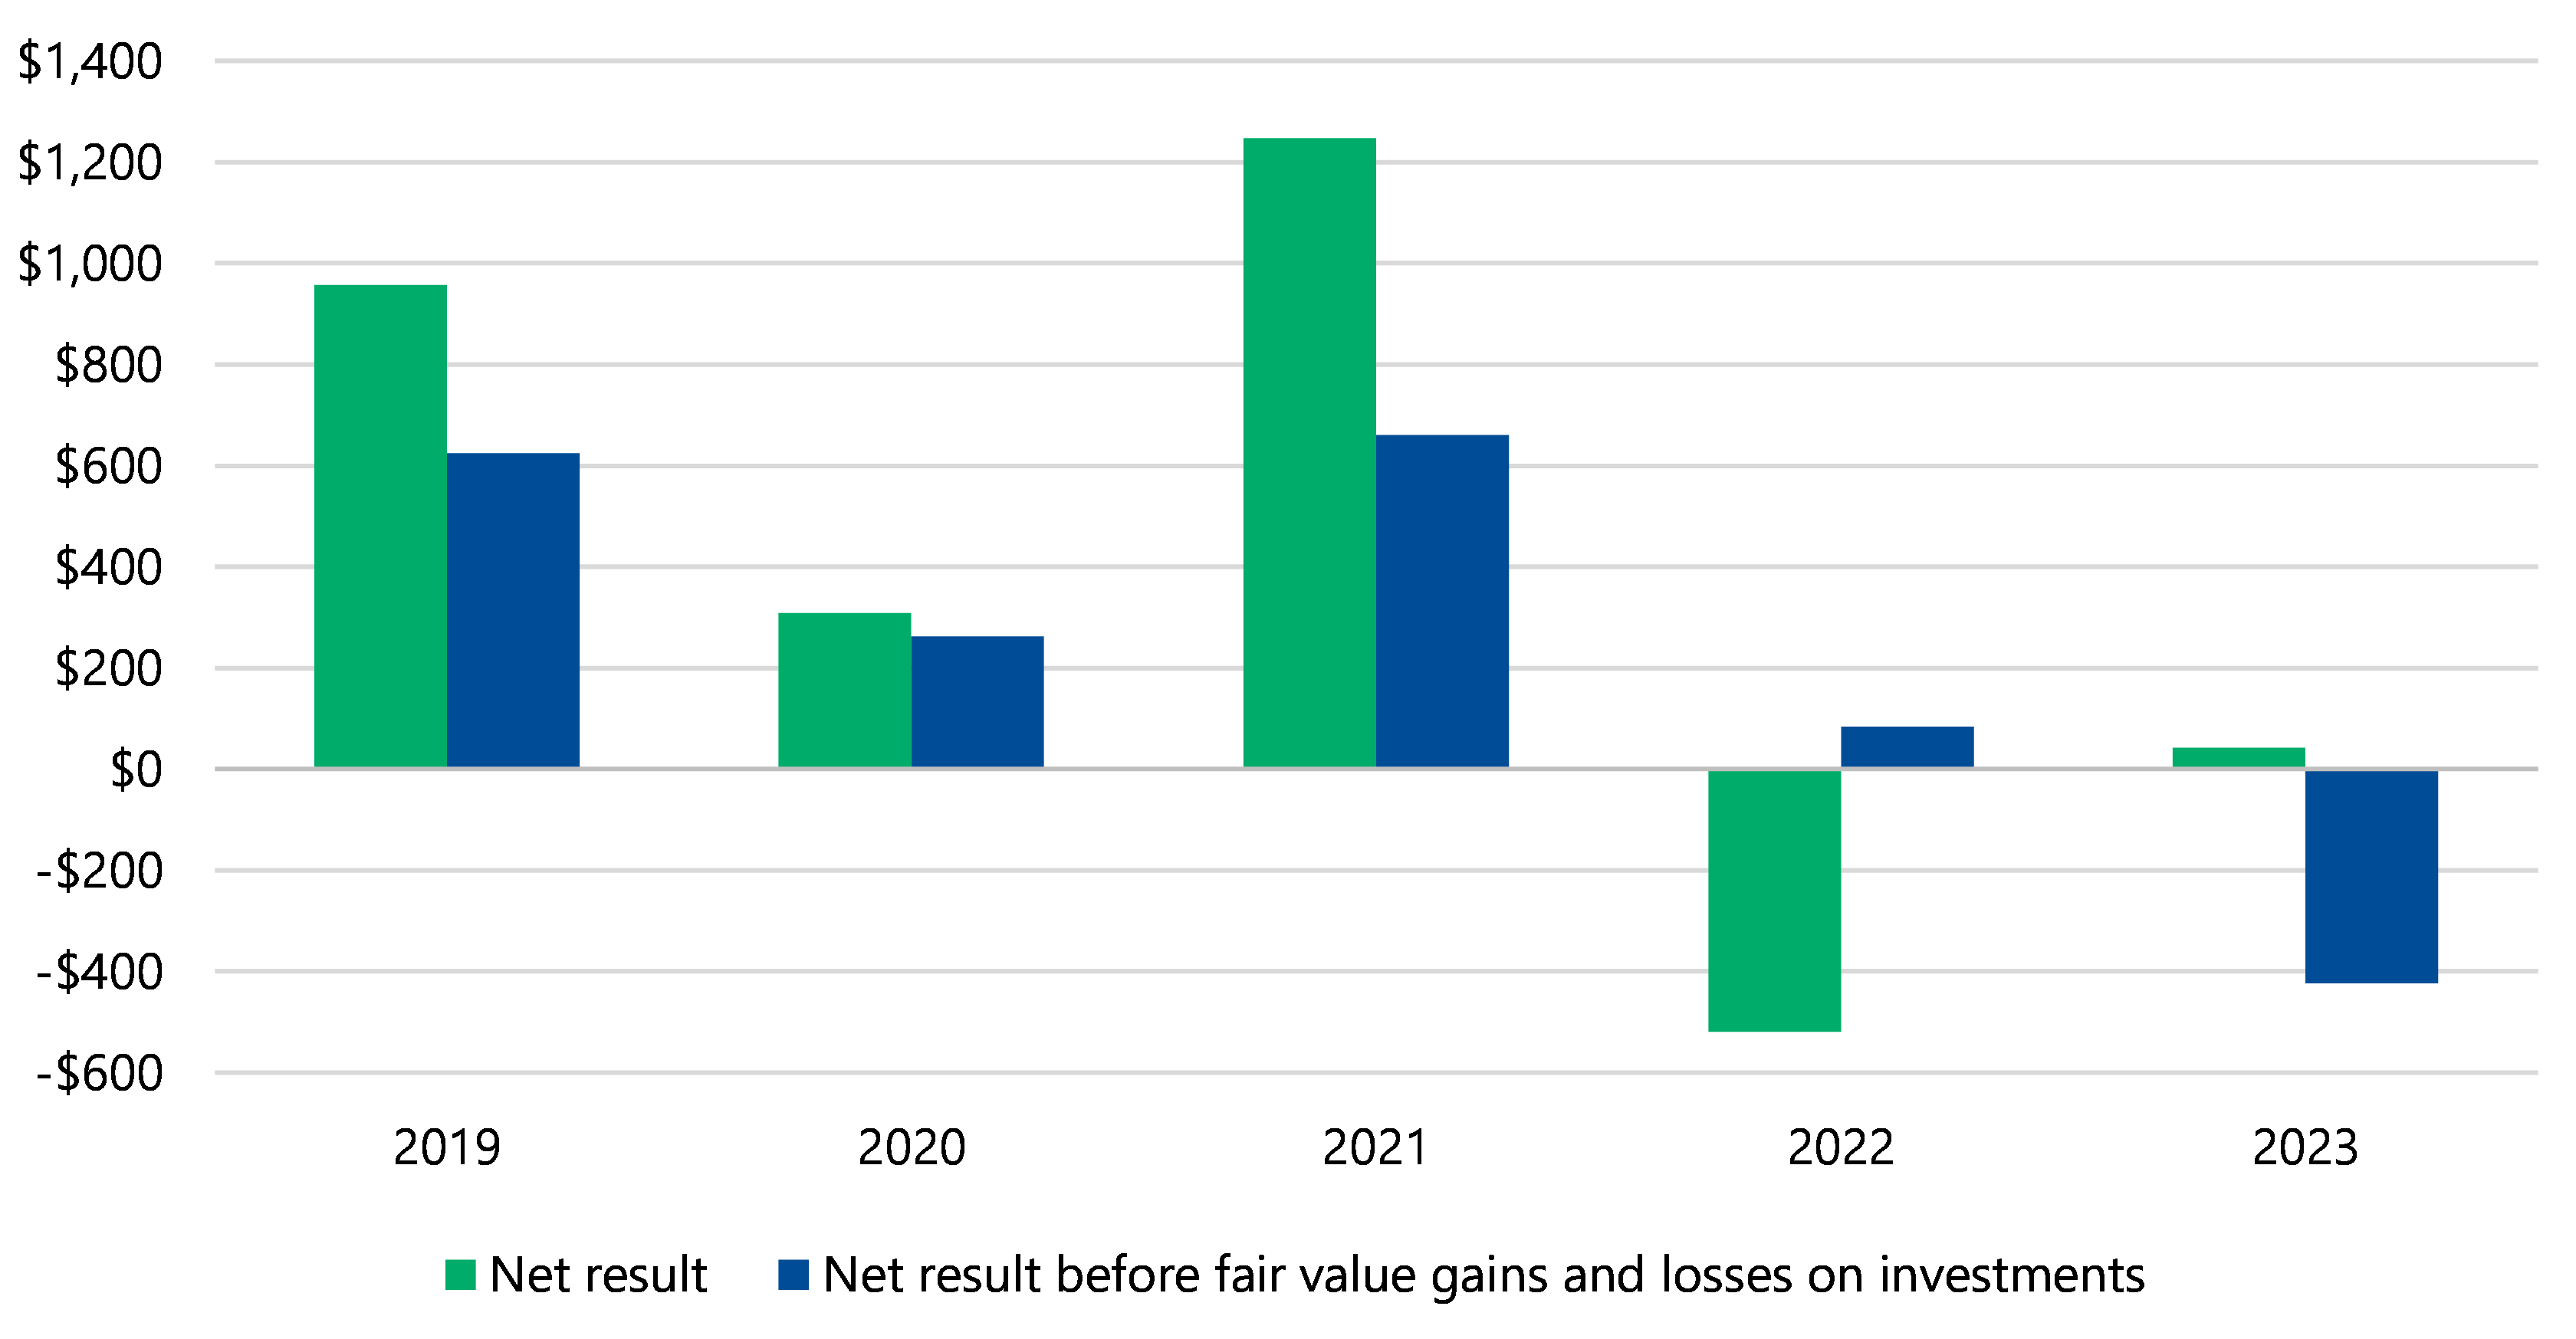
For 2023, the sector broke even, with revenue and income earned matching expenses incurred for the year. This is an improvement from the sector's overall net deficit of $520 million in 2022.
Fair value gains on investments contributed significantly to the 2023 result. Instead of recording a fair value loss on investments expense as in 2022, the sector recorded fair value gains on investments as income in 2023. In 2022 when its investments decreased in value, the sector recorded a deficit for the year as a result.
Fair value gains and losses on investments
Universities can choose to record changes in fair value for some of their investments in their net result when they happen or when they sell the asset.
Most universities record these changes in fair value within their net result for the year. They do this even if they have not sold the investment. This means their net result is susceptible to changes in fair value each year.
When an investment's fair value goes up, it is called a fair value gain When an investment's fair value goes down, it is called a fair value loss.
As Figure 4 shows, in 2023, before any fair value gains or losses were included in the net result, the sector would have recorded a deficit of $424 million.
Figure 4: The sector's net result before and after fair value gains or losses on investments, $ million
Source: VAGO.
Universities' net results before fair value gains and losses on investments
Out of the 8 universities, 6 improved their net result in 2023. However, as mentioned above, the increases in the value of the universities' investments contributed to most of this increase.
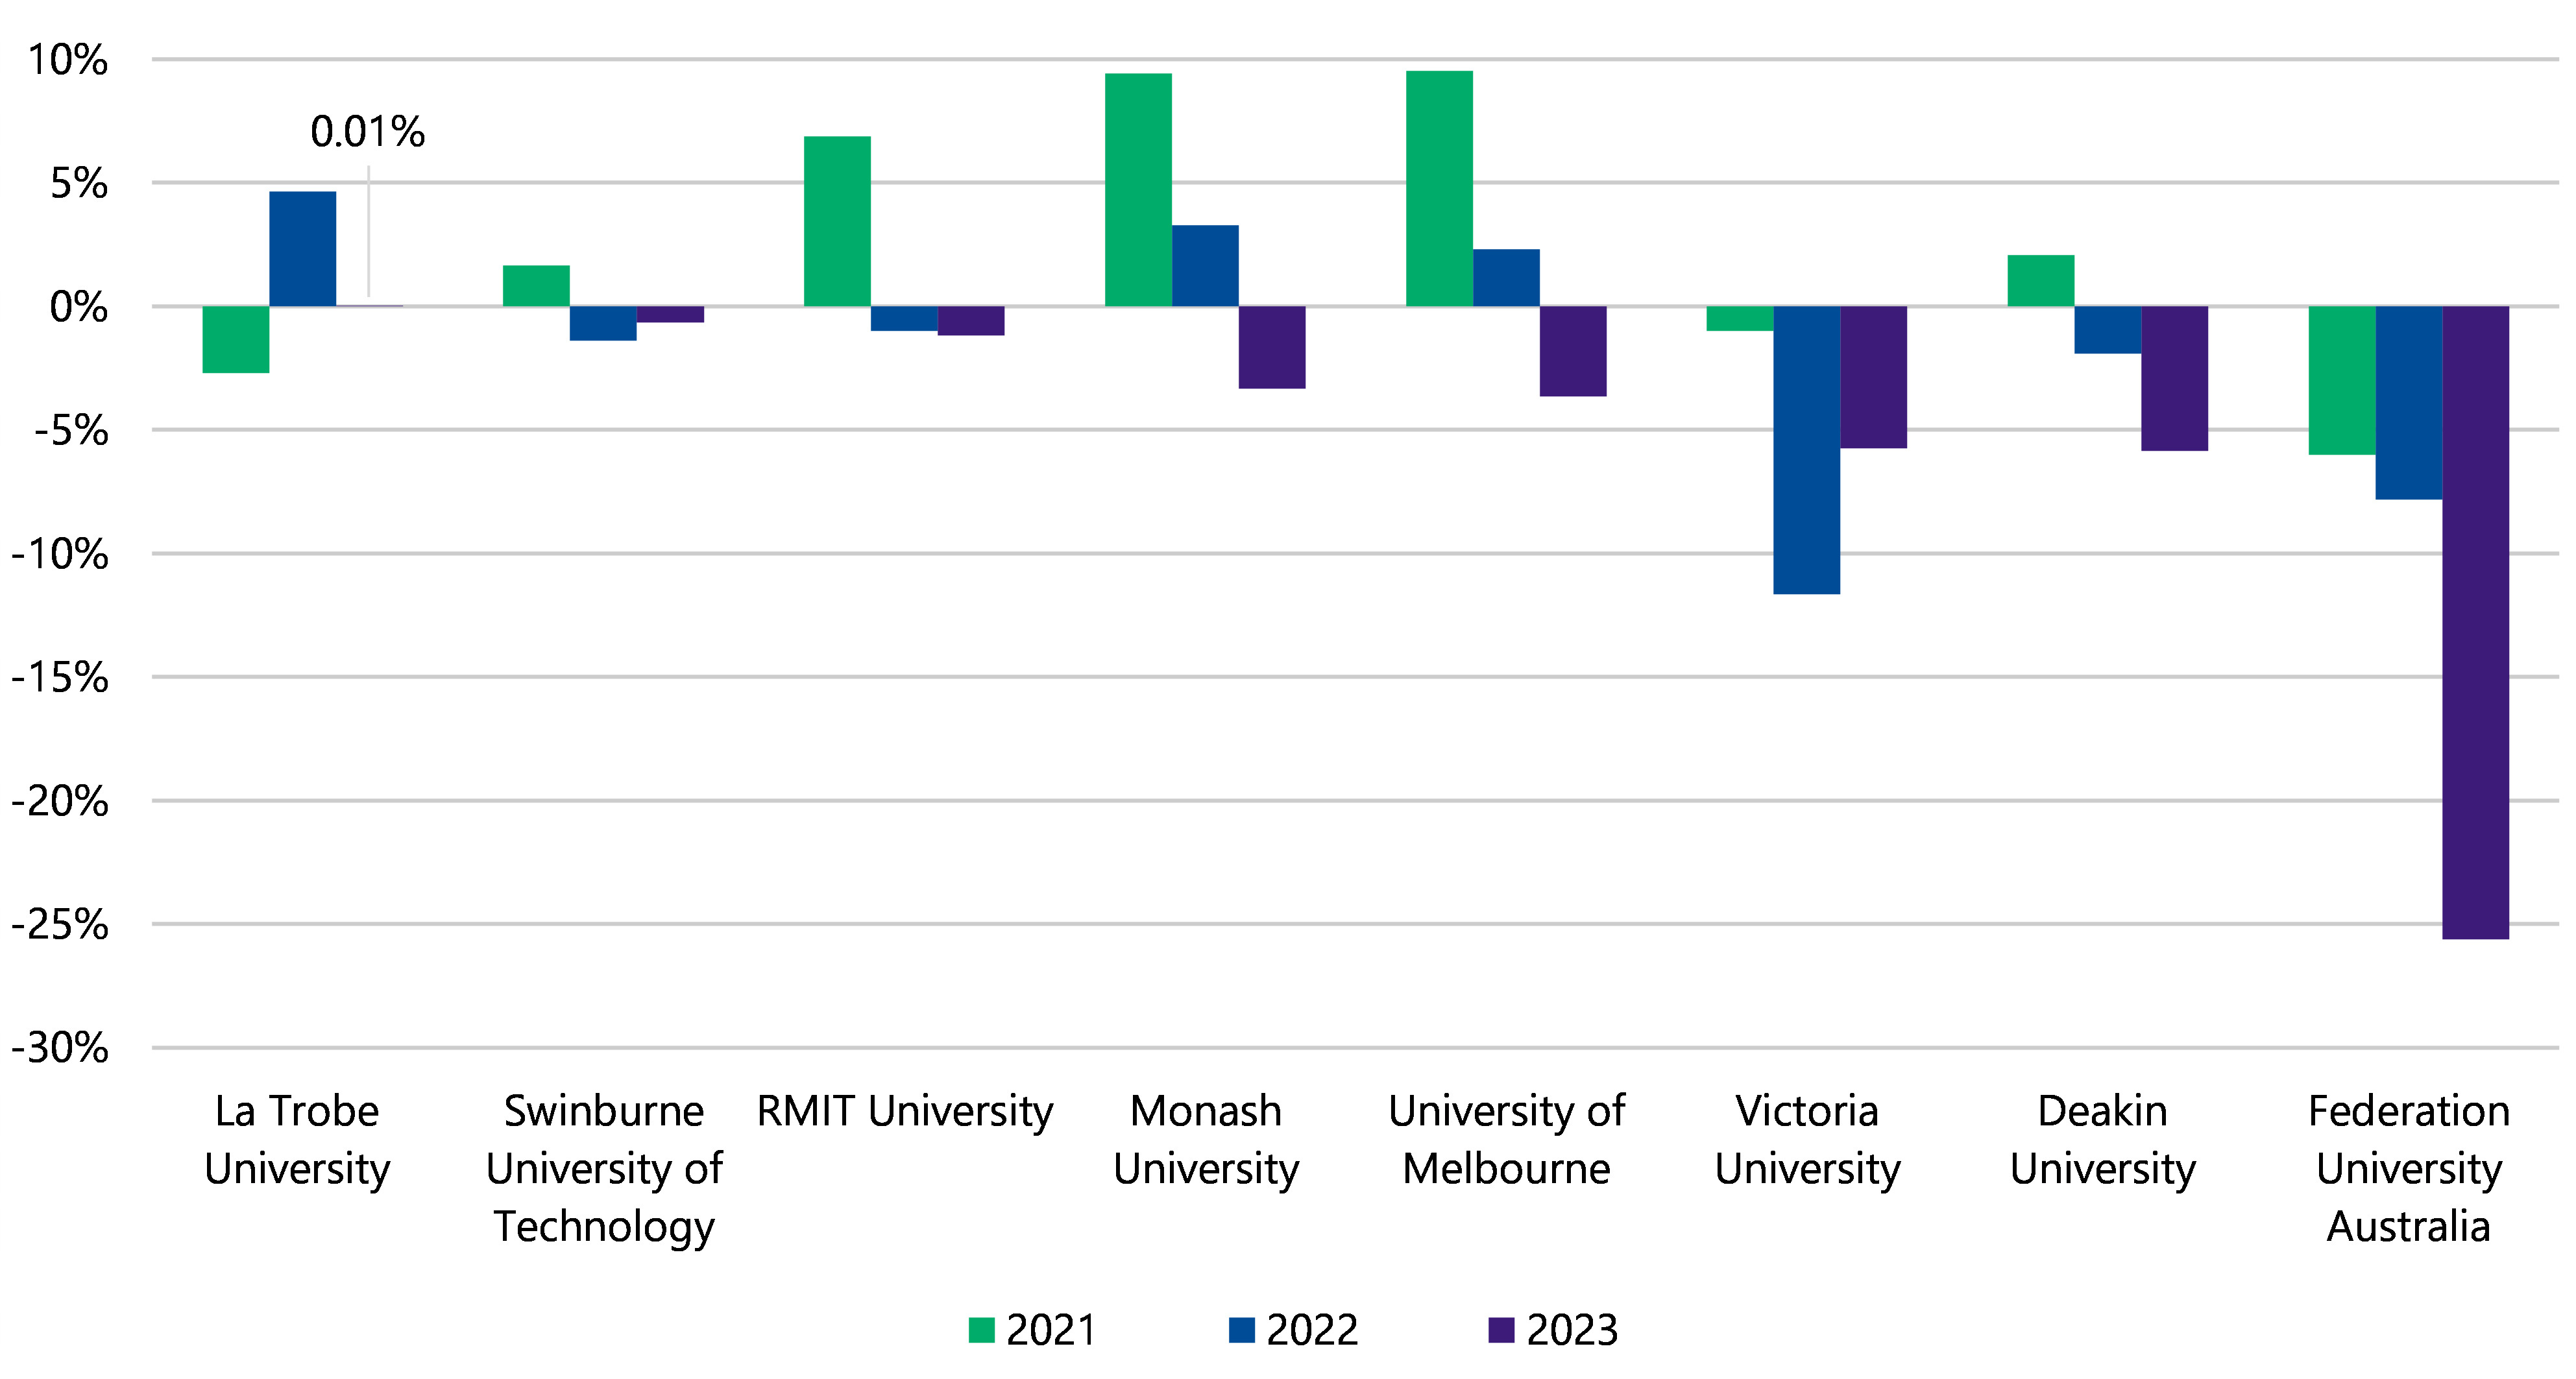
Figure 5 shows La Trobe University was the only university to break even before fair value gains or losses on investments. Further, only 2 universities (Swinburne University of Technology and Victoria University) recorded an improvement in their net result before gains and losses on investments.
The reason that universities displayed poorer results in 2023 before fair value gains and losses on investments is because they are spending more on their staff and suppliers compared with their revenue growth. In particular, the increase in staffing costs was more than the increases in student related revenue, and this affected most universities.
Net result margin
An entity's net result is its revenue and income minus its expenses. The net result margin is the net result divided by total revenue and income.
A positive result shows a surplus and a negative result shows a deficit. The larger the percentage, the stronger the result.
This measures how efficiently entities earn and spend their revenue and income.
There were some one-off or other events in 2022 and 2023 which affected some universities' net result margins:
- La Trobe University's declining margin between 2022 and 2023 can be substantially attributed to a one-off significant philanthropic gift of $42 million it received for autism research in 2022. Excluding this donation in 2022, its net result margin would have improved from 2022 to 2023.
- Federation University Australia's declining margin in 2023 can be attributed to a one-off impairment of $22.8 million of franking credits receivable from the ATO it recorded and an underperformance of international student income from its partner providers.
- Victoria University incurred some one-off employee expenses related to its transformation program in 2023 but controlled other costs and earned significantly more revenue, which improved its net result margin as compared with 2022.
Figure 5: Universities' net result margins before fair value gains and losses on investments for 2021, 2022 and 2023
Source: VAGO.
Financial performance snapshot (revenue and expenses)
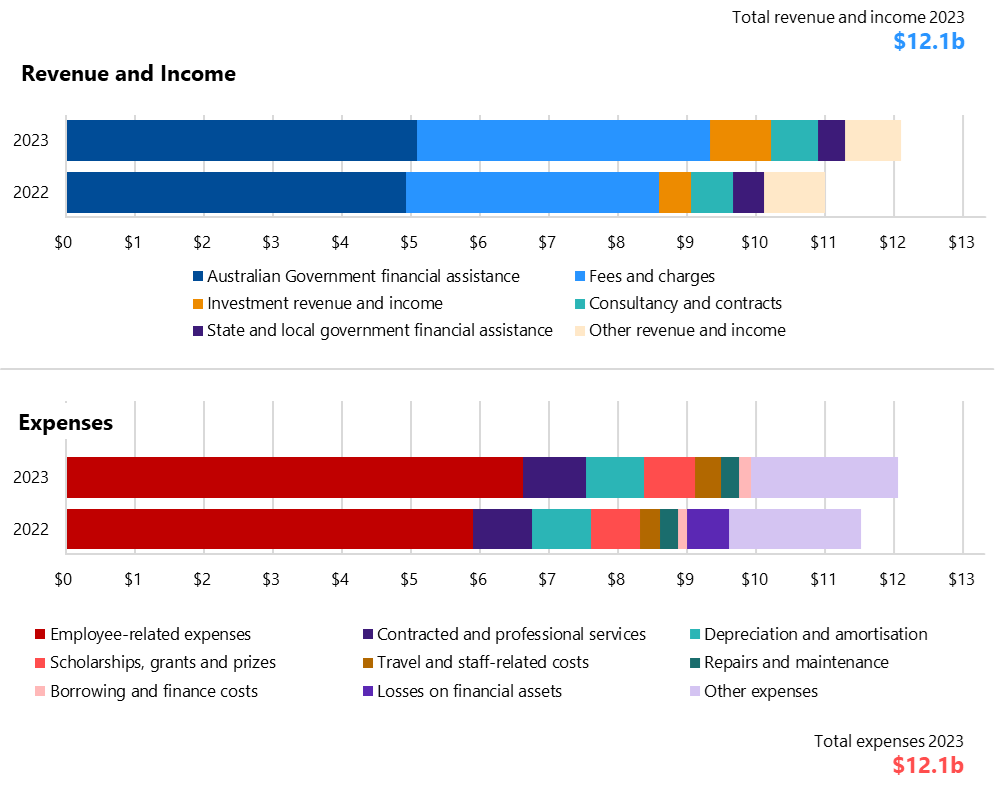
Figure 6 shows universities earn most of their revenue from Australian Government financial assistance and from fees and charges. Most of these 2 revenue streams are from domestic and international students.
Student revenue
Student revenue is income that a university gets from running courses.
Most of this revenue is fees and charges from international students and Australian Government student grants for Commonwealth-supported places.
A Commonwealth-supported place is when the Australian Government pays for part of a student's course fees.
Universities spend most of their money on their staff, with several other categories making up the rest of the operating expenses.
As discussed above, the 2022 expenses included fair value losses on investments (also known as losses on financial assets), compared with 2023 when universities recorded a gain, which they included in their investment revenue and income.
Figure 6: Sector's total revenue and expenses in 2022 and 2023, $ billion
Source: VAGO.
| In 2023 the sector reported … | Which is a … | From … | Because … |
|---|---|---|---|
$12.1 billion in revenue and income*
| 10.0% increase
| $11.0 billion in 2022
|
|
$12.1 billion in operating expenses
| 5.2% increase
| $11.5 billion in 2022
|
|
| $0.6 billion in operating cashflows* | 53.8% decrease | $1.3 billion in 2022 | universities received more in student fees, but this was offset because universities spent more cash on suppliers and employee expenses during the year compared with the revenue earned from student fees. |
*Refer to the glossary in Appendix E for more information.
International student revenue is recovering while domestic student revenue remains stagnant
International students
All universities received increased revenue from international students in 2023. Victoria University and La Trobe University had large increases of 76 per cent and 58 per cent compared with 2022. Universities in total earned $547 million more in international student fees compared with 2022. This was mostly due to increases in international student study hours, which saw an increase in equivalent full-time student load (EFTSL) of 13 per cent in 2023.
EFTSL
EFTSL is a measure that represents the workload of a student enrolled in a course on a full-time basis for an academic year. One EFTSL equals one full-time study load for one year.
Universities calculate EFTSL as per the Higher Education Support (Administration) Guidelines 2022.
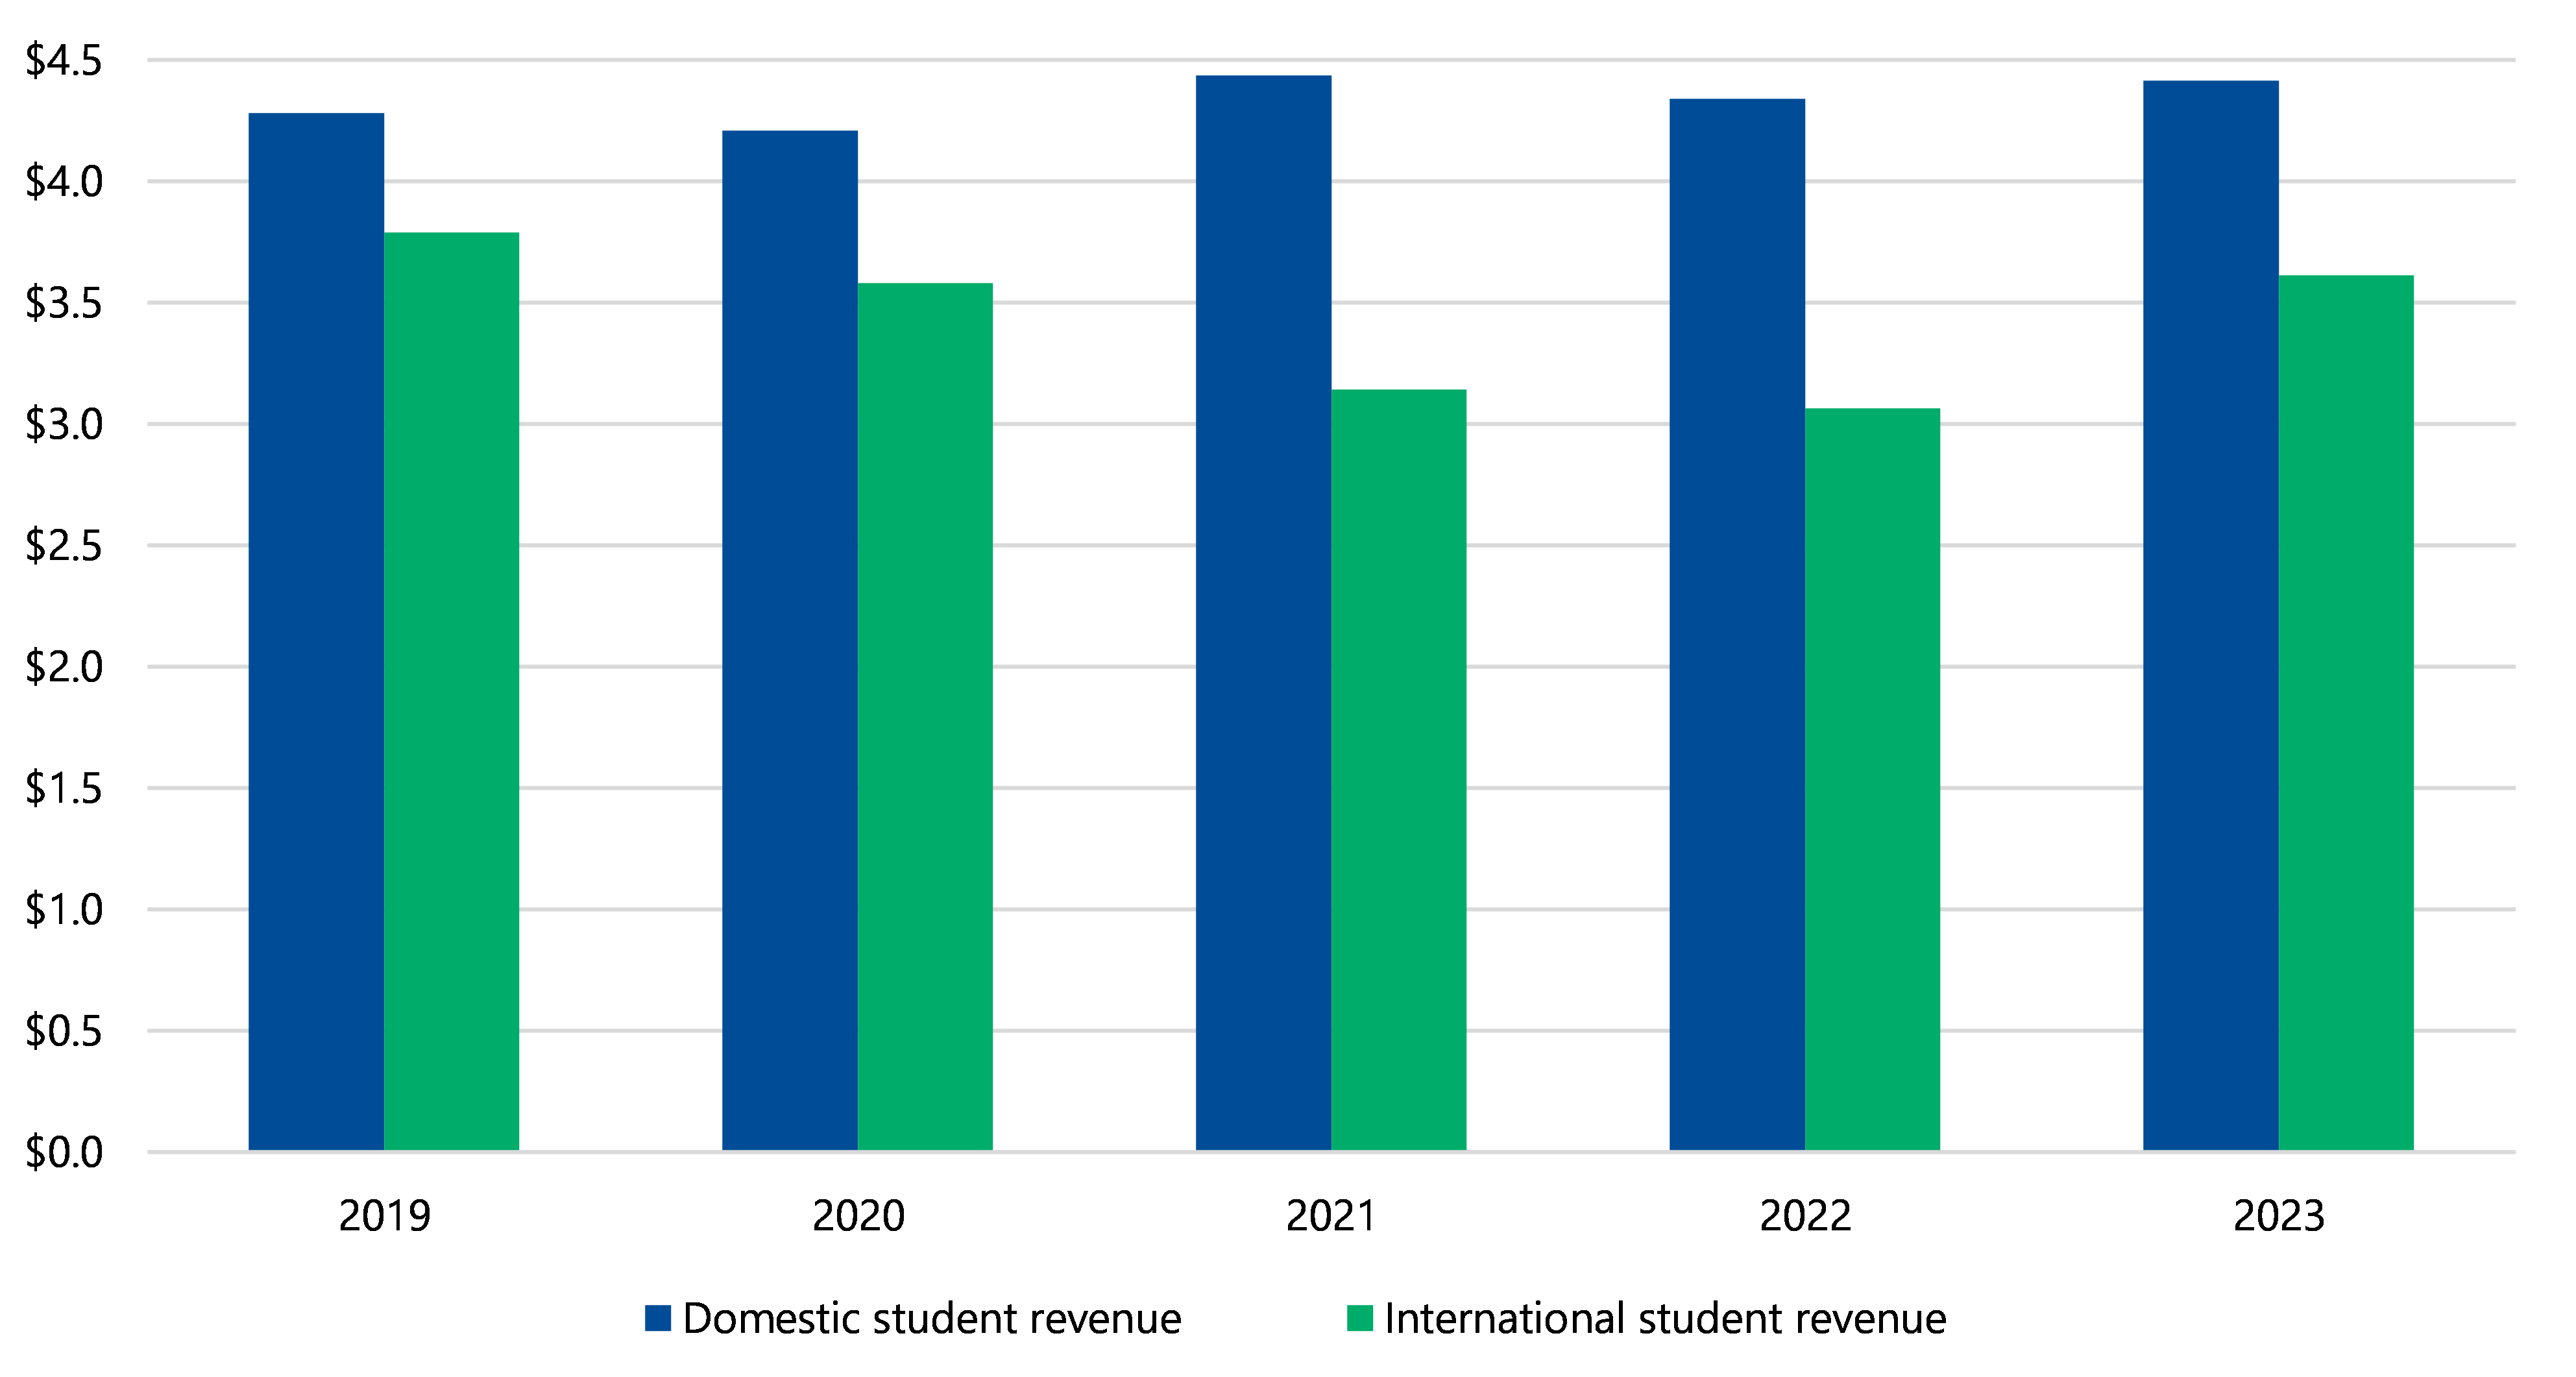
The amount of international student fees earned in 2023 was still below pre-COVID levels in 2019. Universities earned $3.8 billion from international student fees in 2019, compared with $3.6 billion in 2023.
Domestic students
Domestic student numbers have fallen from 2022.
As stated in the Australian Universities Accord Final Report released in February 2024, cost of living pressures together with other factors has led to a marked softening of demand in higher education.
However, unlike international student revenue, domestic student revenue has remained mostly consistent over the last 5 years, moving between $4.2 billion and $4.4 billion.
| In 2023, the EFTSL for … | Was … | Which is … |
|---|---|---|
| domestic students | 197,744 | a decrease of 1,053, or 0.5%, from 198,797 in 2022. |
| international students | 124,982 | an increase of 14,744, or 13.4%, from 110,238 in 2022. |
Total student-related revenue went up
Despite the fall in the number of domestic students, the amount of funding that universities received per domestic student, from both student payments and from the Australian Government, increased from $21,800 per student in 2022 to $22,300 per student in 2023, increasing total domestic student income overall.
Along with the increases in international student numbers, these factors led to an 8 per cent increase in student revenue earned by the universities, from $7.4 billion in 2022 to $8.0 billion in 2023.
With the consistency of domestic student revenue and the 2023 increases in international student revenue, the sector has returned to being only slightly (1 per cent) behind where it was in 2019 prior to COVID-19.
Figure 7: Student revenue earned by universities, 2019 to 2023, $ billion
Source: VAGO.
Staff expenses continue to grow faster than student revenue
Trends in expenses
For 2023, the sector's total expenditure grew by 5 per cent. However, as mentioned previously, the 2022 expenditure figure included fair value losses on investments, which were not present in 2023. Excluding the impacts of fair value gains and losses on investments, total expenditure increased by 11 per cent, from $10.9 billion in 2022 to $12.1 billion in 2023. This is greater than the 8 per cent increase in total student revenue.
As shown in Figure 6, employee-related expenses make up over half (55 per cent) of all expenses for the sector. Growth in these expenses contributed to most of the growth in total expenses, increasing by 12 per cent or $727 million compared with 2022.
For other operating expenses, travel and spend on student agencies were the largest contributors to the growth in other operating expenditure. This is because:
- in-person conferences and events returned to normal post COVID-19
- there was an increased need to use agencies to attract students in an increasingly competitive market.
Universities employed more staff in 2023 but still fewer than 2019
Universities employ a mixture of:
- academic staff, who are employed wholly or principally in teaching and/or research
- non-academic staff.
Universities collectively employed more than 40,780 full-time equivalent (FTE) staff in 2023. This is an increase of almost 2,000 from 2022.
As Figure 8 shows, academic and non-academic FTE both increased, with:
- academic FTE increasing by 4 per cent
- non-academic FTE increasing by 6 per cent.
Most universities still employ fewer FTE staff than they did prior to COVID-19 in 2019, where the sector employed a total of 41,495 FTE.
FTE staff
An FTE staff member represents the workload of one full-time employee. It is calculated based on the total hours worked by part-time employees or those with varied work schedules to equate to the hours of one full-time employee.
Figure 8: The sector's FTE workforce by employment classification, 2019 to 2023
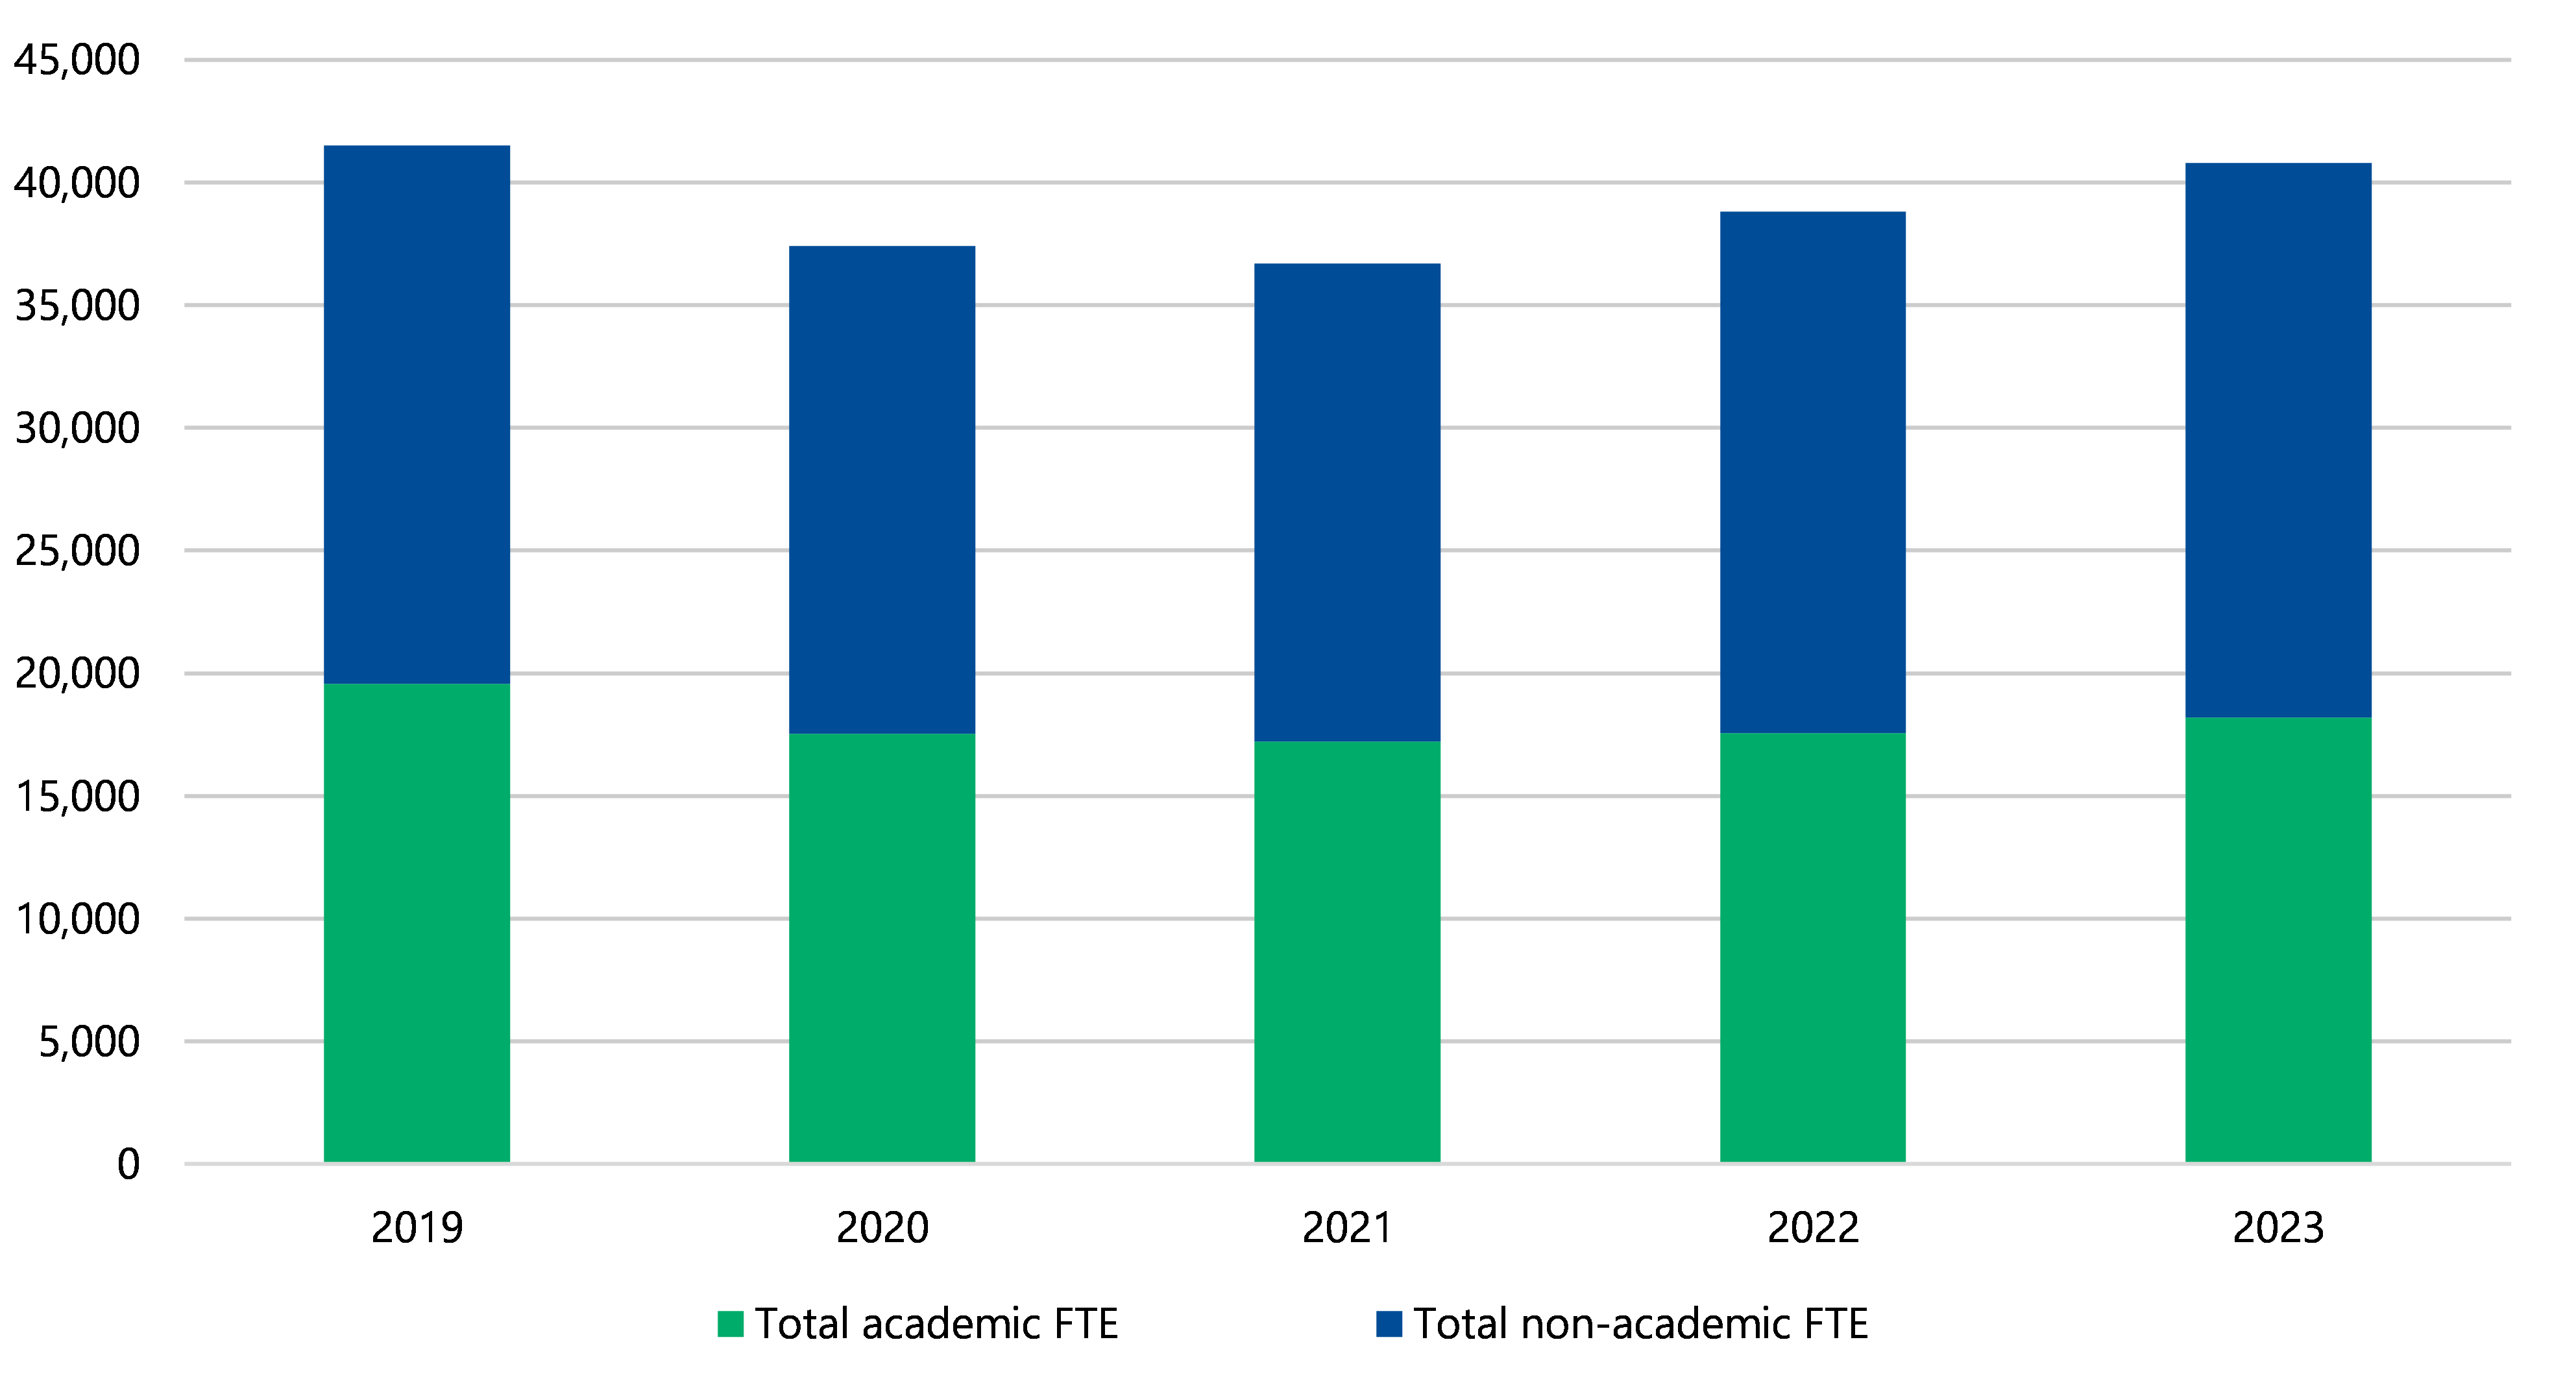
Source: The FTE numbers used in the above figure were provided by the respective university and are unaudited.
Increasing employee-related expenses may pose challenges
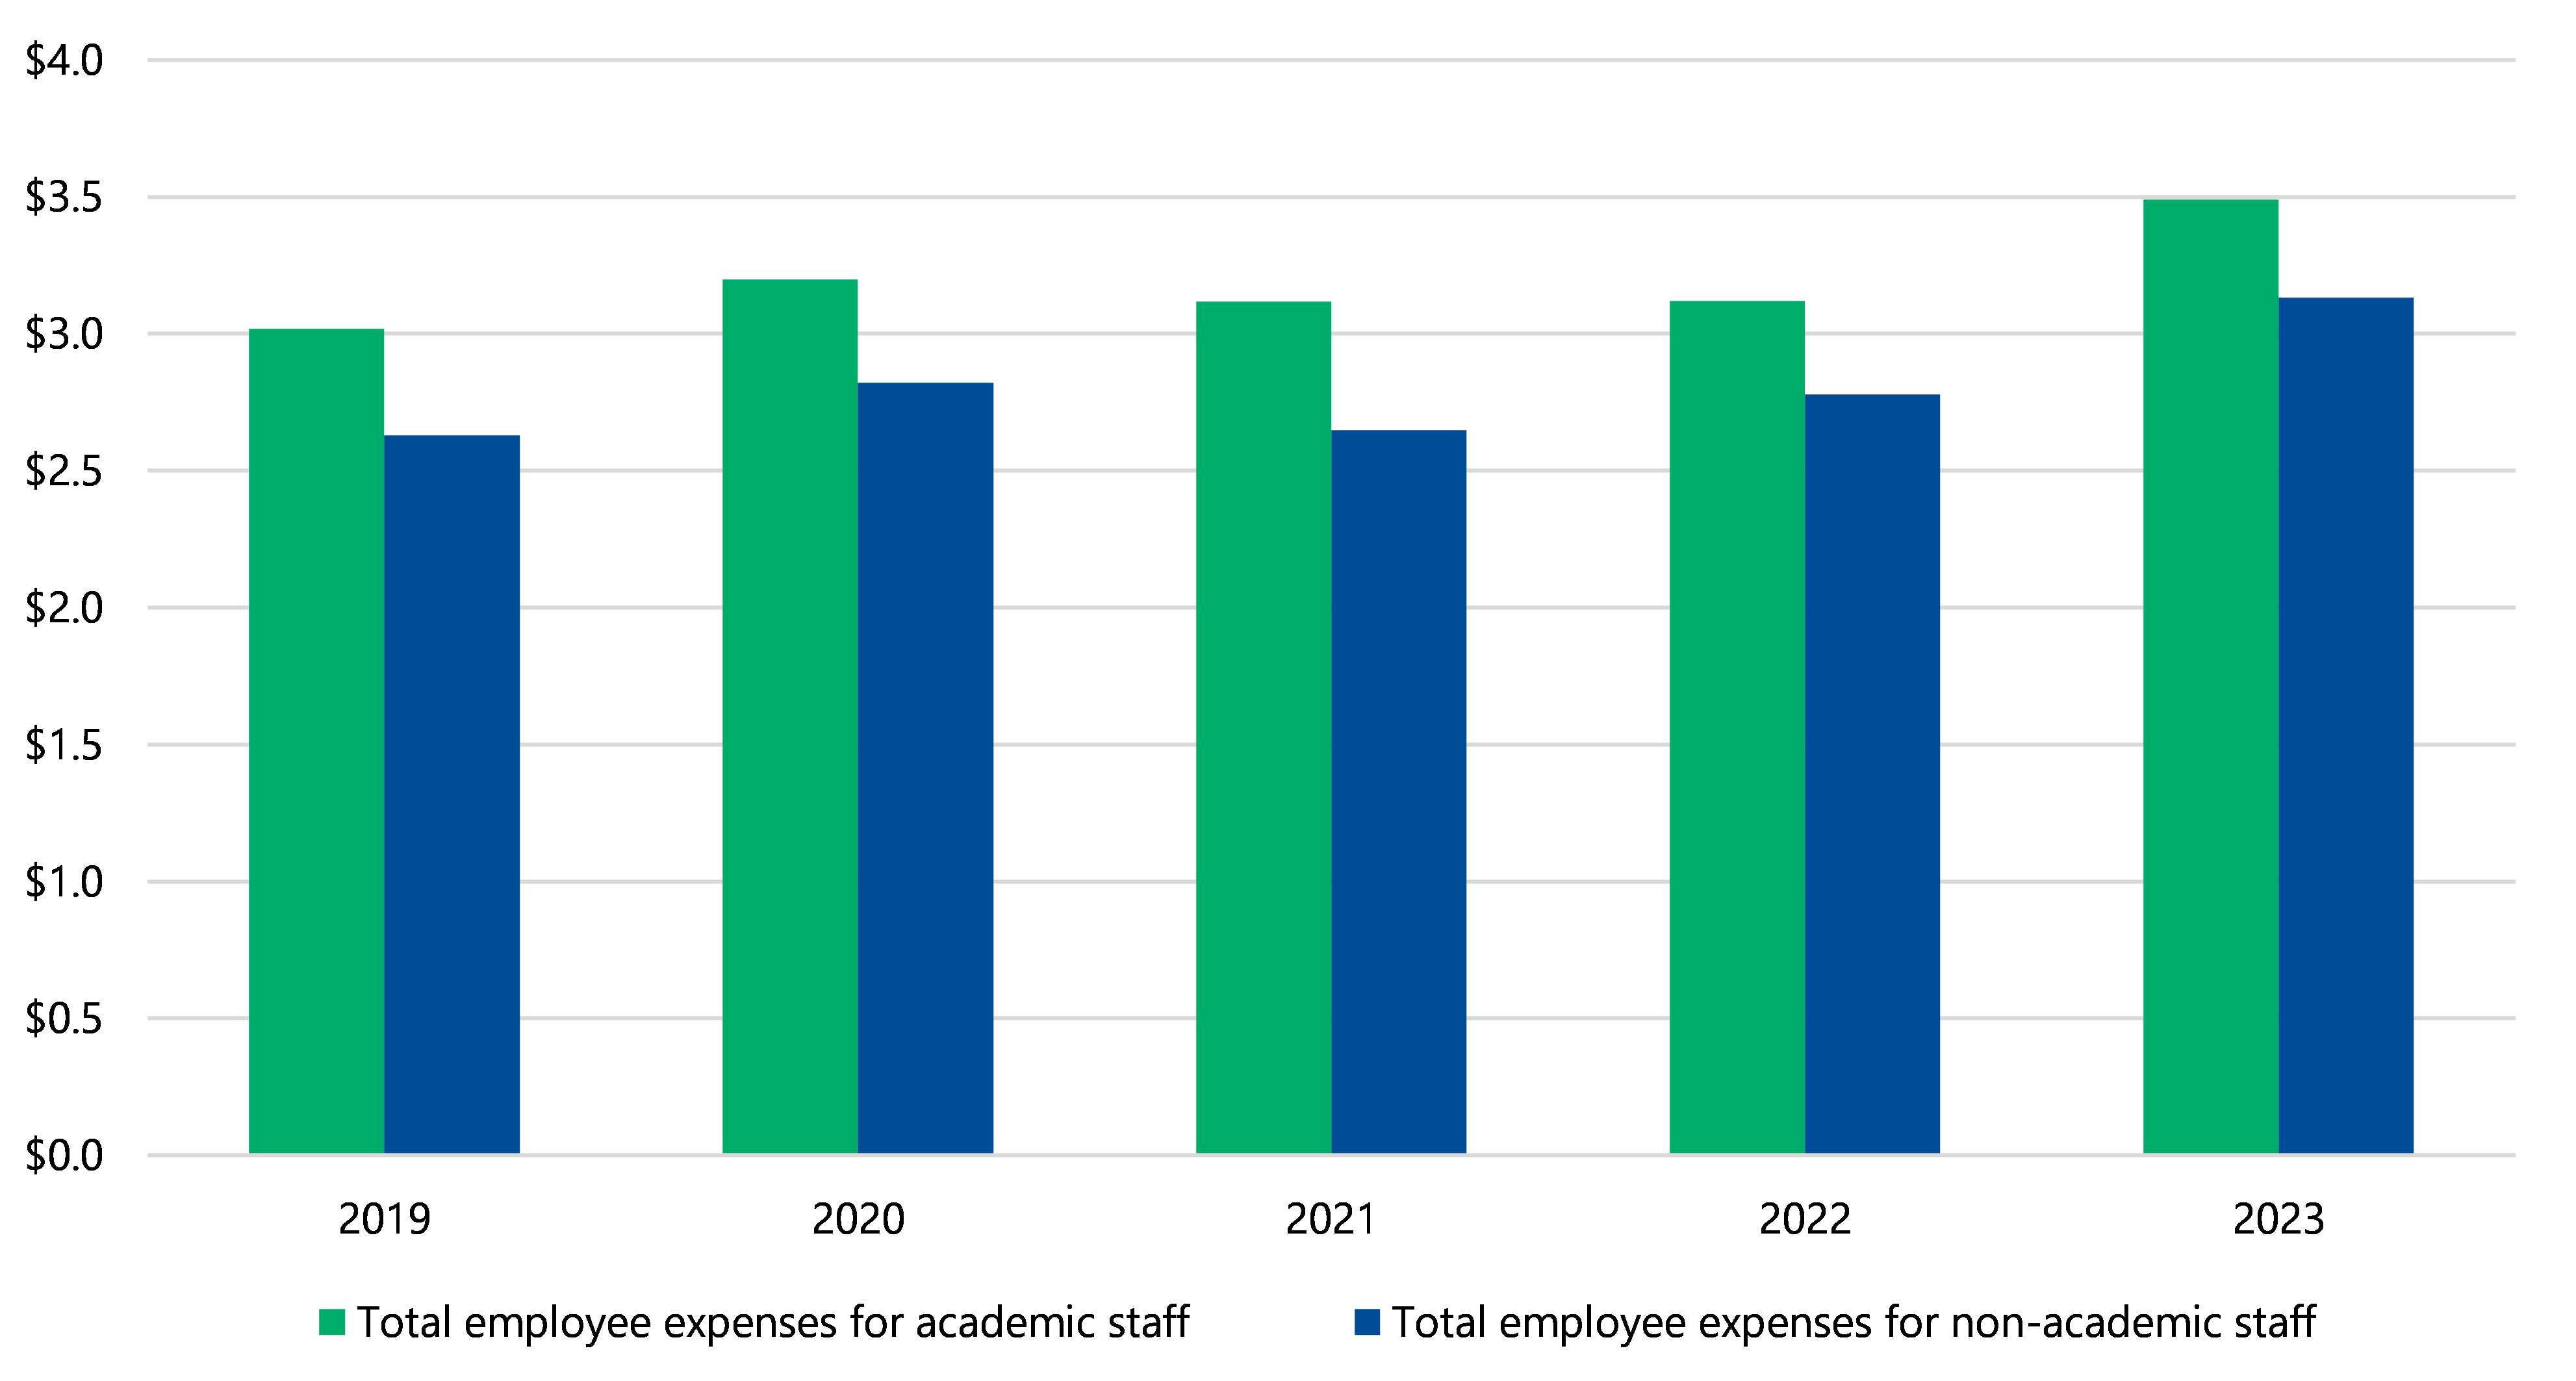
Along with increases in the number of FTE staff universities employed in 2023, they also paid these staff more, as shown in Figure 9.
This increase in both the number of staff and amount paid per staff caused the total sector employee-related expenses to increase by 12 per cent, from $5.9 billion in 2022 to $6.6 billion in 2023. This is a large difference compared with the 2 per cent increase from 2021 to 2022.
The return of international students will require universities to employ more teaching and support staff. If the increase in employee expenses continues to outpace the growth in revenue, this may lead to structural challenges in the future.
Figure 9: Expenditure by universities on academic and non-academic staff, 2019 to 2023, $ billion
Source: VAGO.
Land, buildings and investments continue to dominate universities' balance sheets
Financial position snapshot (assets and liabilities)
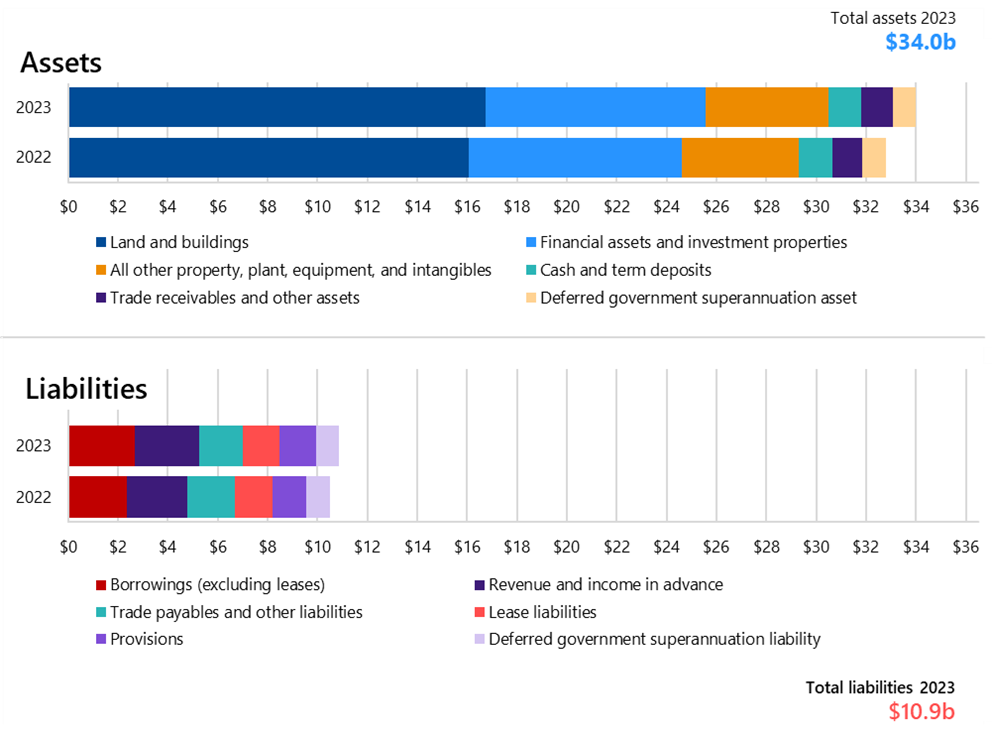
As Figure 10 shows, most of the sector's assets sit in the land and buildings universities own and their investment portfolios.
The sector's largest liabilities are loans, and revenue and income universities have received in advance of providing the service.
Figure 10: Sector's total assets and liabilities in 2022 and 2023, $ billion
Source: VAGO.
| In 2023 the sector reported … | Which is a … | From … | Because … |
|---|---|---|---|
$34.0 billion in assets
| 3.7% increase
| $32.8 billion in 2022
|
|
$10.9 billion in liabilities
| 3.8% increase
| $10.5 billion in 2022
|
|
Universities' balance sheets are still strong, but declining cash surpluses may pose future challenges
Universities are still liquid
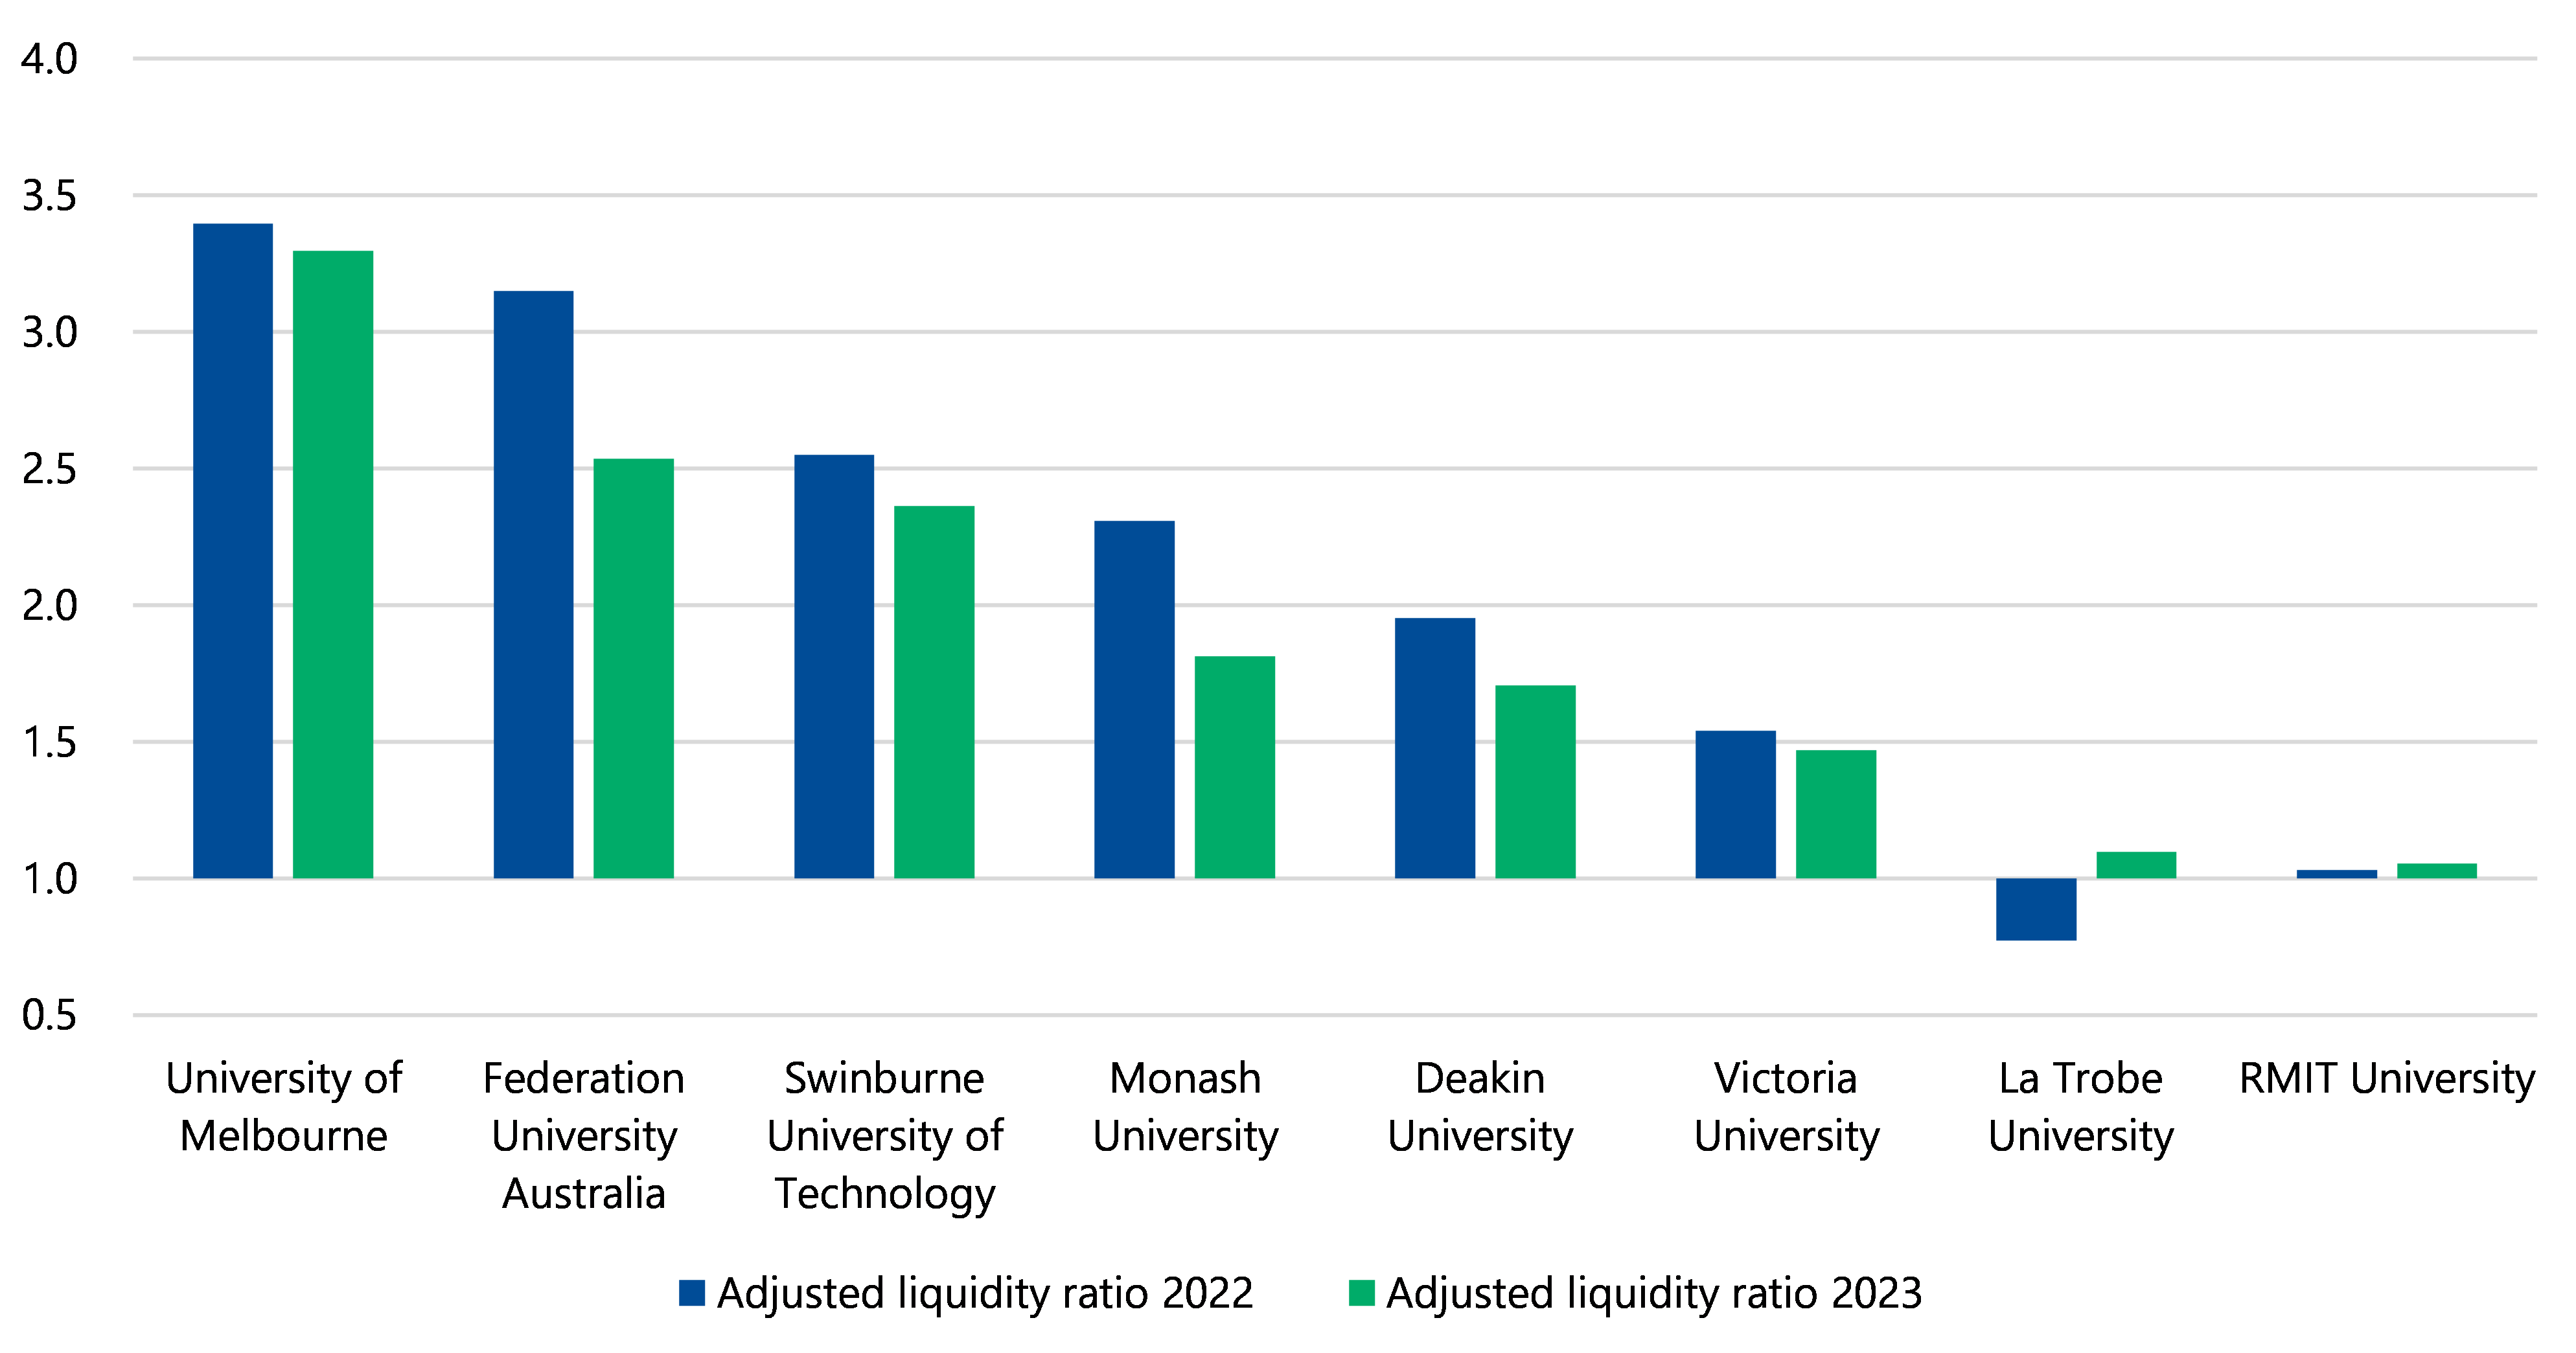
Despite most of the universities recording a net loss before fair value gains or losses on investments for the year, all universities had an adjusted liquidity ratio above one as at 31 December 2023.
Adjusted liquidity ratio
A liquidity ratio measures if an entity can likely pay its liabilities in the immediate future using cash and short-term assets. An entity's adjusted liquidity ratio also includes its non-current investments.
The ratio should ideally be above one, indicating that there are sufficient liquid assets to meet short-term liabilities.
La Trobe University's ratio was below one in 2022 as it had some short-term debt maturing within the 12-month period from the 31 December 2022 balance date. La Trobe University restructured its debt in 2023 as part of its Sustainable Finance Framework.
While Federation University Australia has recorded a net loss before fair value gains or losses on investments in each of the last 3 years, its adjusted liquidity ratio still is strong at over 2.5.
Figure 11: Universities' adjusted liquidity ratios for 2022 and 2023
Source: VAGO.
Most universities generated surplus cash from their operations
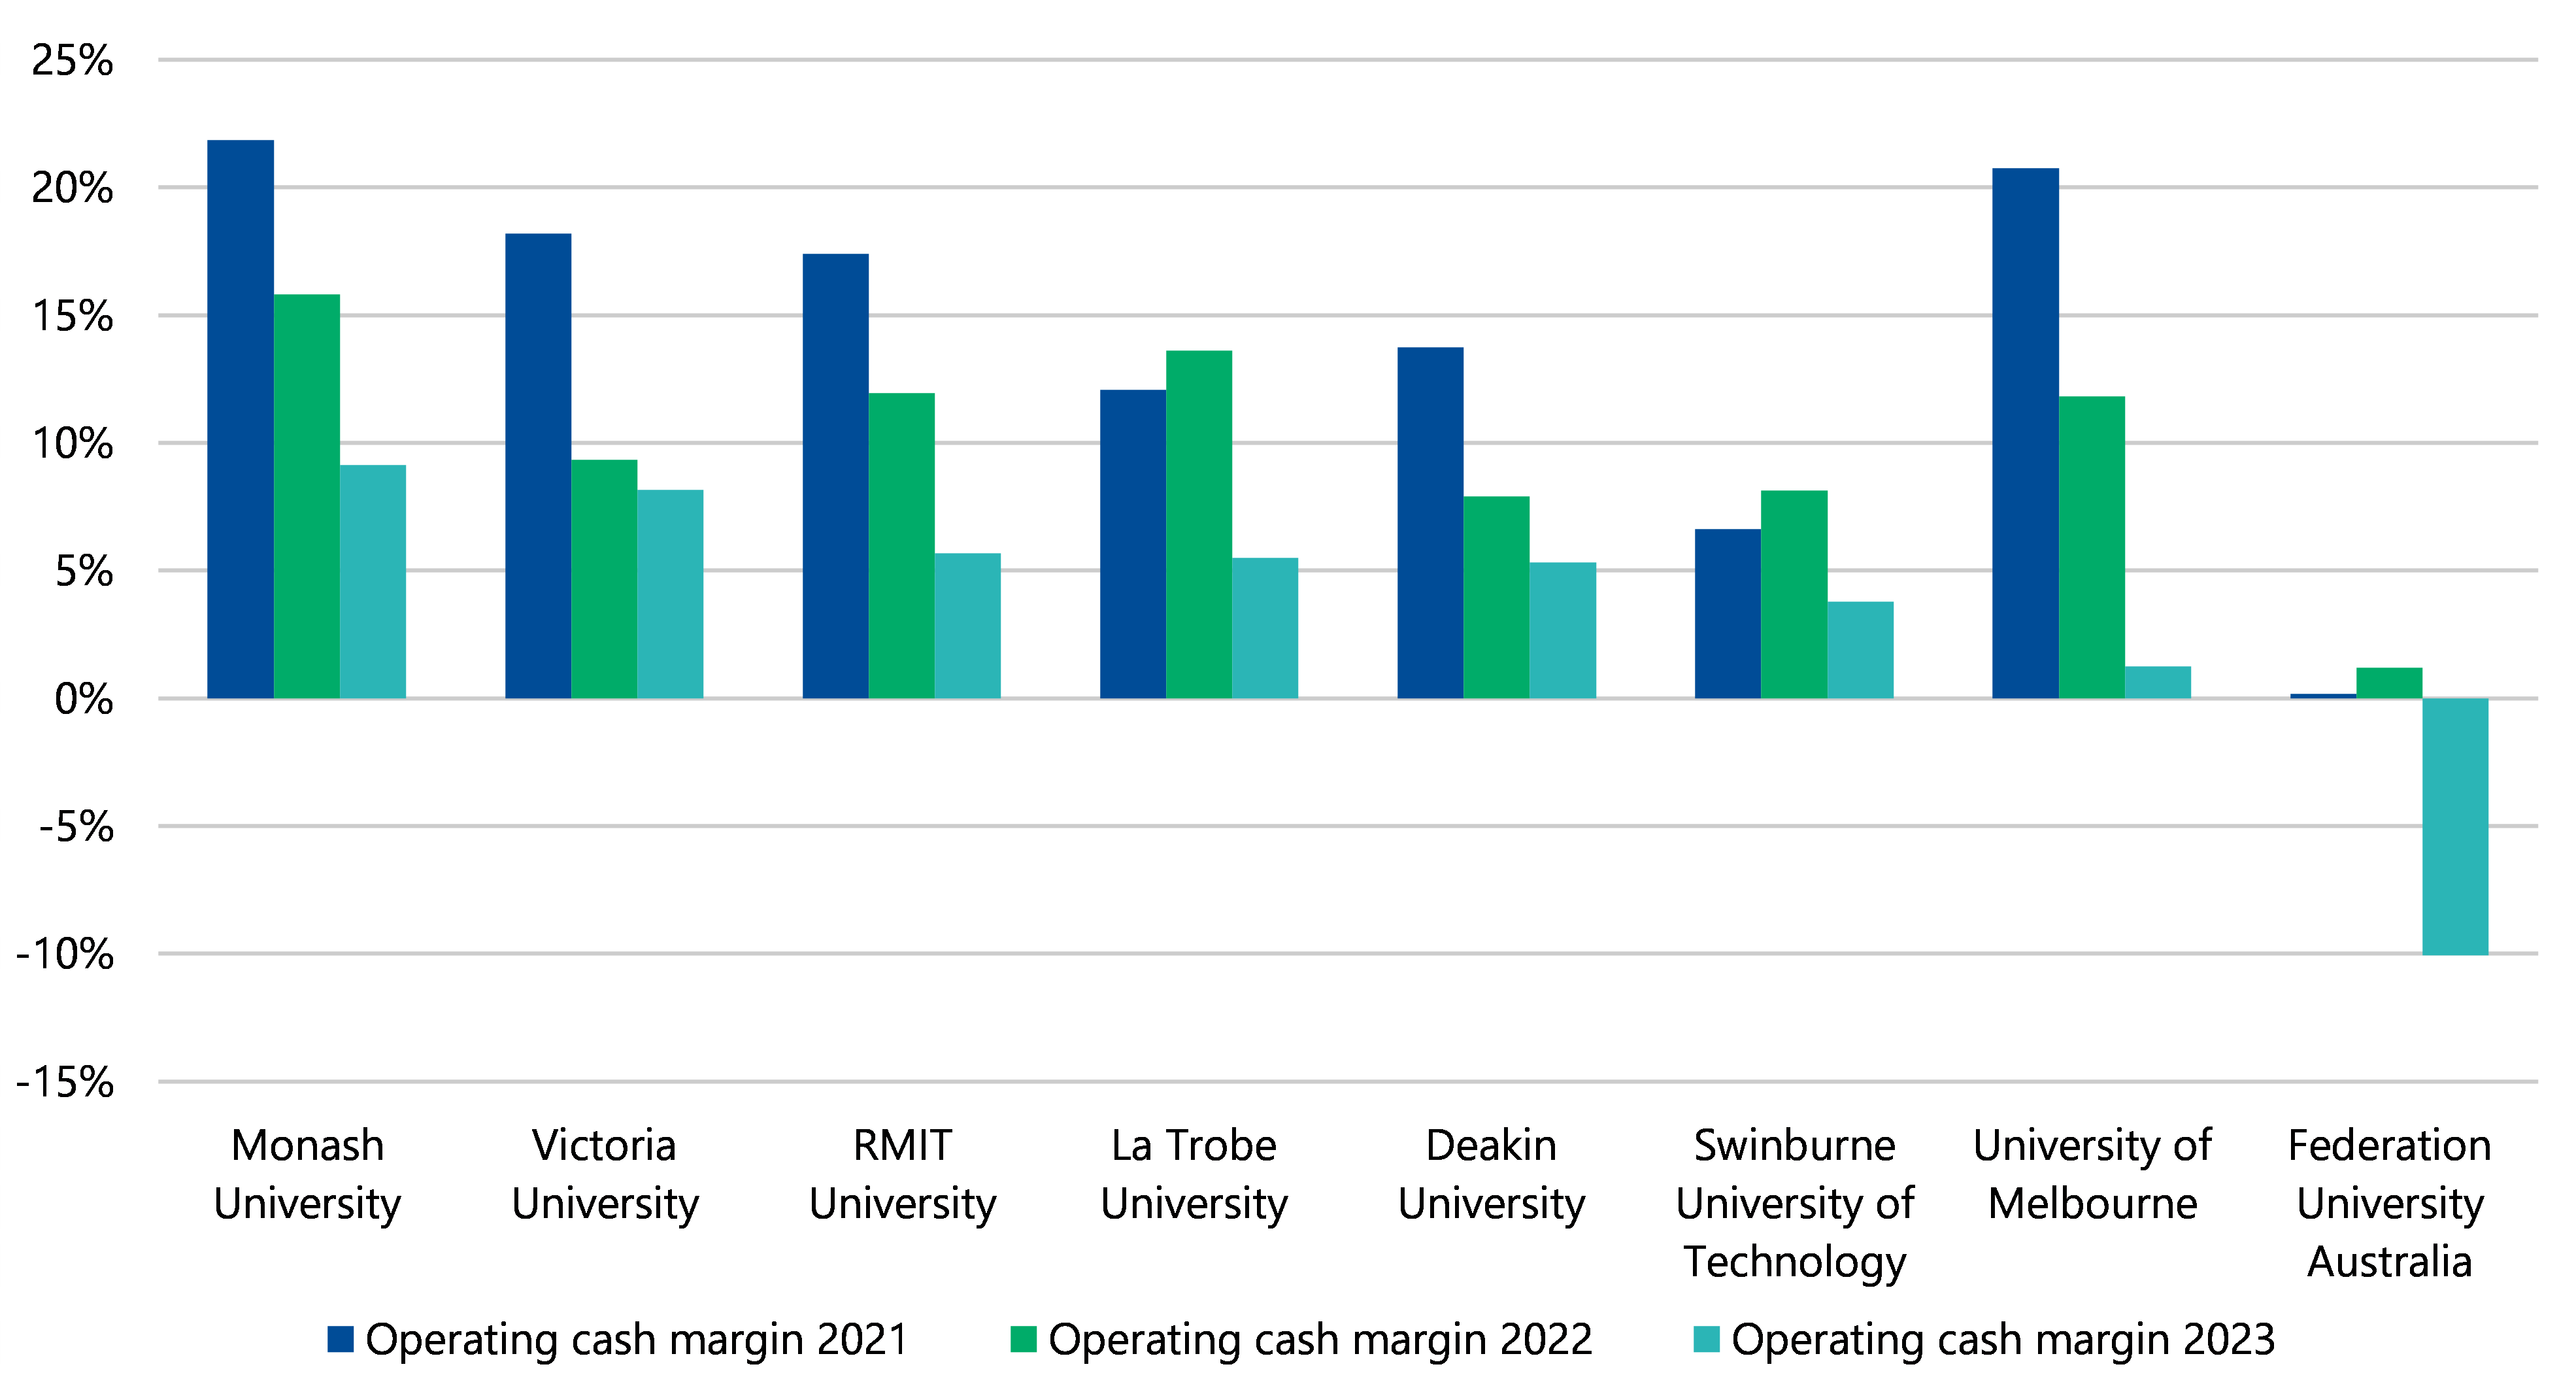
All universities, except for Federation University Australia, were able to generate positive cash flows from their operating activities in 2023. This shows that even though the net result margin, excluding fair value gains and losses on investments, is at a loss, most universities are generating cash to support their operations or allocate cash resources to investing and financing activities.
However, the deteriorating operating cash margin in Figure 12 shows that the cash spending on universities' operations is growing faster than their cash income from these operations. Cash payments to their employees and suppliers increased by 15 per cent from $9.5 billion in 2022 to $10.9 billion in 2023. Unlike in 2022 when Federation University Australia, La Trobe University and Swinburne University of Technology improved their operating cash margin, all universities experienced cash payments increasing at a faster pace than cash receipts in 2023.
Universities need to accumulate operating profits and operating cash surpluses to be able to fund capital works programs, repay debt and make long-term investments. If universities' operating cash margin continues to fall, this may pose challenges to how they can support their operations, investing and financing activities.
Operating cash flows
Operating cash is cash generated or used by a university's business operations. It represents the cash flows directly related to the operations that drive revenue and expenses for the university.
Operating cash flow margin
Operating cash margin is the cash flow surplus or deficit from the operating activities divided by all cash inflows of the operations of a university. This is a measure of how much cash the university has left after payment to its suppliers, employees and other activities that support its operations.
Figure 12: Universities' operating cash margins for 2021, 2022 and 2023
Source: VAGO.
Looking forward
Diversifying revenue sources
As shown in Figure 13, universities have continued to diversify their sources of revenue in 2023. The amount of revenue they earned through investment and other income – which includes contract research, consultancy, partnerships and commercial activities – has continued to increase since the prior year. While 2022 saw a large increase from these streams of 22 per cent, 2023 saw a more modest but still significant 8 per cent increase.
While these increases in other revenue were not sufficient to make up the increases in costs, continuing to seek alternative revenue sources will help to guard universities from potential future impacts to their student-related revenue.
Figure 13: Types of revenue and income universities got from 2019 to 2023 as a percentage of total revenue and income
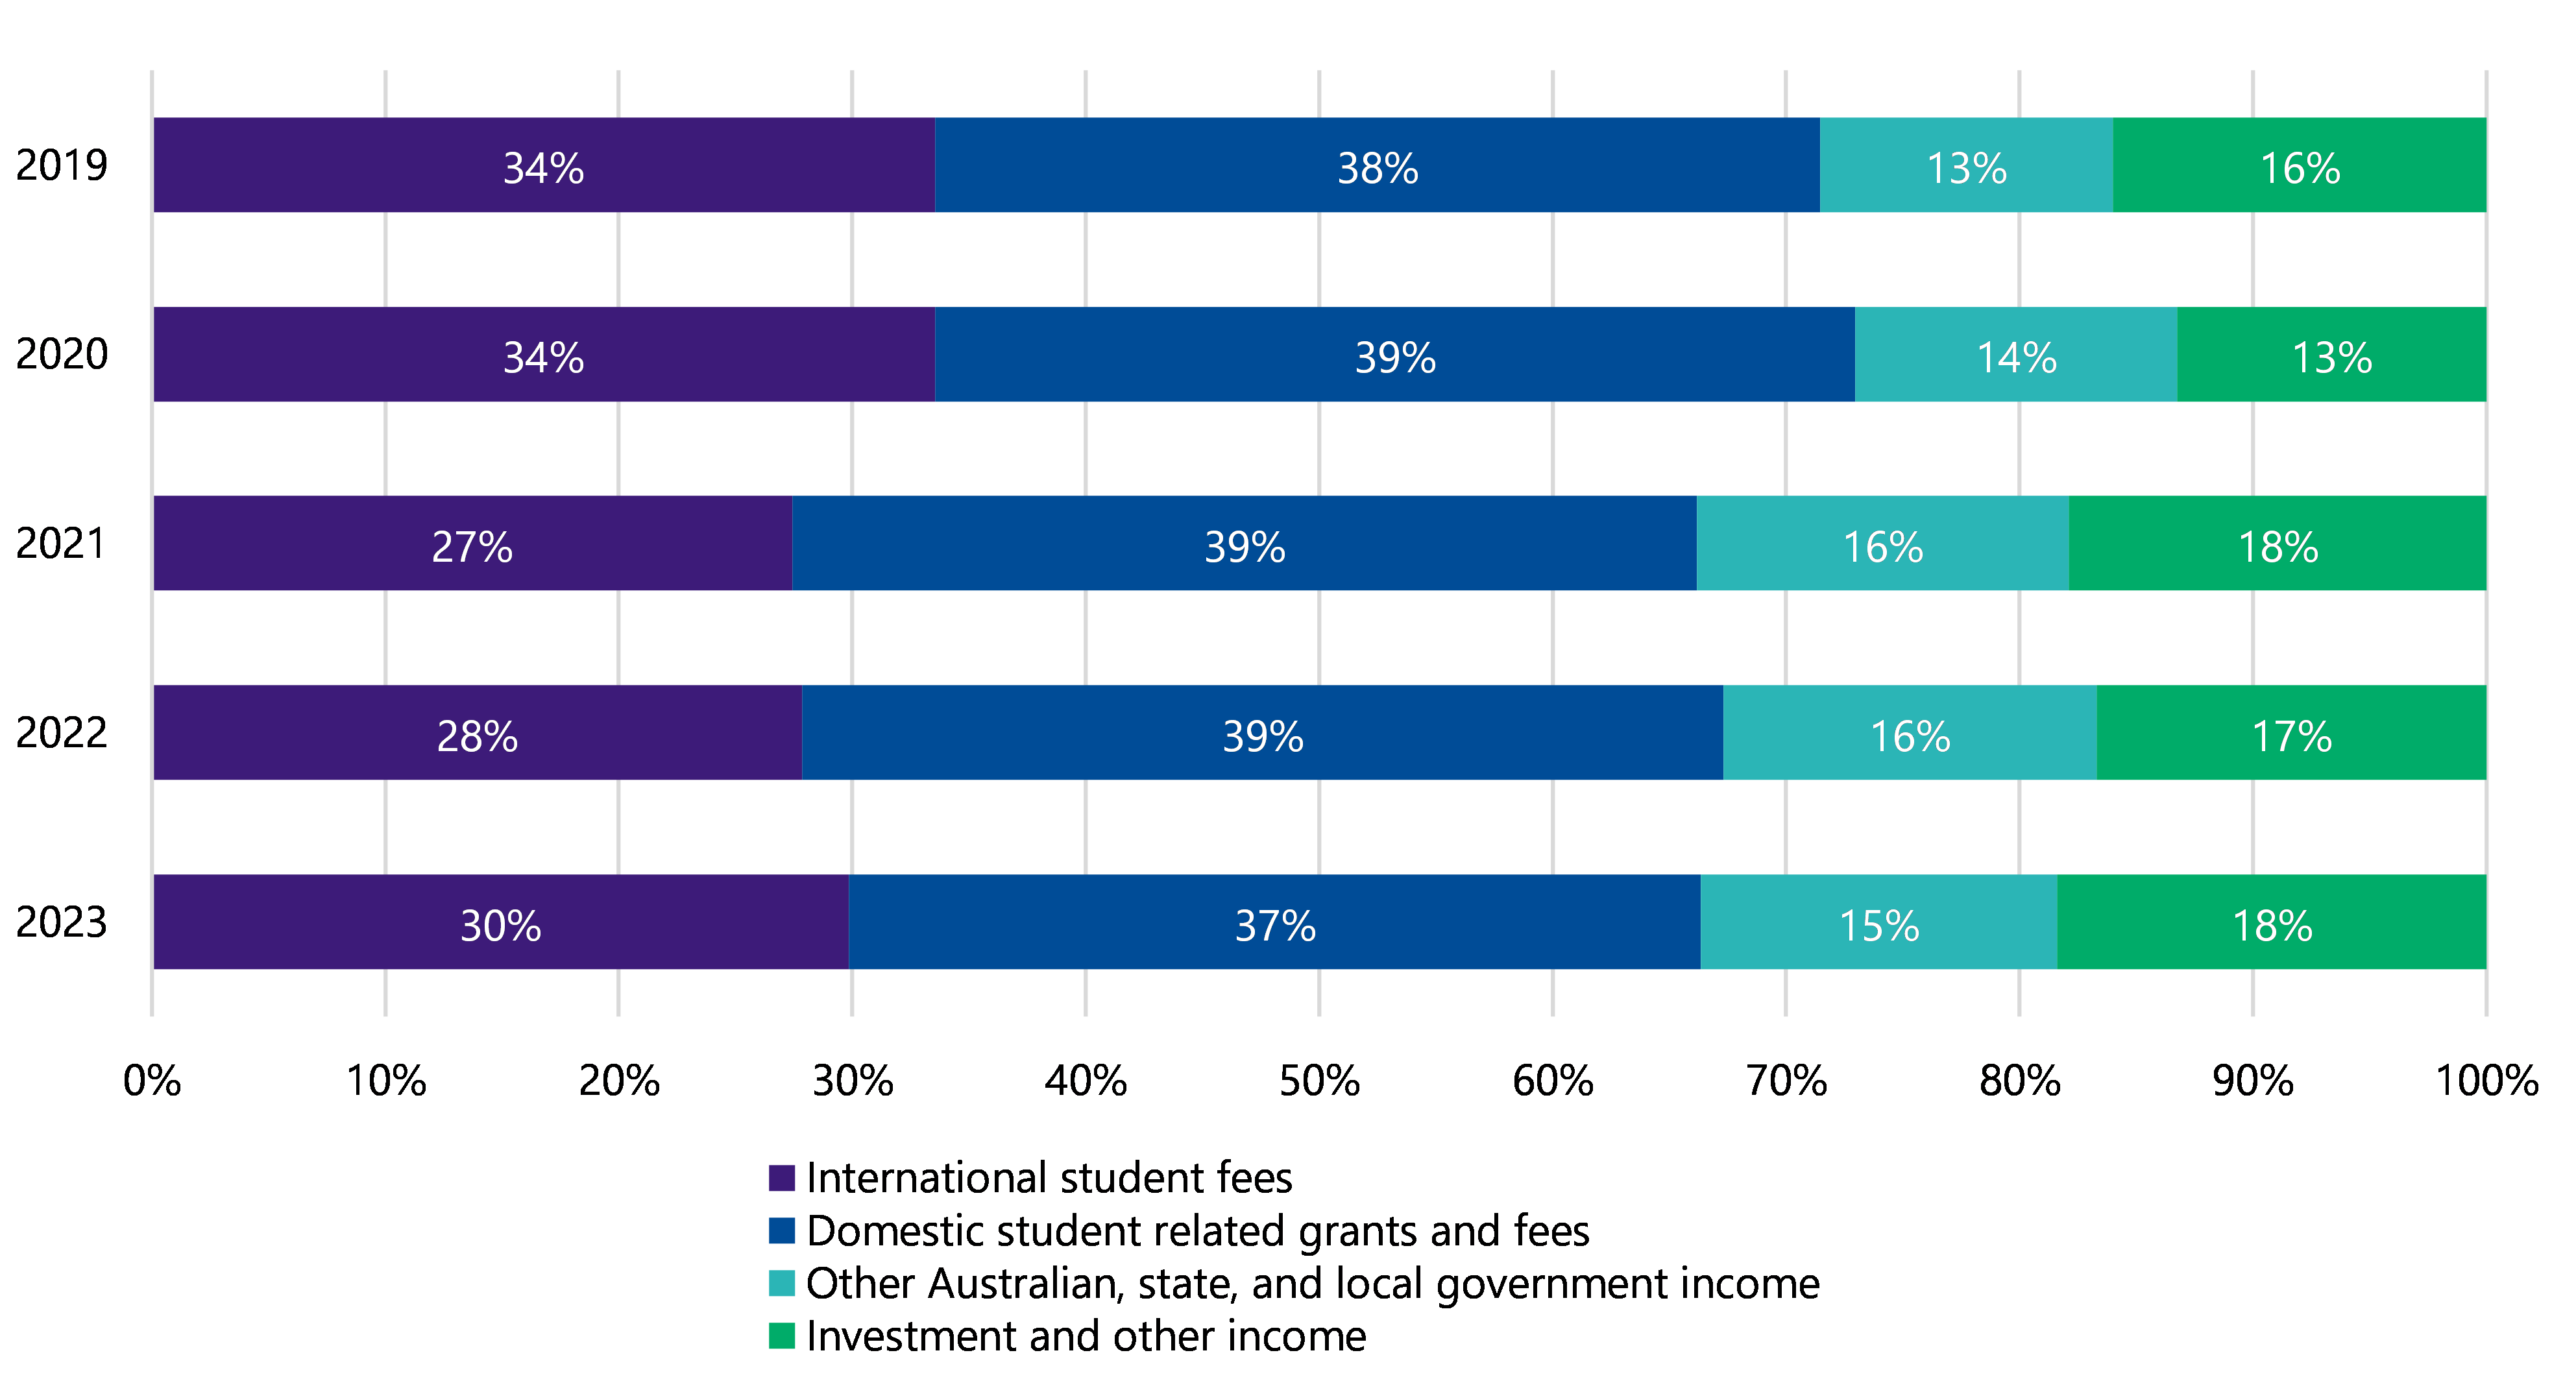
Note: Percentages may not total 100 due to rounding.
Source: VAGO.
Need for fees from international students
While universities are diversifying their revenue sources, in 2023 the revenue earned from international students increased, and at a greater rate than other sources and the previous years.
While the sector is less dependent on international student fees revenue than the peak in 2019 and 2020, the trends in international student revenue shows this reliance may return in future years.
Future challenges
Universities will continue to face challenges on returning to sustainable surpluses. Most universities have negotiated, or are negotiating, a new enterprise bargaining agreement to come into effect in early 2024. This may see employee benefits costs increase.
Enterprise bargaining agreement
An enterprise bargaining agreement is a negotiated agreement between an employer and its employees (usually through a union) that sets out wages, working conditions and other employment terms specific to that workplace.
Ongoing cost of living pressures and housing supply challenges in Australia may make Victorian public universities a less attractive place to undertake study, weakening the ongoing recovery in student numbers. And with the Australian Universities Accord Final Report released in February 2024, the sector faces ambiguity about how the Australian Government will fund domestic student placements in the longer term.
As proven in 2022 and shown in Figure 4, universities cannot rely on consistent investment gains and other investment income to record a net profit. They will need to ensure that the results from their principal service of delivering teaching and research can support their operations.
On the other hand, some recommendations in the Australian Universities Accord Final Report may increase the domestic demand to study at university. Should these recommendations be adopted, the number of domestic students may reverse this recent trend and start to increase. Universities will need to be adaptable to these changing circumstances to address these challenges.
3. Internal controls
Universities have adequate internal controls to support reliable financial reporting. Improvement to some key information technology (IT) controls is still an ongoing effort.
Internal control environments are improving
Summary
When designing our audit procedures, we consider the design of internal controls relevant to an entity's financial report. We may then decide to assess the implementation of these controls if efficient to do so.
In 2023, we raised 18 moderate and high-risk new findings across the universities. The universities resolved one current year issue and 11 prior year issues, with only 3 prior year issues being outstanding.
As Figure 14 shows, universities had 17 unresolved newly raised issues in 2023 compared with 10 such issues in 2022. Unresolved prior year issues totalled 3, which is an improvement from 2022, attributable to managements' effort in successfully addressing 11 out of the 14 control weaknesses we found in the previous years.
Figure 14: Unresolved new and prior period issues from 2019 to 2023
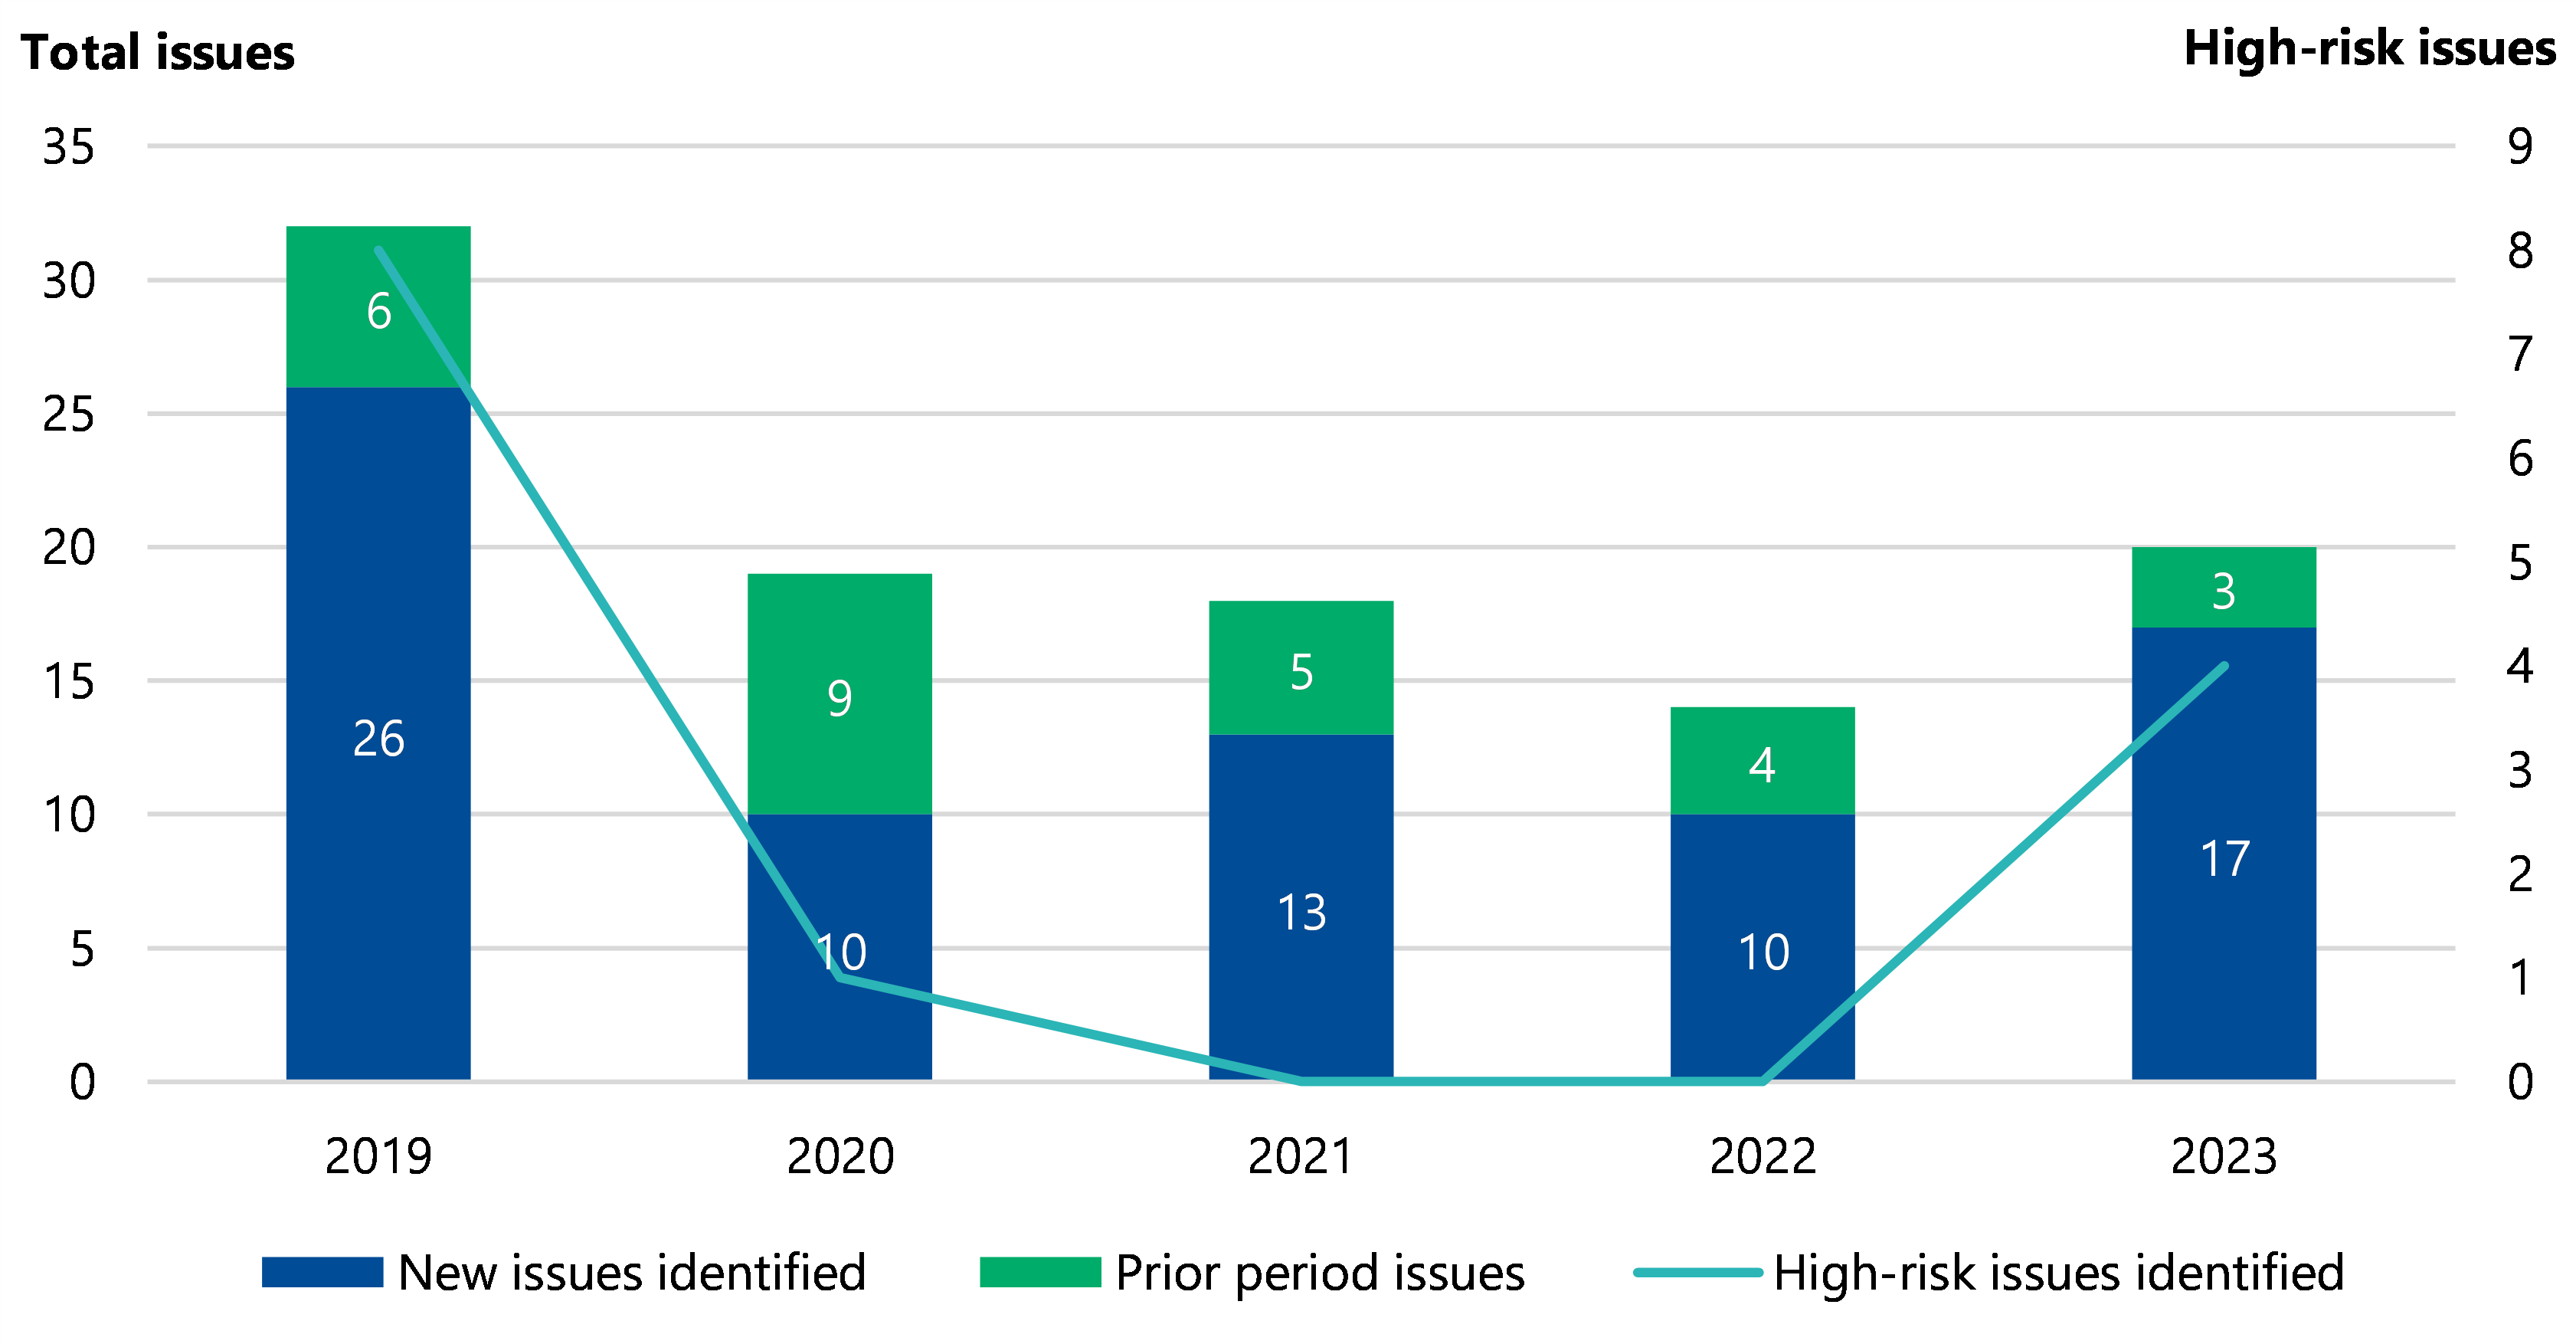
Note: We excluded low-risk issues because we consider them as minor or opportunities to improve controls. The issues are based on a 3-tier risk rating per Appendix F.
Source: VAGO.
IT issues remain the key challenge
High-risk issues
We found 4 high-risk issues in 2023, compared with none in the previous 2 years. All issues related to IT systems. Two issues relate to managing system access and 2 issues relate to managing changes. These continue to be the most commonly found IT control weakness across all universities and we have summarised the causes below.
| We found issues related to … | Which are caused by … | Which are important because … |
|---|---|---|
controlling who has access to IT systems
|
| these prevent users that either should not have access, or should have less access, from inadvertently or deliberately altering the system or of having access to data.
|
| managing changes to the configuration of systems | a lack of formal, documented process configuration and change management processes | these controls ensure that a security weakness is not inadvertently or deliberately added into a system while it is being configured. |
Moderate-risk issues
Figure 15 describes the common moderate-risk issues we detected across the universities by category. Compared with 2022, most of the issues found related to finance practices, including inadequate policies and procedures, and staff not following existing policies and procedures.
Figure 15: Moderate-rated IT and non-IT control issues we identified by type in 2022 and 2023
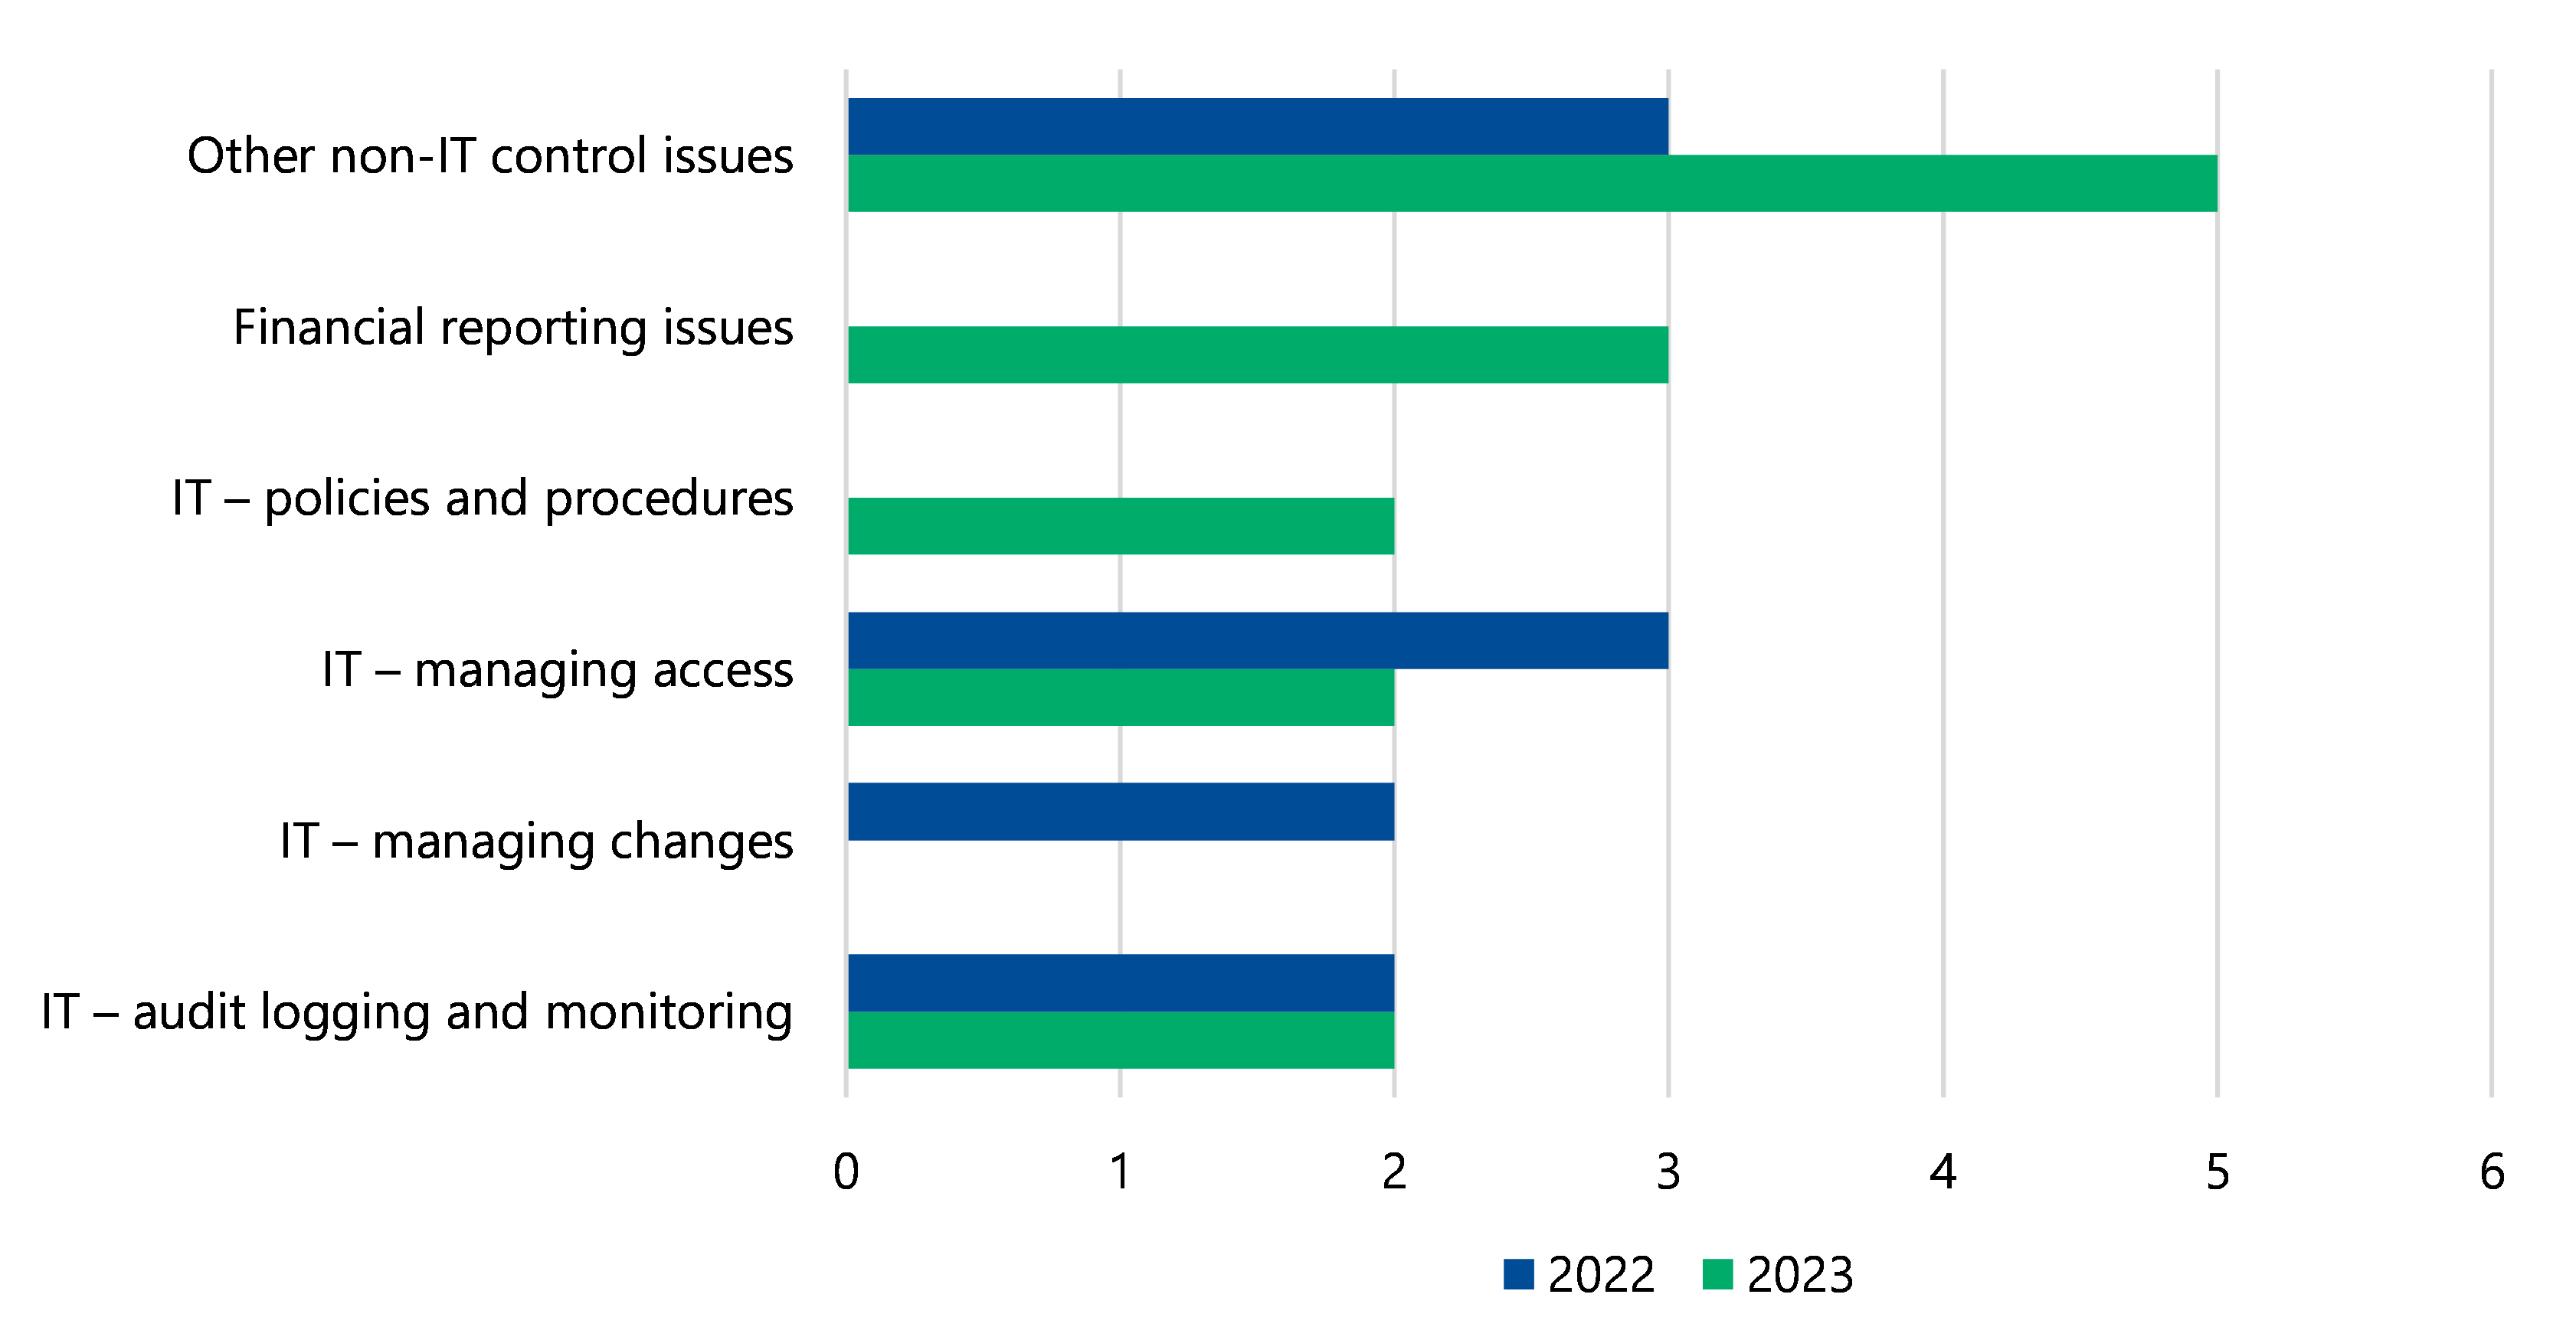
Source: VAGO.
Three of the unresolved issues were originally found in 2022 or prior. They all relate to IT systems. IT issues can take longer to resolve as they often need aid from software developers or through moving to new systems. But it is important that universities have compensating controls in place while waiting to implement these rectifications or move over to new systems.
While pleasing that universities are reducing the number of unresolved older issues, they should continue to prioritise closing these as soon as possible.
Recommendation
Universities with outstanding prior period issues
We recommend that universities with unresolved IT control weaknesses:
- review the actions and timelines established to resolve these weaknesses, with a focus on risk if left unaddressed and the ageing of the finding
- for longer-term action plans – such as system replacements – ensure adequate compensating safeguards are in place until the actions can be finalised.
Appendix A: Submissions and comments
Download a PDF copy of Appendix A: Submissions and comments.

Appendix B: Sector context
Appendix C: Audit opinions
Appendix D: Our audit approach
Appendix E: Abbreviations, acronyms and glossary
Download a PDF copy of Appendix E: Abbreviations, acronyms and glossary.
Appendix F: Control issue risk ratings
Download a PDF copy of Appendix F: Control issue risk ratings.
Appendix G: Financial and non-financial sustainability indicators
Download a PDF copy of Appendix G: Financial and non-financial sustainability indicators.
Download Appendix G: Financial and non-financial sustainability indicators