Technical and Further Education Institutes: 2015 Audit Snapshot
Overview
The financial position of the technical and further education (TAFE) sector has improved at 31 December 2015 compared to prior years. This has been driven by reduced spending in the sector and $159.3 million in additional grant funding provided by the state government to TAFE entities during 2015. The sector recorded a collective net surplus of $37.2 million at 31 December 2015 (2014: $83.1 million net deficit).
As a result, our financial sustainability risk analysis of the sector has improved with the indicators showing positive short-term results. The challenge for the sector is to translate this into a longer-term financially sustainable business model.
There has also been positive change in performance reporting in the sector. The Department of Education & Training have developed a performance reporting framework which is being implemented and is on track to be in place for the 2016 reporting cycle.
Our review of the fraud control frameworks in place at the TAFEs identified that TAFEs are adopting too narrow a definition for fraud. This means that the risk of all types of fraud occurring are not being adequately mitigated.
Technical and Further Education Institutes: 2015 Audit Snapshot: Message
Ordered to be published
VICTORIAN GOVERNMENT PRINTER May 2016
PP No 157, Session 2014-16
President
Legislative Council
Parliament House
Melbourne
Speaker
Legislative Assembly
Parliament House
Melbourne
Dear Presiding Officers
Under the provisions of section 16AB of the Audit Act 1994, I transmit my report Technical and Further Education Institutes: 2015 Audit Snapshot.Yours faithfully

Dr Peter Frost
Acting Auditor-General
26 May 2016
Auditor-General's comments
|
Dr Peter Frost Acting Auditor-General |
Audit team Simone Bohan—Engagement Leader Helen Grube—Team Leader Ryan Ackland—Team member Engagement Quality Control Reviewer Ronald Mak |
It is pleasing to be able to report some positive trends coming from our review of the 2015 financial and performance reports for the technical and further education (TAFE) sector. This is in contrast to my messages from the past two reports, where our financial sustainability indicators and the financial results for the sector were in decline.
This year, an additional $159.3 million in state government-funded programs has increased revenue for the sector. This injection of additional funding late in the financial year has also meant an improved liquidity position at 31 December 2015. At the same time, the sector achieved an overall reduction in expenditure.
However, financial sustainability risks remain. In particular, we have observed a continuing decline in spending on new assets and asset renewal when compared to asset consumption (as measured by the rate of depreciation). Over time, this could mean that assets might not be fully fit for purpose. TAFE institutes should manage this risk.
Although we note several positive findings from our audits, we also highlight some areas for attention. It is disappointing to have to report to Parliament again that the 2014 Federation Training financial report is not finalised. The statutory time frame for finalising the financial report was 22 March 2015. It is not acceptable for a financial report—a key financial accountability document—to remain unresolved for this length of time.
I expect that TAFEs will act on the opportunities for improvement highlighted in this report—namely, improving the timely resolution of audit-identified issues so that weaknesses in controls or other areas of risk are addressed. Also, TAFEs should act to broaden how they view and mitigate fraud through their fraud control frameworks and increase staff awareness through training. There are lessons to be learnt from the work of the Independent Broad-based Anti-corruption Commission (IBAC). TAFEs should use IBAC's work and, importantly, apply the lessons through the suggested controls and better practice materials that IBAC has developed.
I would also like to acknowledge the effort of the Department of Education & Training (DET), along with TAFEs, to introduce a new performance reporting framework during 2015. This includes the reporting of four mandatory performance indicators by all TAFEs at 31 December 2015 and an improvement to information included in performance reports about the indicators. DET has implemented the new framework in 2016.
Dr Peter Frost
Acting Auditor-General
May 2015
Audit Summary
This report presents the outcomes of the 2015 financial audits of the 11 technical and further education (TAFE) institutes and the 15 entities they control that have finalised their financial and performance reports. It includes a review of the financial sustainability of the sector and the frameworks in place for managing fraud and corruption risks.
This report does not include the financial results for a twelfth TAFE—Federation Training—because the institute's financial and performance reports for 2014 and 2015 have not been finalised. In addition, these issues meant that the focus area review on fraud control was not conducted at Federation Training.
Conclusions
In 2015, there were some significant positive trends in the financial outcomes and performance reporting of the TAFE sector. Although short-term results have improved, the long-term challenges of generating adequate surpluses to maintain and renew assets remain. This is a key ongoing risk for the sector.
TAFE fraud control frameworks might not be fully effective, because they are narrow in scope and, consequently, do not consider all types of fraud that a TAFE might face. This means that TAFEs are exposed to potential areas of fraud that may not be mitigated.
Findings
Audit reports
Clear financial audit opinions were issued to 26 of the 27 entities within the TAFE sector, whose financial reports for the year ending 31 December 2015 had been finalised. Parliament and the citizens of Victoria can have confidence in these financial reports. The audit opinion for Sunraysia Institute of Technical and Further Education included an emphasis of matter, drawing the user's attention to the material uncertainty regarding the entity's going concern status.
In conducting our financial audits, we noted that the financial reporting internal controls at the 11 TAFEs, to the extent tested during our audit, were adequate for preparing each TAFE's financial report. Weaknesses were identified and reported to TAFE boards in interim and final management letters, so action could be taken.
In our management letters last year, we raised 23 extreme-, high- or medium-risk control-related issues. We noted that more than 85 per cent of previously reported issues had been resolved at 31 December 2015. TAFEs need to ensure that they address the outstanding issues identified in a timely manner. Not to do so increases the risk that their control environments are not as strong as they should be and that a material error or fraud might not be detected.
At the time of preparing this report, the 2014 and 2015 financial statements for Federation Training had not been finalised. Federation Training has prepared 49 drafts of its 2014 financial report, but material reporting problems remain to be resolved. The time taken to finalise this financial report is not acceptable and represents an accountability gap for the TAFE.
Financial sustainability risks
The 11 TAFEs and their subsidiaries that have finalised their financial reports generated a combined net surplus of $37.2 million for the year ending 31 December 2015.
This result is a turnaround from 2013 and 2014, when the TAFEs had large combined net deficits ($83.1 million in 2014). State government Support Grants increased the sector's revenue by $159.3 million in 2015 while, at the same time, the TAFEs expenditure reduced. Combined, this resulted in a surplus for the sector.
The surplus result has meant the sector as a whole has an improved financial sustainability risk assessment. In particular, the short-term financial sustainability indicator of the net result was assessed as low risk in 2015 after being assessed as high risk in 2014. This followed the receipt of additional government funding, most of it late in the year, which had not been fully spent.
When measuring longer-term financial sustainability risks, we consider the ability of TAFEs to generate enough revenue to fund new assets and asset renewal, and whether TAFEs are spending enough on new assets and asset renewal every year.
In 2015, most TAFEs did not fund new assets and asset renewal at the same rate as they consumed assets, as measured by depreciation. The effect of this underspending on new assets and asset renewal could mean that, over time, TAFE assets might no longer be fit for purpose. This is a long-term risk that TAFEs should monitor and manage.
Performance reporting
The Department of Education & Training (DET) and TAFEs are working to improve TAFE performance reporting and are largely addressing recommendations we have made in previous reports. As a result, we have observed better-quality performance statements in 2015, as TAFEs included more information describing indicators and the method of calculation, and more detailed explanations of variances.
Also in 2015, DET introduced four mandatory performance indicators that all TAFEs reported on. These indicators bring comparability to the sector's performance reporting. However, the absence of a benchmark or target makes it difficult to interpret the sometimes large variation in results.
DET has implemented a performance reporting framework and tool in 2016.
Fraud control frameworks
An effective fraud control framework plays a significant role in reducing the risk of fraud and should be a central component of all TAFEs' risk management activities.
We reviewed the fraud control frameworks at TAFEs and found that, although TAFEs have fraud control policies and procedures in place, their effectiveness is reduced because they define too narrowly what fraud is. Therefore, TAFEs may not be mitigating all fraud risks.
The focus of fraud prevention and control at TAFEs is limited to misappropriation of assets and theft. However, fraud also occurs when staff improperly use information and their position for personal gain and where there is deliberate falsification, concealment, destruction or use of falsified documents. Fraud of this nature is occurring in the public sector, and instances are being investigated and reported by the Independent Broad-based Anti-corruption Commission (IBAC). These genuine fraud risks should be mitigated.
To be effective, fraud awareness and a TAFE's designated fraud control framework need to be communicated to, and embedded throughout, an organisation. This is routinely achieved by providing staff training and updates regularly. However, only six of the 11 TAFEs are doing this and providing training to contractors, volunteers and suppliers. No TAFE provides targeted training to staff such as procurement staff and executive officers, whose roles mean that they are more likely to come across suspected fraud.
A survey of staff at two selected TAFEs confirmed that they have a narrow understanding of fraud. However, most staff were aware of their reporting obligations and felt comfortable reporting fraud if they identified it.
Recommendations
That technical and further education institutes' governing boards and management:
- implement appropriate governance and monitoring mechanisms to ensure that all audit findings are addressed in a timely manner.
That technical and further education institutes:
- continue reviewing their business model to respond to recent funding changes to ensure that long-term financial sustainability issues are addressed
- address longer-term financial sustainability issues by planning for and monitoring asset replacement and renewal
- integrate fraud control frameworks with strategic and corporate activities
- review fraud control policies and expand the definition and consideration of fraud beyond theft to include deliberate falsification, concealment, destruction or use of falsified documentation, and the improper use of information or position for personal financial benefit
- provide regular training to staff on fraud policies and procedures, and provide tailored training to staff in high-risk roles
- have in place systems and processes that ensure that all losses are captured and assessed for reporting under the Financial Management Act 1994.
Submissions and comments received
We have professionally engaged with all TAFEs and DET throughout the course of the audit. In accordance with section 16(3) of the Audit Act 1994, we provided a copy of this report, or relevant extracts to those agencies and requested their submissions or comments.
We have considered those views in reaching our audit conclusions and have represented them to the extent relevant and warranted. Their full section 16(3) submissions and comments are included in Appendix F.
1 Context
1.1 Report coverage
This report provides information on the outcomes and findings of the 2015 financial audits of 11 technical and further education (TAFE) institutes and the 16 entities they control. Appendix A details the entities covered in this report.
The twelfth TAFE, Federation Training, is excluded from all sections of this report, as the audit of its 2015 financial report has not yet occurred. Section 1.3.2 has more information about Federation Training.
The report also discusses the 2014 financial audits of Federation Training and Wodonga Institute of TAFE, because these audits had not been finalised when we published our previous report Technical and Further Education Institutes: 2014 Audit Snapshot.
Figure 1A outlines the structure of this report.
Figure 1A
Report structure
Part |
Description |
|---|---|
Part 1: Context |
Discusses the outcome of the 2015 financial audits, and internal control issues identified across the sector. Provides information regarding the 2014 financial audits of Federation Training and Wodonga Institute of TAFE. |
Part 2: Financial outcomes |
Comments on the financial outcomes of the TAFE sector over the five-year period to 31 December 2015, including discussion of key financial issues affecting the 2015 financial statements. Discusses the financial sustainability risks that the sector faces. |
Part 3: Performance reporting |
Comments on performance reporting in the TAFE sector, including a description of the new reporting framework implemented by the Department of Education & Training in 2016. |
Part 4: Fraud risks and controls |
Assesses fraud risk identification and control framework across the 11 TAFEs, and discusses the effect of an organisation's culture on the effective implementation and promotion of a TAFE's fraud framework. |
Source: Victorian Auditor-General's Office.
Pursuant to section 20(3) of the Audit Act 1994, unless otherwise indicated, any persons named in this report are not the subject of adverse comment or opinion.
The total cost of this report was $140 000.
1.2 Financial audits outcomes for 2015
1.2.1 Financial audit opinions
At the time of writing, the financial audits of the 2015 financial reports for 11 TAFEs and 15 of the 16 controlled entities had been completed. Clear audit opinions were issued for all entities.
Although no modification was made to the audit opinion, an emphasis of matter paragraph was inserted into the audit opinion of Sunraysia Institute of Technical and Further Education. The paragraph draws the reader's attention to the disclosure made in note 1 regarding the material uncertainty around the going-concern assumption. This is the second year an emphasis of matter paragraph on this item has been included in the audit opinion of this TAFE.
Ten of the 11 TAFEs finalised their financial report within the time frames set by the Financial Management Act 1994, which requires entities to finalise their audited financial statements within 12 weeks of the end of the financial year. William Angliss Institute of TAFE did not meet this time frame.
1.2.2 General internal controls
During our financial audits, we reviewed the financial reporting internal controls in place at TAFEs and, to the extent these controls were tested through these audits, we found these controls adequate for the fair preparation of the TAFEs’ financial reports.
However, we identified instances where important internal controls need to be strengthened. These weaknesses were formally reported to the board, chief executive officer and the audit committee of the TAFEs through a management letter. Typically, two management letters are provided throughout a financial audit—an interim and a final management letter. Each identified issue receives a risk rating. Appendix B includes information about the risk ratings we used.
In 2015, 14 extreme-, high- or medium-rated control weaknesses were reported to the entities concerned through the management letters. Figure 1B summarises the control weaknesses reported.
Figure 1B
2015 issues identified by audit across the 11 TAFEs
Area of issue |
Risk rating of issue |
|||
|---|---|---|---|---|
Extreme |
High |
Medium |
Total |
|
Assets |
– |
– |
1 |
1 |
Expenditure |
– |
1 |
– |
1 |
Governance |
1 |
1 |
2 |
4 |
IT controls |
– |
– |
3 |
3 |
Other |
– |
– |
1 |
1 |
Payroll |
– |
– |
2 |
2 |
Revenue |
– |
1 |
1 |
1 |
Total |
1 |
3 |
10 |
14 |
Source: Victorian Auditor-General's Office.
Four of the 14 matters raised, including the one rated extreme, relate to breaches of the Standing Directions for the Minister for Finance, with which all entities reporting under the Financial Management Act 1994 must comply. In particular, two TAFEs did not comply with Standing Direction 4.5.6 Treasury Management, which requires all investments over $2.0 million to be invested with the Treasury Corporation of Victoria. By investing elsewhere, the TAFEs are in breach of the standing directions.
TAFEs should seek to address all matters raised to remove potential weaknesses in their control frameworks. The rating definitions in Appendix B include recommended time lines for the resolution of these matters.
Status of issues identified in 2014
The status of internal control weaknesses identified in previous years is presented and communicated to TAFEs and their audit committees through the current year's management letters. These matters are monitored to ensure that weaknesses that previous audits have identified in the control environments are resolved promptly. Figure 1C shows the internal control weaknesses in 2014, with the resolution status by level of risk.
Figure 1C
Internal control weaknesses identified in 2014—resolution status by risk
Area of issue |
Risk rating |
|||
|---|---|---|---|---|
Extreme |
High |
Medium |
Total |
|
Unresolved |
– |
1 |
2 |
3 |
Resolved |
1 |
3 |
16 |
20 |
Total |
1 |
4 |
18 |
23 |
Source: Victorian Auditor-General's Office.
More than 85 per cent of problems identified in previous audits had been resolved at 31 December 2015. Although this is positive, TAFEs need to ensure that they address all weaknesses identified in a timely manner, and follow the recommended time lines for the resolution of issues as detailed in Appendix B. If not, the control environments in place at these TAFEs may not be as effective as they could be.
1.3 Financial audit opinions for 2014
At the date of tabling our previous report Technical and Further Education Institutes: 2014 Audit Snapshot (May 2015), the 2014 financial audits for Federation Training and Wodonga Institute of TAFE had not been finalised. This section provides an update on these audits as at May 2016.
1.3.1 Wodonga Institute of TAFE
The financial statements of Wodonga Institute of TAFE for the year ending 31 December 2014 were finalised on 17 March 2015. The TAFE's annual report containing the finalised financial statements was tabled in Parliament in April 2015.
After tabling, Wodonga Institute of TAFE notified VAGO that the 2014 financial statements were materially misstated. The audit opinion was immediately withdrawn on 19 May 2015. This matter was under investigation at the time of our previous report to Parliament.
What caused the material misstatement
The Driver Education Centre of Australia Ltd is a wholly controlled entity of Wodonga Institute of TAFE. As a result, Wodonga Institute of TAFE's consolidated financial statements include the financial results of this entity.
Note 1.04 of Wodonga Institute of TAFE's financial statements discloses that all intra group transactions between the TAFE and the Driver Education Centre are eliminated as part of preparing the consolidated financial report.
However, the 2014 financial statements originally tabled in Parliament contained intra group transactions that had not been eliminated. This meant that both the total consolidated revenue and expenditure amounts were overstated by $9.1 million in Wodonga Institute of TAFE's financial statements. This error had no impact on the net result of the entity.
Details of the error are included in note 28 of Wodonga Institute of TAFE's revised 2014 financial statement.
Revised financial statements
The audit opinion for the revised 2014 financial statements of Wodonga Institute of TAFE was issued on 28 October 2015. The unmodified opinion included an 'emphasis of matter' paragraph which draws attention to the re-issue of the audit opinion, and to note 28 of the financial statements.
1.3.2 Federation Training
As at the time of preparing this report, the 2014 financial statements for Federation Training had not been finalised. This means that the financial statements are more than 12 months late. This delay is unacceptable and means there is an accountability gap for Parliament and the public regarding Federation Training.
The delays in finalising the financial statements are because:
- a number of financial reporting issues that the TAFE has been unable to resolve to date
- Federation Training has been unable to verify and substantiate all material components of the financial statements
- complications caused by the amalgamation of financial information from the two former TAFEs—Advance TAFE and Central Gippsland TAFE—into Federation Training's financial statements.
To date, Federation Training has prepared 49 drafts of the financial statements and has addressed most of the audit issues raised. However, as at May 2016, there remain material unresolved issues.
The significant issue that will not be resolved is that Federation Training has been unable to substantiate the validity of all debtors at 31 December 2014. Due to inaccurate receipting practices and a lack of timely reconciliation of bank accounts, discrepancies exist that mean Federation Training cannot substantiate which debtors have paid and which remain outstanding. Aligned to this, there is a reconciling amount in the bank account which is unable to be allocated against the corresponding debtors. This is a significant control breakdown and a breach of the Minister for Finance's Standing Directions under the Financial Management Act 1994.
The delays in finalising the 2014 financial statements have consequently impacted the timely completion of the 2015 financial statements. VAGO will continue to engage with Federation Training and the Department of Education & Training to assist the TAFE as far as is practical and appropriate, so it can finalise its financial statements.
Recommendation
- That technical and further education institutes’ governing boards and management implement appropriate governance and monitoring mechanisms to ensure that all audit findings are addressed in a timely manner.
2 Financial outcomes
At a glance
Background
At 31 December 2015, the technical and further education (TAFE) sector, consisting of 11 TAFEs and 16 controlled entities, made a net surplus of $37.2 million ($83.1 million deficit in 2014). Federation Training has been excluded from this analysis.
Conclusion
The financial sustainability risk rating for the TAFE sector has improved in 2015. Although this has had an immediate short-term impact, TAFEs need to consider the long-term asset maintenance and renewal risks after that period of financial challenge.
Findings
- The state government has provided TAFEs with $159.3 million in new program funding, most of it in late 2015. This, combined with ongoing spending cuts made by the TAFEs, has produced a net surplus for 2015, and improved the liquidity ratio at 31 December 2015.
- The new program funding was awarded in December 2015, contributing to an improved financial sustainability risk rating for the sector, when compared to the previous two financial years.
- In 2015, at most TAFEs, spending on replacing and renewing assets did not match the consumption of assets, as measured by depreciation. The effect of this over time may mean TAFE assets may not be fit for purpose.
Recommendations
- That technical and further education institutes continue reviewing their business model to respond to recent funding changes to ensure that long-term financial sustainability issues are addressed.
- That technical and further education institutes address longer-term financial sustainability issues by planning for and monitoring asset replacement and renewal.
2.1 Introduction
This Part looks at the collective financial position at 31 December 2015 of the 11 technical and further education (TAFE) institutes whose financial statements have been finalised. It details the main drivers behind the net result achieved by the sector and includes an analysis of the change in composition of funding for the sector after recent funding announcements.
We include an analysis of the sector against four financial sustainability risk indicators.
We have excluded the financial information for Federation Training from the five-year sector analysis because the 2014 and 2015 financial reports are not yet complete.
2.2 Conclusion
The short-term financial outcomes for the sector improved in 2015 following two consecutive years of deficits. However, the long-term impact following that period of financial challenge represents a risk for the sector as it may have insufficient funds to maintain or renew assets.
2.3 Financial overview of the sector
At 31 December 2015, TAFEs reported a combined net surplus of $37.2 million. This is a significant change from 2014, which saw the sector report a loss of $83.1 million. It also represents a turnaround in the year-on-year financial decline that began in 2012 after a fundamental change in the funding approach for the sector. This is shown in Figure 2A.
Figure 2A
Net result of TAFE sector, 2011–15
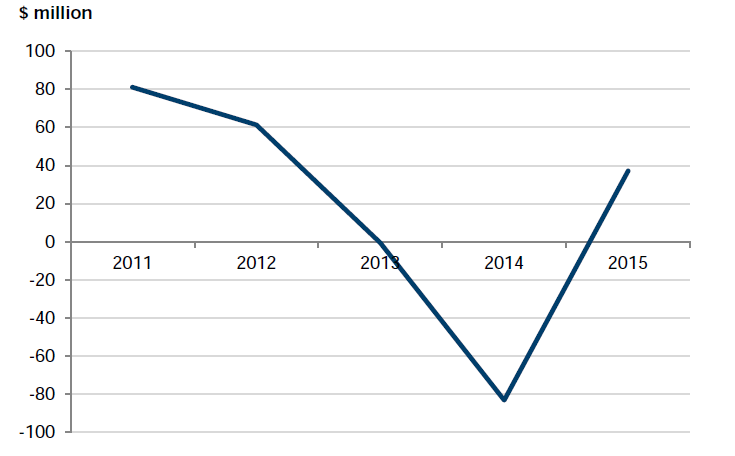
Note: Federation Training is excluded from this analysis.
Source: Victorian Auditor-General's Office.
Figure 2B illustrates the revenue and expenditure trends for the TAFE sector over the past five years.
Figure 2B
Revenue and expenditure of TAFE sector, 2011–15
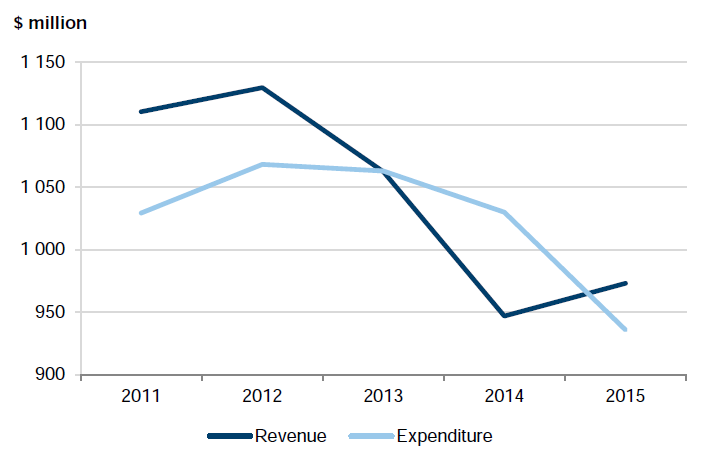
Note: Federation Training is excluded from this analysis.
Source: Victorian Auditor-General's Office.
Expenditure has declined every year since 2012, including in 2015. The positive net result in 2015 happened because expenditure decreased by 9.1 per cent in the year, while revenue increased by 2.7 per cent. The year-on-year fall in expenditure appears large, but, in 2014, $36.8 million was written off the value of the Student Management systems operated by five TAFEs, inflating expenditure in that year. In 2015, the sector saved $27.6 million in payroll costs largely as a result of staff redundancies in prior financial years.
From 1 January 2013, subsidies for TAFE courses were awarded by the state government through contestable funding. This means that TAFEs compete for students in the market place and receive the same government funding per student as private providers. At the same time, ongoing state government funding to support TAFEs ended. As a result, the overall government funding received by TAFEs reduced and TAFEs' total revenue also fell.
In our May 2015 report Technical and Further Education Institutes: 2014 Audit Snapshot, we highlighted that TAFEs sought to restructure their businesses in 2013 and 2014 to respond to the funding changes.
State government funding for the Victorian TAFE sector has undergone a number of changes over the last five years. Given this funding represents about half of TAFE revenue, any changes or modifications to funding programs or conditions have a profound effect on a TAFE. Figure 2C shows the composition of revenue of the TAFE sector over the last five financial years and it demonstrates this structural change the TAFE sector has been dealing with.
The reduction in revenue and subsequent review of the TAFEs' business models has had an impact of reducing employee expenditure from $623.3 million in 2014 to $595.6 million in 2015, a drop of 4.4 per cent–driving the overall reduction in expenditure noted in figure 2B.
Figure 2C
Composition of TAFEs' revenue, 2011–15
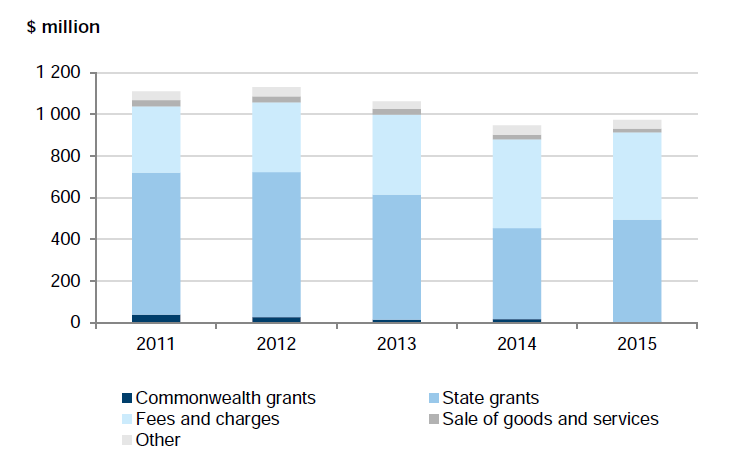
Note: Federation Training is excluded from the above analysis.
Source: Victorian Auditor-General's Office.
State government funding in 2015
From November 2014, the state government announced a range of new funding initiatives that provide additional funds to TAFEs, including:
- TAFE Rescue Fund—$320 million to be distributed over five years to:
- re-open closed TAFE campuses
- upgrade TAFE buildings, workshops and labs
- provide cash support to TAFEs
- TAFE Back to Work Fund—to provide one-off grants to TAFEs to help them to deliver training that leads to job creation
- TAFE Funding Boost, which is used to increase training levels.
A TAFE Structural Adjustment Fund has been set up to help TAFEs in their business transformation.
As a result of these initiatives, TAFEs received $159.3 million in state government funding in 2015—$132.0 million for operating activities and $27.3 million for capital works. Figures 2D shows how this funding was awarded in 2015.
Figure 2D
TAFE grant funding, 2015
|
Institute |
TAFE Rescue Fund ($m) |
TAFE Back to Work Fund ($m) |
TAFE Funding Boost ($m) |
TAFE Structural Adjustment Fund ($m) |
Total ($m) |
|---|---|---|---|---|---|
|
Operating Grants |
|||||
|
Bendigo Kangan Institute |
2.2 |
5.8 |
2.0 |
9.4 |
19.4 |
|
Box Hill Institute |
1.8 |
4.7 |
6.9 |
1.5 |
14.9 |
|
Chisholm Institute |
– |
2.9 |
1.6 |
– |
4.5 |
|
Gordon Institute |
– |
6.0 |
6.2 |
0.5 |
12.7 |
|
Goulburn Ovens Institute |
1.3 |
4.3 |
8.5 |
– |
14.1 |
|
Holmesglen Institute |
– |
5.6 |
1.3 |
– |
6.9 |
|
Melbourne Polytechnic |
4.0 |
2.5 |
15.4 |
3.5 |
25.4 |
|
South West Institute |
4.0 |
1.6 |
1.0 |
0.8 |
7.4 |
|
Sunraysia Institute |
4.0 |
1.8 |
1.0 |
3.3 |
10.1 |
|
William Angliss Institute |
2.0 |
4.5 |
1.9 |
2.0 |
10.4 |
|
Wodonga Institute |
– |
2.5 |
3.7 |
– |
6.2 |
|
Capital Grants |
|||||
|
Bendigo Kangan Institute |
– |
– |
– |
5.9 |
5.9 |
|
Box Hill Institute |
10.0 |
– |
– |
0.7 |
10.7 |
|
Gordon Institute |
– |
– |
– |
2.1 |
2.1 |
|
Goulburn Ovens Institute |
– |
– |
– |
0.3 |
0.3 |
|
Holmesglen Institute |
1.0 |
– |
– |
– |
1.0 |
|
South West Institute |
– |
– |
– |
1.9 |
1.9 |
|
Sunraysia Institute |
– |
– |
– |
5.4 |
5.4 |
|
Total payments made to TAFEs |
30.3 |
42.2 |
49.5 |
37.3 |
159.3 |
Note: Excludes Federation Training, which received $5.1 million in total in capital and operational grants.
Source: Victorian Auditor-General's Office from data provided by the Higher Education and Skills Group, Department of Education & Training.
These additional funds have partly offset a reduction in other funding in 2015. In, particular, revenue from student fees was less in 2015 than in 2014 because of a fall in student numbers. This also led to a decline in state government funding—Government Funded Training Revenue.
2.3.1 State government review of the sector
In February 2015, the state government commissioned an independent review of the TAFE sector to recommend changes to the funding model.
In December 2015, the VET Funding Review: Final Report was published. The report contained 109 recommendations on how to 'restore quality, value and stability' to the TAFE sector. The report does not recommend a move away from contestable funding, but does look at helping TAFEs to become more fully sustainable institutions.
The state government responded positively to the report in both its published response (December 2015) and the 2016–17 State Budget.
2.4 Risks to financial sustainability
To be financially sustainable, TAFEs should aim to generate sufficient revenue from operations to meet their financial obligations, and to fund asset replacement and renewal.
Financial sustainability should be viewed from both a short- and long-term perspective. Short-term indicators relate to the ability of an entity to maintain positive operating cash flows, or the ability to generate an operating surplus over the short term. Long‑term indicators focus on an entity's ability to fund asset renewal and replacement.
We have used four financial sustainability risk indicators, assessed over the past five years, to assess the financial sustainability risks in the TAFE sector. Appendix C describes the financial sustainability indicators risk assessment criteria and benchmarks used.
The four indicators used have changed from prior years to promote consistency in our analysis between entities within the Victorian public sector, such as public hospitals, water entities and local governments. Appendix C provides information on the changes that have occurred since our 2014 analysis. Our comments below are based on these new indicators, for all five financial years.
Appendix C also provides the indicator results calculated for each TAFE for the years 2011 to 2015.
2.4.1 Overall result
Figure 2E summarises the financial sustainability risk ratings for the TAFE sector as a whole as at 31 December 2015. These results are based on the consolidated financial statements of each TAFE, with the exception of Federation Training.
Figure 2E
Financial sustainability risk indicators for the TAFE sector, 2011–15
|
Indicator |
Average across sector entities |
||||
|---|---|---|---|---|---|
|
2011 |
2012 |
2013 |
2014 |
2015 |
|
|
Net result |
4.51% |
5.55% |
-1.17% |
-13.63% |
4.02% |
|
Liquidity |
1.81 |
1.95 |
1.92 |
2.25 |
2.92 |
|
Capital replacement |
1.86 |
1.41 |
1.24 |
0.75 |
0.55 |
|
Internal financing |
192% |
153% |
152% |
76% |
3 210% |
Note: A red result shows a high-risk assessment, an orange result is a medium-risk assessment, and a green result is a low-risk assessment.
Note: Federation Training is excluded from the analysis.
Source: Victorian Auditor-General's Office.
Overall, the financial sustainability risk assessment shows that the sector's financial outcomes have improved in 2015, with low risk ratings for the short-term indicators. Emerging risks remain in the long term. The year-on-year sector decline in the capital replacement ratio is a concern and could mean that assets are not being replaced or renewed enough to keep them fit for purpose. This needs to be monitored to ensure that teaching facilities and other assets are suited to providing the services that TAFEs offer.
Short-term indicators
The short-term indicators—net result and liquidity—focus on a TAFE's ability to maintain positive operating cash flows and to generate a surplus over the short term. They also assess the TAFE's ability to pay its commitments as they fall due over the next 12 months.
These two ratios improved in 2015, influenced by the additional state government funds received in December 2015. Under the Australian Accounting Standards, particularly AASB 1004 Contributions, TAFEs are required to recognise this money as revenue when they receive it, even though the funds will not be spent until future years.
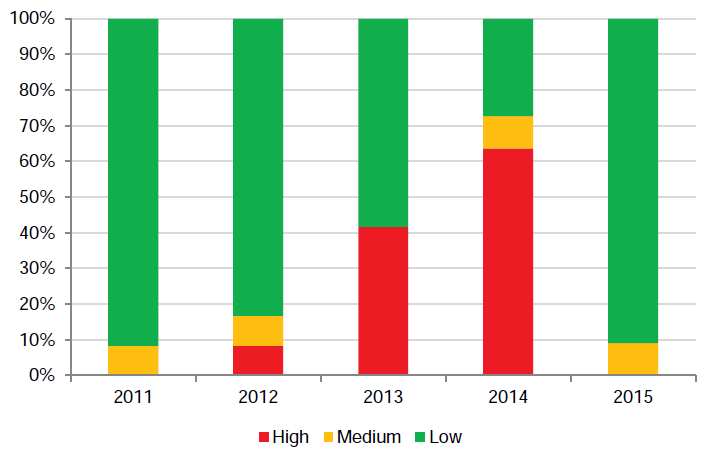
This, when combined with the reduction in expenditure made by TAFEs during 2015, has led to a positive net result indicator, as shown in Figure 2F.
Figure 2F
TAFE sector's net result risk indicators, 2011–15
Note: Federation Training is excluded from the above analysis.
Source: Victorian Auditor-General's Office.
The receipt of significant funding at the end of the year also boosted the TAFEs short‑term cash holdings at 31 December 2015. This had a positive impact on their liquidity ratio, as shown in Figure 2G.
Figure 2G
TAFE sector's liquidity risk indicators, 2011–15
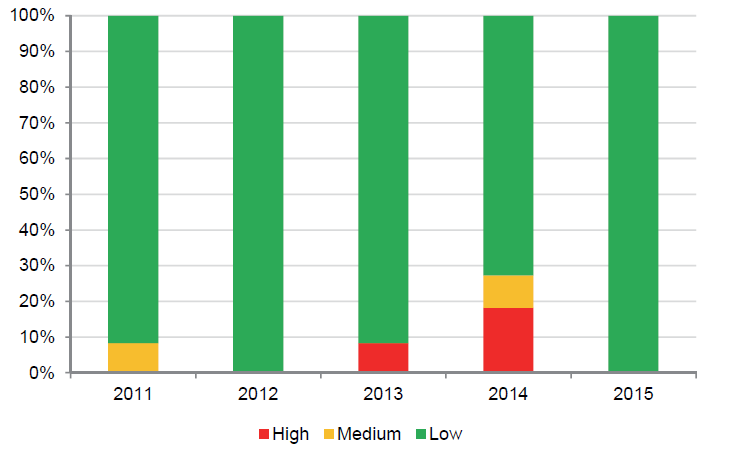
Note: Federation Training is excluded from the above analysis.
Source: Victorian Auditor-General's Office.
The challenge for TAFEs will be to ensure that their expenditure remains sustainable, so that these positive results can begin to impact their plans for longer-term asset renewal.
Long-term indicators
The capital replacement and internal financing indicators look at an entity's ability to fund asset replacement and renewal from surpluses. In 2014, when the sector experienced a net deficit of $83.1 million, we noted that TAFEs were not spending on asset renewal or replacement, nor did they have the means to do so.
In 2015, due to the sector's net surplus of $37.2 million, the internal financing indicator shows that TAFEs may be in an improved position to fund capital expenditure. This is shown in Figure 2H. However, it should be noted that the large positive result for this indicator is affected by the state government funding received in December 2015 and not yet spent by TAFEs. Therefore, this positive outlook might not be sustainable in future years.
Figure 2H
TAFE sector's internal financing risk indicators, 2011–15
Note: Federation Training is excluded from the above analysis.
Source: Victorian Auditor-General's Office.
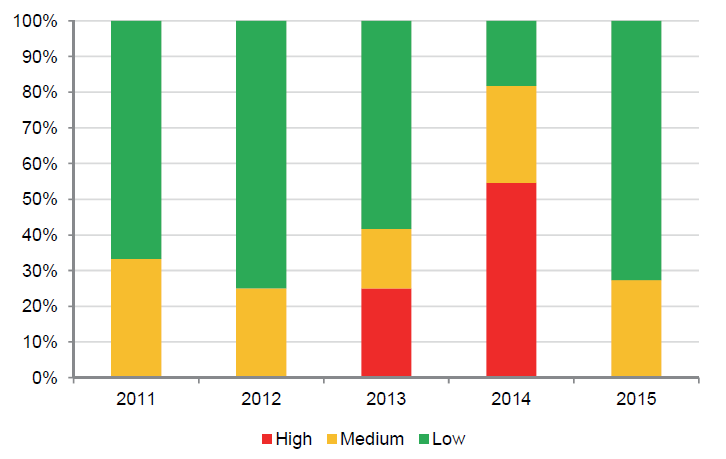
This is emphasised by the capital replacement indicator, as shown in Figure 2I, which highlights that spending in 2015 on replacing and renewing assets at most TAFEs did not match the consumption of assets as measured by depreciation.
Figure 2I
TAFE sector spending on property, plant and equipment against depreciation expense incurred, 2011–15
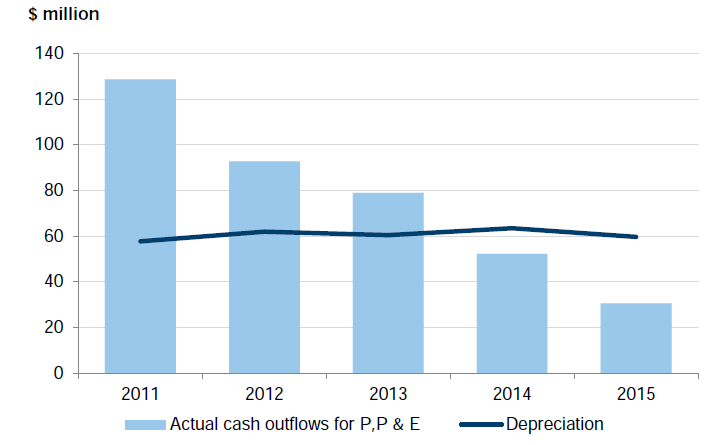
Note: Federation Training is excluded from the analysis.
Source: Victorian Auditor-General's Office.
The effect of underspending on new assets and asset renewal could mean that, over time, TAFE assets will no longer be fit for purpose. As shown in Figure 2J, this is starting to emerge as a long-term risk, which TAFEs should be monitoring.
Figure 2J
TAFE sector's capital replacement risk indicators, 2011–15
Note: Federation Training is excluded from the analysis.
Source: Victorian Auditor-General's Office.
2.5 A financially sustainable TAFE—Chisholm Institute
In our report Technical and Further Education Institutes: 2014 Audit Snapshot, we provided comment on two TAFEs that we considered to have high financial sustainability risks at 31 December 2014. Both TAFEs had received an emphasis of matter paragraph in their financial audit opinion relating to uncertainty over going concern.
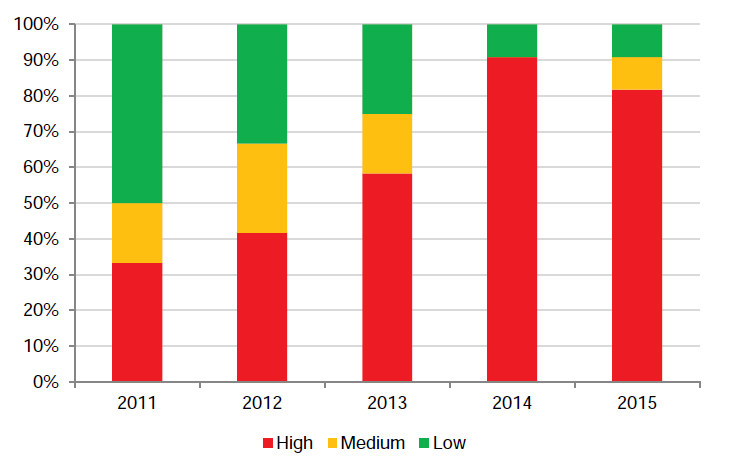
In contrast, Chisholm Institute was assessed as having largely low financial sustainability risks in 2015 and in 2014. This is in contrast to the declining financial sustainability assessment for most other TAFEs over the same period. Figure 2K details Chisholm Institute's financial sustainability results for the past five years.
Figure 2K
Chisholm Institute's financial sustainability risk indicator results, 2011–15
|
Indicator |
2011 |
2012 |
2013 |
2014 |
2015 |
|---|---|---|---|---|---|
|
Net result |
4.70% |
2.66% |
22.65% |
20.67% |
4.84% |
|
Liquidity |
1.34 |
1.48 |
2.40 |
3.02 |
4.12 |
|
Capital replacement |
2.03 |
1.02 |
2.73 |
3.83 |
0.58 |
|
Internal financing |
183% |
78% |
160% |
116% |
391% |
Note: A red result shows a high-risk assessment, an orange result is a medium-risk assessment, and a green result is a low-risk assessment.
Source: Victorian Auditor-General's Office.
Lessons can be learnt from the actions taken by Chisholm Institute to respond to the sectors funding changes. We have identified key actions that the board and management took immediately after the announced funding changes in 2012, which meant that the TAFE remained on a positive financial footing after business transformations in 2013.
In 2012, Chisholm Institute prepared a Business Transition Plan (BTP) that was designed to put in place a framework to guide the operational change program. Significant parts of the strategy included:
- reaffirming the strategic vision included in the Chisholm 2020 document
- understanding market knowledge and market share, including forecast training delivery
- reviewing the organisational structure
- developing a people strategy, focusing on the kind of people Chisholm Institute needed as employees and how they would keep their employees engaged throughout the change process
- asset strategy, including a commitment to keep all campuses open and keep investing in new assets
- marketing and communications
- financial and resource management plans.
A large part of the BTP dealt with changes that would be made to Chisholm Institute's courses. This involved analysing the different cohorts that Chisholm Institute catered for, and concentrating its strategy on target markets and critical industries.
An updated mix of courses—called the training delivery profile—was developed with a focus on revenue. This revenue strategy was geared to respond to the change in state government funding at an individual course level. Also, the plan identified the need to diversify revenue, including getting more revenue to be made from student fees.
Chisholm Institute saw 2013 as a transition year. When the training delivery profile was set, a target revenue amount was forecast, based on the number of students expected to enrol. Since the new state government funding model was based on student enrolments and contact hours, student numbers were now the key to revenue generation.
This focus on student numbers, course mix and student fees meant that revenue from these sources has increased year on year, most notably by 25 per cent between 2012 and 2013.
In 2012, Chisholm Institute carried out targeted redundancies, which contributed to its lower net result indicator at 31 December 2012, as detailed in Figure 2K. Chisholm Institute determined that it had sufficient cash reserves to carry out a redundancy program that would deliver significant ongoing expenditure savings. As a result, Chisholm Institute reduced staff numbers by 190 in 2012 and spent about $8.3 million in redundancy payments in 2012. The consequential reduction in employee expenses led to an annual saving of more than $15 million in subsequent years.
Culture change
Chisholm Institute recognised that a key part of the change management program was to ensure that staff at the entity were informed about, and supported through, the changes. The BTP clearly identified staff as key stakeholders and prepared a communication plan to be used throughout the transformation process.
Chisholm Institute also identified that an investment in staff was required to move the culture to one of 'performance, efficiency and innovation'. Alongside the targeted redundancies, training for ongoing staff is a priority, which the board committed to funding.
Recommendations
- That technical and further education institutes continue reviewing their business model to respond to recent funding changes to ensure that long-term financial sustainability issues are addressed.
- That technical and further education institutes address longer-term financial sustainability issues by planning for and monitoring asset replacement and renewal.
3 Performance reporting
At a glance
Background
For 31 December 2015, technical and further education (TAFE) institutes were required to report on the key performance indicators detailed in their annual Statement of Corporate Intent, as agreed with the minister at the start of the year.
Also, four mandatory indicators were introduced ahead of the full rollout of an updated TAFE performance reporting framework being created by the Department of Education & Training (DET). The full program will come into effect for 31 December 2016 reporting.
Conclusion
All TAFEs and DET took steps to improve TAFE performance reporting in 2015. The introduction of a performance reporting framework in 2016 is expected to lead to further improvements.
Findings
- TAFEs have implemented most of the recommendations we made in 2014 and improved the description and methodology underpinning the performance indicators, as well as the variance explanations in performance statements.
- In 2015, DET introduced four mandatory indicators. These indicators bring about comparability across the TAFEs. However, the absence of benchmarks makes the results difficult to interpret.
- DET is on track to meet the commitment made to develop a performance reporting framework and tool for the higher education sector. The framework and tool has been introduced in 2016.
Recommendations
We made no recommendation in this Part, as TAFEs and DET are working to address recommendations made in previous reports.
3.1 Introduction
The Education and Training Reform Act 2006, requires technical and further education (TAFE) institutes to develop an annual Statement of Corporate Intent. The statement must outline the TAFE's strategic objectives, directions, operational priorities, and the associated key performance indicators (KPIs) and targets that will benchmark its results for a financial year. This statement is agreed with the responsible Minister for Education before the start of each financial year.
In our report Technical and Further Education Institutes: Results of the 2013 Audits (August 2014), we noted that performance reporting in the TAFE sector was poor and needed to be improved. In response to that report, the Department of Education & Training (DET) committed to prepare a performance reporting framework to be introduced in 2016. Throughout 2015, DET worked on developing this framework and building tools to support the framework.
In this Part, we detail the outcomes of the 2015 audit of the performance statements for 11 TAFEs and comment on the changes in performance reporting introduced in 2015 ahead of the framework implementation in 2016. We have excluded Federation Training from this Part, because a performance statement for 2015 has not been finalised.
3.2 Conclusion
All TAFEs have taken steps to improve performance reporting in 2015, and further improvements are expected with the introduction of a performance reporting framework in 2016.
3.3 Audited performance statements for 2015
Eleven TAFEs completed performance reports for 31 December 2015 and all received clear audit opinions.
In their performance report, TAFEs were required to report actual results and to acquit their achievements against targets for the key performance indicators agreed with the Minister for Education.
TAFEs continues to report on a wide variety of KPIs. Most commonly, KPIs focus on revenue targets, revenue initiatives, financial results and student and staff satisfaction.
We noted in Technical and Further Education Institutes: 2014 Audit Snapshot that:
- performance indicators needed to be linked to strategic objectives
- calculations used by TAFEs for common indicators varied and, therefore, comparability could not be achieved
- variance explanations for actual results against the target needed to be improved.
As a result, we made three recommendations to the sector, as shown in Figure 3A. We observed an overall improvement in the quality of performance statements for 2015, as TAFEs largely acted on the recommendations made last year.
Figure 3A
Acquittal of recommendations regarding the
TAFE performance reporting framework
Recommendation |
Action to address |
|---|---|
As per our report Technical and Further Education Institutes: 2014 Audit Snapshot |
|
That TAFEs link key performance indicators to all strategic objectives to ensure there are performance measures and outcomes for all strategic activities. |
✖ |
That TAFEs improve the variance explanations on performance statements to provide a better understanding of the reasons why performance targets have not been achieved. |
✔ |
That TAFEs include details of how the actual results for their key performance indicators have been calculated to provide a better understanding of performance for the user of the performance statement. |
✔ |
Source: Victorian Auditor-General's Office.
It was particularly pleasing to see a description of the indicator and the methodology for calculation in all performance statements, and a general improvement in variance explanations. Room remains for some TAFEs to provide more fulsome explanations about variances.
The link between strategic objectives and KPIs and the outputs or outcomes achieved is missing from performance statements, so an opportunity remains to further improve them.
Mandatory indicators introduced
For 2015, TAFEs were also required to report on four mandatory indicators determined by DET, as shown in Figure 3B. DET mandated how each of the four indicators is to be calculated. This brings consistency to the calculation and means that results can be compared across the sector.
Figure 3B
Mandatory performance indicators for TAFEs, as at 31 December 2015
Indicator |
Definition |
|---|---|
Employment costs as a proportion of training revenue (%) |
Employment and third party training costs / training revenue |
Training revenue per teaching FTE ($) |
Training revenue / total teaching FTE |
Operating margin percentage (%) |
Earnings before income tax (excluding capital contributions) / total revenue (excluding capital contributions) |
Revenue diversity (%) |
Breakdown of revenue sources by government funding and fee for service |
Source: Victorian Auditor-General's Office based on Department of Education & Training (October 2015), TAFE Performance and Accountability Framework.
Figure 3C details the results of these four indicators for each audited TAFE at 31 December 2015 and shows that there is a wide variance in results across the 11 TAFEs.
With no benchmarks against which to set the results in Figure 3C, it is difficult to see which TAFEs are performing strongly across all indicators and which are not. The TAFEs provided no commentary on the four indicators in their performance statement and, therefore, it is difficult to interpret these results.
For example, the outcomes for the 'employment costs as a proportion of training revenue' indicator ranged from 65 per cent to 110 per cent. A result of more than 100 per cent suggests that it costs more to employ staff than a TAFE is earning from the services provided by those staff. Conversely, too low a rating could indicate a problem with the amount of quality teaching time provided. Without context in which to assess the result, it is difficult for readers to understand the outcome or to be in a position to make judgements on performance.
We note that these are new indicators and, over the next few years, TAFEs will be able to build up a set of comparable data—both over time and across institutions—to enable these assessments to be made. In the interim, TAFEs should provide additional background information to help users to understand the institute's performance.
Figure 3C
Results for mandatory indicators reported in TAFE performance reports for 31
December 2015
Institute |
Employment costs as proportion of training revenue (%) |
Training revenue per teaching FTE ($) |
Operating margin (%) |
Revenue diversity(a) (%) |
|---|---|---|---|---|
Bendigo Kangan Institute |
82.2% |
$241 853 |
-1.5% |
VTG: 49.5% FFS: 37.2% |
Box Hill Institute |
89.0% |
$217 400 |
-2.0% |
VTG: 36.0% FFS: 64.0% |
Chisholm Institute |
66.0% |
$177 633 |
5.5% |
VTG: 51.3% FFS: 31.1% |
Gordon Institute |
110.0% |
$134 517 |
-6.9% |
VTG: 70.2% FFS: 14.8% |
Goulburn Ovens Institute |
109.7% |
$126 679 |
-3.6% |
VTG: 58.0% FFS: 42.0% |
Holmesglen Institute |
83.0% |
$257 452 |
0.9% |
VTG: 28.5% FFS: 71.5% |
Melbourne Polytechnic |
85.8% |
$246 429 |
-2.5% |
VTG: 28.3% FFS: 71.7% |
Southwest Institute |
109.6% |
$147 373 |
-6.7% |
VTG: 62.3% FFS: 37.7% |
Sunraysia Institute |
109.0% |
$156 231 |
2.7% |
VTG: 77.0% FFS: 23.0% |
William Angliss Institute |
76.7% |
$222 540 |
5.1% |
VTG: 25.0% FFS: 75.0% |
Wodonga Institute |
82.1% |
$150 075 |
3.82% |
VTG: 54.0% FFS: 46.0% |
(a) VTG = Victorian Training Grant; FFS = Fee For Service funding.
Source: Victorian Auditor-General's Office.
3.4 Performance reporting framework development
The introduction of the new mandatory indicators in 2015 is the first stage in DET's response to our recommendations in previous reports regarding the TAFE performance reporting framework. These recommendations and an indication of progress are outlined in Figure 3D.
Figure 3D
Acquittal of recommendations regarding the
TAFE performance reporting framework
Recommendation |
Action to address |
|---|---|
As per our report Technical and Further Education Institutes: Results of the 2013 Audits |
|
That the Department of Education & Early Childhood Development(a) works with TAFEs to develop a robust framework that specifies reporting requirements, mandates a core suite of relevant and appropriate key performance indicators, and guides entities in establishing suitable targets and effectively analysing performance. |
✔ |
That the Department of Education & Early Childhood Development(a) acts to mitigate the risk of misstatement of performance by TAFEs by ensuring adequate scrutiny of information reported. |
✔ |
(a) On 1 January 2015, the Department of Education & Early Childhood Development was renamed the Department of Education & Training.
Source: Victorian Auditor-General's Office.
DET has been working with the sector to develop a framework, including a suite of indicators that provide useful information for both reporting and to manage and benchmark the TAFE business.
The proposed framework consists of 29 indicators, with work ongoing to develop further indicators to be rolled out in future periods. The indicators have been prepared under broad categories of sustainability, outcomes, training delivery, operational effectiveness and compliance. Of the 29 indicators:
- twelve will form a dashboard overview for each TAFE
- sixteen will be updated every three months, with the remainder updated every year
- four are proposed to be reported in the performance statement of each TAFE's audited and published performance report.
Of the four indicators to be included in the performance report, three measure sustainability and one measures operating effectiveness. A fifth indicator for external reporting is being developed to measure outcomes.
A tool is being prepared and introduced to provide TAFEs access to these performance indicators and results, and which will allow TAFEs to run their results against set benchmarks. DET has introduced this new framework for 2016. We will provide a full summary of the framework and its introduction in our planned report Technical and Further Education Institutes: 2016 Audit Snapshot, which we expect to publish in May 2017.
4 Fraud risks and controls
At a glance
Background
An effective fraud control framework plays a significant role in reducing the risk of fraud and should be a central component of a technical and further education (TAFE) institute's risk management activities.
Conclusion
TAFE fraud control frameworks are too narrow in scope and do not consider all types of fraud that a TAFE might face. This means that TAFEs are exposed to potential fraud risks that they might not be mitigating.
Findings
- TAFEs are not considering the bigger picture when it comes to fraud control.
- TAFEs are generally limiting prevention and control activities to theft.
- TAFEs do not currently provide employees with sufficient training, nor target training to those dealing with areas within the TAFE at a higher risk of coming across potential fraud.
Recommendations
That technical and further education institutes:
- review fraud control policies and expand the definition and consideration of fraud beyond theft to include deliberate falsification, concealment, destruction or use of falsified documentation, and the improper use of information or position for personal financial benefit
- provide regular training to staff on fraud policies and procedures, and provide tailored training to staff in high-risk roles
- havein place systems and processes that ensure that all losses are captured and assessed for reporting under the Financial Management Act 1994.
4.1 Introduction
When fraud occurs, public money is lost.
Considering where fraud might take place in a public sector entity, and designing and implementing frameworks to mitigate identified areas of risk should be key components of a TAFE's risk management activities.
The risk of fraud is inherent to all public and private entities. The Independent Broad Based Anti-Corruption Commission (IBAC) has published a checklist which helps public entities to identify whether their fraud risk management is better practice. This checklist, a useful tool for all public entities, is included in Appendix D. Figure 4A summarises the key aspects of better practice that should be included in a fraud control framework, as detailed in the IBAC checklist.
Figure 4A
Key elements of an effective fraud control framework
Managing the risk of fraud |
Practice and culture |
|---|---|
|
|
|
|
|
|
|
|
|
|
|
|
|
Source: Victorian Auditor-General's Office based on Independent Broad-based Anti-corruption Commission (2013), Controlling fraud and corruption: a prevention checklist.
We assessed the fraud risk management framework at 11 TAFEs using the IBAC checklist, findings in our report Fraud Prevention Strategies in Local Government (tabled June 2012), and the Australian Standard 8001:2008 Fraud and Corruption Control (AS 8001). We also surveyed staff at two TAFEs to understand the practical application of these frameworks and gauge how aware staff are of fraud risks.
As detailed in Part 1 of this report, our analysis does not include Federation Training.
4.2 Conclusion
TAFE fraud control frameworks are too narrow in scope and do not consider all types of fraud that a TAFE may face. Consequently, TAFEs may not adequately mitigate the genuine fraud risks they face. These fraud control frameworks need to improve to reduce the risk that public sector money will be lost.
4.3 Managing the risk of fraud
Most TAFEs have a fraud control framework in place. In the main, the policies and procedures underpinning the fraud control frameworks were up to date, with evidence that policies and procedures had been recently reviewed by management.
However, key deficiencies in the policies and procedures in place at TAFEs might mean that fraud risks are not being effectively mitigated. Specifically:
- the definition of fraud adopted is too narrow
- fraud risk is not incorporated within key strategic and corporate planning documents
- fraudprevention activities that IBAC recommends are not being undertaken.
IBAC and the Victorian Government use the definition of fraud detailed in AS 8001:
'Dishonest activity causing actual or potential financial loss to any person or entity including theft of moneys or other property by employees or persons external to the entity and where deception is used at the time, immediately before or immediately following the activity. This also includes the deliberate falsification, concealment, destruction or use of falsified documentation used or intended for use for a normal business purpose or the improper use of information or position for personal financial benefit.'
From this definition, there are three clear activities that are considered to be fraud:
- theft of money or property
- deliberate falsification, concealment, destruction or use of falsified documentation
- improperuse of information or position for personal financial benefit.
Across the 11 TAFEs, the fraud control frameworks and risk registers were set up to focus on the potential of fraud through theft of money or property, but have failed to consider the wider definition of fraud. This narrow approach means that the frameworks do not consider and, therefore, might not mitigate the other elements of fraud.
The risks for the public sector from improperly using information or position for personal financial benefit are real, with IBAC recently investigating, and holding public hearings into, alleged frauds of this nature. Specifically, the IBAC Operation Ord investigation uncovered what the Secretary of the Department of Education & Training (DET) described as 'departmental officials who abused their position for personal gain'.
The financial losses of public money from these types of fraud can be significant. An example of a recent fraud of this nature in the public sector is illustrated in Figure 4B.
Figure 4B
Example of fraudulent activity—Queensland Health
|
Background In December 2011, Queensland Health identified a fraud perpetuated by one of its employees. Investigations found that the fraud had been committed over four years, starting in October 2007, and consisted of 65 fraudulent transactions totalling $16.69 million. Fraudulent activity The individual committed the theft of money by:
Cultural weaknesses The fraud made use of weaknesses in Queensland Health's culture, which meant that it could go undetected for four years. Staff did not fully comply with policy and procedures. Finance staff did not carry out the required checks on documents such as invoices for new vendors or review supporting documents, partly because they knew the person who provided them with the documents. Falsified documents were used in the fraud. There were failures of financial management and accountability, with a lack of oversight and challenging of poor behaviour and poor segregation of roles with key oversight functions. Staff did not understand the value of the checks they were expected to carry out on key documents. |
Source: Victorian Auditor-General's Office based on Crime and Misconduct Commission Queensland (2013), Fraud, financial management and accountability in the Queensland public sector: An examination of how a $16.69 million fraud was committed on Queensland Health.
We found that TAFEs are not learning the lessons from IBAC's communications and, in particular, are not building key recommended mitigation activities into their control frameworks. Examples of TAFE policies not following key IBAC-recommended mitigation activities include:
- no verification activities when vendor details change
- managementperformance measures not including organisational ethical, compliance and fraud prevention goals.
TAFEs are missing the opportunity to apply these learnings and to proactively seek to introduce measures and controls that could effectively mitigate the risk of fraud occurring. DET is now introducing these measures in response to IBAC's Operation Ord. The Secretary has stated that one of DET's many actions will be to embed integrity goals and measures into executive performance plans. In April 2016, IBAC reported on these matters to Parliament.
Link to wider governance framework
The principles and actions detailed in a fraud control framework need to be considered by TAFE Boards and management as they carry out their corporate and strategic planning processes. A TAFE fraud control framework should not operate as a standalone policy. This is not happening at TAFEs and fraud risk and controls are not visibly managed and integrated into the business.
This is particularly important in relation to the TAFE's risk management framework. All but one of the TAFEs identified the risk of the loss of money or property in their risk registers; but there is no recognition of the risk of fraud through other means. Again, this indicates that in not identifying potential risks regarding falsified documents and improper use of information, TAFEs are not proactively seeking to mitigate them.
4.4 Practice and culture
To be effective, fraud awareness and a TAFE's designated fraud control framework need to be communicated to, and embedded throughout, the organisation. This means that staff should be effectively trained to understand the fraud control framework, and that this training should be refreshed and reinforced periodically so that staff awareness and knowledge stays high.
Our review highlighted that only six of the 11 TAFEs include fraud identification and management in their induction training for new staff. Also, only these same six TAFEs provide ongoing training for all staff, suppliers, volunteers and contractors to foster awareness of the significance of fraud risks, and their potential impact on the organisation.
No TAFE is designing and providing specific training for employees, such as procurement officers and executives, who are more likely to encounter a fraud. People in these roles should receive tailored training so that they are alert to the specific fraud risks that arise in their work.
Just having a fraud control framework is not enough to make it effective if staff do not understand the expectations and requirements of them and their obligations and the importance of their role. Lack of training could limit the effectiveness of any framework.
TAFEs often use third-party providers to deliver services such as teaching courses and finance roles. These are roles where the provider could be considered to be acting on behalf of the TAFE. However, seven TAFEs have no policy in place to ensure that these providers know the TAFE's policies and expectations regarding fraud mitigation and prevention.
As these providers are acting on behalf of the TAFE, it is important that they are subject to the same policies and training as TAFE staff. By doing so, TAFEs will also reduce the risk of fraud by third parties, and increase the likelihood of potential frauds being identified and reported.
Culture
As part of our review, we surveyed staff at two TAFEs—Gordon Institute of TAFE and Sunraysia Institute of Technical and Further Education. The survey was designed to gauge the level of staff awareness of the fraud control framework elements in place at their particular TAFE.
The responses we received showed that the understanding of the fraud control framework varied significantly within a TAFE. In general, management and executives are more aware of fraud risk and control activities within a TAFE than operational-level employees.
Overall, we found that staff perceive fraud narrowly, consistent with the policies of TAFEs. They are aware that fraud consists of theft of money and property, but not that it could include falsifying documents or misusing information. Most staff were aware of their reporting obligations for fraud, and indicated that they would feel comfortable reporting a fraud.
Many of the operational staff were not aware of the gifts and benefits policy within the TAFE and did not know if there was a threshold for receiving gifts. However, all staff were aware that they should not receive gifts and stated that they would decline gifts if offered. Most employees were not aware of the broader risks of conflicts of interest, particularly in procurement. This reinforces our finding on the fraud control frameworks and the training provided by TAFEs.
Responses to a question about whether the staff member had received recent training on fraud were mixed. TAFEs should ensure that all staff receive regular training updates on their fraud control framework, tailored, as appropriate, to those in roles where the risk of encountering a potential fraud is high.
4.5 Obligation to report fraud and losses
A requirement of entities reporting under the Financial Management Act 1994 (FMA entities) is that they comply with the Standing Directions of the Minister for Finance (Standing Directions). Standing Direction 4.5.4 Thefts and Losses (SD 4.5.4) requires these entities to report every year all cases of suspected or actual theft, arson, irregularity or fraud in connection with the receipt or disposal of money, stores or other property of any kind under the control of a public sector agency to the Minister for Finance and the Auditor-General. SD 4.5.4 provides direction on shorter reporting periods if the loss is above set threshold values.
All FMA entities are expected to keep a register to enable them to make this declaration at 30 June for the preceding 12-month period.
Reporting losses for 30 June 2015
Figure 4C shows the number of suspected or actual frauds and losses and the total value of the incidents reported by the 11 TAFEs for the financial year ended 30 June 2015.
Figure 4C
Summary of reporting by TAFEs of suspected and actual losses and thefts
under Standing Direction 4.5.4 at 30 June 2015
TAFE |
Number of frauds and losses reported |
Total $ value |
|---|---|---|
Bendigo Kangan Institute |
No report |
No report |
Box Hill Institute |
23 |
7 332 |
Chisholm Institute |
115 |
166 232 |
Gordon Institute |
No report |
No report |
Goulburn Ovens Institute |
No report |
No report |
Holmesglen Institute |
5 |
7 290 |
Melbourne Polytechnic |
32 |
362 426 |
South West Institute |
1 |
1 824 134 |
Sunraysia Institute |
No report |
No report |
William Angliss Institute |
No report |
No report |
Wodonga Institute |
1 |
6 450 |
Total |
177 |
2 373 864 |
Note: 'No report' means that a letter was not submitted under SD 4.5.4. Under SD 4.5.4, if an entity has not identified any suspected or actual losses, they are not required to submit a letter.
Source: Victorian Auditor-General's Office.
The level of reporting of the six TAFEs that did submit a letter under SD 4.5.4 varied considerably. For example, Chisholm Institute reported 115 items with a value of $166 232, of which 78 items related to damage by graffiti.
Revised Standing Directions of the Minister for Finance were issued in February 2016. All FMA entities will need to comply with the new requirements from 1 July 2016.
The revised Standing Directions update the reporting requirements, with an entity to inform the responsible Minister, Audit Committee, Portfolio Department and Auditor-General of any instances of actual or suspected significant or systemic fraud, corruption or other loss as soon as practicable. This requirement replaces the current annual reporting under SD 4.5.4. These standing directions also state that an entity must:
'keep records of all actual and suspected fraud, corruption and other losses, including remedial actions planned and taken; and on request, provide their Responsible Minister, Portfolio Department or Audit Committee with a copy of [the] records kept.'
TAFEs will need to ensure that they have the systems and processes in place to comply with the revised requirements. This includes having adequate systems in place to identify and capture all of a TAFE's losses.
As part of embedding this process within their organisations, TAFEs will also need to develop appropriate staff training to enable employees and management to be aware of the types of incidents that need to be reported. This will be most effective when supported by a culture that encourages ethical behaviour and encourages staff to report potentially fraudulent conduct.
Recommendations
That technical and further education institutes:
- integrate fraud control frameworks with strategic and corporate activities
- review fraud control policies and expand the definition and consideration of fraud beyond theft to include deliberate falsification, concealment, destruction or use of falsified documentation, and the improper use of information or position for personal financial benefit
- provide regular training to staff on fraud policies and procedures, and provide tailored training to staff in high-risk roles
- have in place systems and processes that ensure that all losses are captured and assessed for reporting under the Financial Management Act 1994.
Appendix A. Audited entities
Figure A1 lists the 12 technical and further education (TAFE) institutes and their 16 controlled entities, which formed the TAFE sector at 31 December 2015.
Figure A1
TAFE sector entities at 31 December 2015
Entity |
|---|
|
Bendigo Kangan Institute of Technical and Further Education
Box Hill Institute of Technical and Further Education
Chisholm Institute of Technical and Further Education
Federation Training(a) Gordon Institute of Technical and Further Education
Goulburn Ovens Institute of Technical and Further Education Holmesglen Institute of Technical and Further Education
Melbourne Polytechnic South West Institute of Technical and Further Education Sunraysia Institute of Technical and Further Education
William Angliss Institute of Technical and Further Education
|
(a) Not included in the analysis of the sector, as discussed in Part 1.
Source: Victorian Auditor-General's Office.
Appendix B. Risk rating
Figure B1 shows the risk ratings applied to management letter points raised during an audit review.
Figure B1
Risk definitions applied to issues reported in audit management letters
Rating |
Definition |
Management action required |
|---|---|---|
Extreme |
The issue represents:
|
Requires immediate management intervention with a detailed action plan to be implemented within one month. Requires executive management to correct the material misstatement in the financial report as a matter of urgency to avoid a qualified audit opinion. |
High |
The issue represents:
|
Requires prompt management intervention with a detailed action plan implemented within two months. Requires executive management to correct the material misstatement in the financial report to avoid a qualified audit opinion. |
Medium |
The issue represents:
|
Requires management intervention with a detailed action plan implemented within three to six months. |
Low |
The issue represents:
|
Requires management intervention with a detailed action plan implemented within six to 12 months. |
Source: Victorian Auditor-General's Office.
Appendix C. Financial sustainability indicators
Financial sustainability risk indicators
Figure C1 shows the indicators used in assessing the financial sustainability risks of TAFEs in Part 2 of this report. These indicators should be considered collectively, and are more useful when assessed over time as part of a trend analysis.
Figure C1
Financial sustainability risk indicators
Indicator |
Formula |
Description |
|---|---|---|
Net result (%) |
Net result / Total revenue |
A positive result indicates a surplus, and the larger the percentage, the stronger the result. A negative result indicates a deficit. Operating deficits cannot be sustained in the long term. Net result and total revenue is obtained from the comprehensive operating statement. |
Liquidity (ratio) |
Current assets / Current liabilities |
This measures the ability to pay existing liabilities in the next 12 months. A ratio of one or more means there are more cash and liquid assets than short-term liabilities. |
Capital replacement (ratio) |
Cash outflows for property, plant and equipment / Depreciation |
Comparison of the rate of spending on infrastructure with its depreciation. Ratios higher than 1:1 indicate that spending is faster than the depreciating rate. This is a long-term indicator, as capital expenditure can be deferred in the short term if there are not enough funds available from operations, and borrowing is not an option. Cash outflows for infrastructure are taken from the cash-flow statement. Depreciation is taken from the comprehensive operating statement. |
Internal financing (%) |
Net operating cash flow / Net capital expenditure |
This measures the ability of an entity to finance capital works from generated cash flow. The higher the percentage, the greater the ability for the entity to finance capital works from their own funds. Net operating cash flows and net capital expenditure are obtained from the cash flow statement. |
Source: Victorian Auditor General's Office.
The analysis of financial sustainability risk in this report reflects on the position of each consolidated TAFE.
Financial sustainability risk assessment criteria
The financial sustainability risk of each TAFE has been assessed using the criteria outlined in Figure C2.
Figure C2
Financial sustainability risk indicators—risk assessment criteria
Risk |
Net result |
Liquidity |
Capital replacement |
Internal financing |
|---|---|---|---|---|
High |
Negative 10% or less Insufficient revenue is being generated to fund operations and asset renewal. |
Less than 0.75 Immediate sustainability issues with insufficient current assets to cover liabilities. |
Less than 1.0 Spending on capital works has not kept pace with consumption of assets. |
Less than 10% Limited cash generated from operations to fund new assets and asset renewal. |
Medium |
Negative 10%–0% A risk of long‑term rundown to cash reserves and inability to fund asset renewals. |
0.75–1.0 Need for caution with cash flow, as issues could arise with meeting obligations as they fall due. |
1.0–1.5 Could indicate that not enough is being spent on asset renewal. |
10–35% Might not be generating enough cash from operations to fund new assets. |
Low |
More than 0% Generating surpluses consistently. |
More than 1.0 No immediate issues with repaying short‑term liabilities as they fall due. |
More than 1.5 Low risk of not spending enough on asset renewal. |
More than 35% Generating enough cash from operations to fund new assets. |
Source: Victorian Auditor-General's Office.
Changes from previous reports
The financial sustainability risk indicators used in this report have changed slightly from those used in previous years. The three changes are that:
- The indicators have been calculated from the information in the published financial statements for the entity, with no adjustments made to these figures.
- The net result indicator has replaced the previous underlying result indicator.
- The internal financing indicator has replaced the previous self-financing indicator.
Financial sustainability risk analysis results
The financial sustainability risk for each consolidated TAFE institute, for each of the years 2011 to 2015, are shown in Figures C3 to C14. Federation Training has been excluded from this analysis.
The following trend analysis has been applied to the results for each TAFE:
↓ Deteriorating trend |
↑ Improving trend |
■ No substantial trend identified |
Figure C3
Financial sustainability risk indicator results for
Bendigo Kangan Institute for the year ending 31 December
Net result |
Liquidity |
Capital replacement |
Internal financing |
|
|---|---|---|---|---|
2011 |
-5.78% |
0.88 |
1.10 |
82% |
2012 |
0.53% |
1.10 |
0.60 |
286% |
2013 |
0.30% |
1.37 |
0.30 |
134% |
2014 |
-13.42% |
2.35 |
0.11 |
488% |
2015 |
2.17% |
2.37 |
0.23 |
751% |
Trend |
■ |
↑ |
↓ |
■ |
Note: The years 2011 to 2013 represent Bendigo TAFE only. Kangan Institute was merged with Bendigo TAFE at 1 July 2014. The years 2014 and 2015 show the results of the combined TAFE.
Source: Victorian Auditor-General's Office.
Figure C4
Financial sustainability risk indicator results for
Box Hill Institute at 31 December
Net result |
Liquidity |
Capital replacement |
Internal financing |
|
|---|---|---|---|---|
2011 |
14.03% |
2.78 |
0.89 |
424% |
2012 |
7.99% |
2.44 |
2.85 |
81% |
2013 |
-2.77% |
2.27 |
3.49 |
0% |
2014 |
-7.50% |
2.14 |
0.66 |
0% |
2015 |
7.23% |
2.83 |
1.18 |
194% |
Trend |
■ |
■ |
↓ |
↓ |
Source: Victorian Auditor-General's Office.
Figure C5
Financial sustainability risk indicator results for
Chisholm Institute at 31 December
Net result |
Liquidity |
Capital replacement |
Internal financing |
|
|---|---|---|---|---|
2011 |
4.70% |
1.34 |
2.03 |
183% |
2012 |
2.66% |
1.48 |
1.02 |
78% |
2013 |
22.65% |
2.40 |
2.73 |
160% |
2014 |
20.67% |
3.02 |
3.83 |
116% |
2015 |
4.84% |
4.12 |
0.58 |
391% |
Trend |
■ |
↑ |
↓ |
↑ |
Source: Victorian Auditor-General's Office.
Figure C6
Financial sustainability risk indicator results for
Gordon Institute of TAFE at 31 December
Net result |
Liquidity |
Capital replacement |
Internal financing |
|
|---|---|---|---|---|
2011 |
17.22% |
3.14 |
0.94 |
773% |
2012 |
13.16% |
3.98 |
1.49 |
200% |
2013 |
0.79% |
4.49 |
0.23 |
305% |
2014 |
-18.51% |
5.30 |
0.33 |
0% |
2015 |
-1.65% |
6.28 |
0.37 |
869% |
Trend |
↓ |
↑ |
↓ |
↑ |
Source: Victorian Auditor-General's Office.
Figure C7
Financial sustainability risk indicator results for Goulburn Ovens
Institute of Technical and Further Education at 31 December
Net result |
Liquidity |
Capital replacement |
Internal financing |
|
|---|---|---|---|---|
2011 |
-8.11% |
1.97 |
0.76 |
185% |
2012 |
15.40% |
3.29 |
0.72 |
506% |
2013 |
11.21% |
3.19 |
0.50 |
741% |
2014 |
-31.23% |
3.60 |
0.27 |
0% |
2015 |
-2.97% |
3.55 |
0.34 |
87% |
Trend |
■ |
■ |
↓ |
↓ |
Source: Victorian Auditor-General's Office.
Figure C8
Financial sustainability risk indicator results for
Holmesglen Institute at 31 December
Net result |
Liquidity |
Capital replacement |
Internal financing |
|
|---|---|---|---|---|
2011 |
7.63% |
2.04 |
3.50 |
43% |
2012 |
5.35% |
1.02 |
1.75 |
127% |
2013 |
-4.20% |
0.41 |
0.64 |
117% |
2014 |
-7.90% |
1.80 |
0.73 |
0% |
2015 |
9.88% |
2.16 |
0.68 |
138% |
Trend |
■ |
■ |
↓ |
■ |
Source: Victorian Auditor-General's Office.
Figure C9
Financial sustainability risk indicator results for
Kangan Institute at 31 December
Net result |
Liquidity |
Capital replacement |
Internal financing |
|
|---|---|---|---|---|
2011 |
11.28% |
1.65 |
4.97 |
89% |
2012 |
-0.71% |
1.69 |
1.13 |
26% |
2013 |
3.18% |
1.41 |
0.97 |
199% |
Note: Kangan Institute was merged with Bendigo TAFE at 1 July 2014. The combined results are shown in Figure C3 as Bendigo-Kangan Institute.
Source: Victorian Auditor-General's Office.
Figure C10
Financial sustainability risk indicator results for
Melbourne Polytechnic at 31 December
Net result |
Liquidity |
Capital replacement |
Internal financing |
|
|---|---|---|---|---|
2011 |
8.82% |
2.22 |
2.11 |
141% |
2012 |
3.34% |
2.19 |
2.07 |
100% |
2013 |
-28.05% |
1.03 |
1.06 |
0% |
2014 |
-16.90% |
0.62 |
0.23 |
0% |
2015 |
-2.50% |
1.08 |
0.04 |
29783% |
Trend |
↓ |
↓ |
↓ |
↑ |
Source: Victorian Auditor-General's Office.
Figure C11
Financial sustainability risk indicator results for
South West Institute of TAFE at 31 December
Net result |
Liquidity |
Capital replacement |
Internal financing |
|
|---|---|---|---|---|
2011 |
4.16% |
1.55 |
1.71 |
113% |
2012 |
-1.73% |
1.08 |
0.97 |
78% |
2013 |
-12.59% |
1.45 |
0.67 |
0% |
2014 |
-31.60% |
0.86 |
0.22 |
0% |
2015 |
3.47% |
2.75 |
0.25 |
23% |
Trend |
■ |
■ |
↓ |
↓ |
Source: Victorian Auditor-General's Office.
Figure C12
Financial sustainability risk indicator results for Sunraysia Institute
of Technical and Further Education at 31 December
Net result |
Liquidity |
Capital replacement |
Internal financing |
|
|---|---|---|---|---|
2011 |
-5.06% |
1.26 |
0.98 |
27% |
2012 |
0.28% |
1.68 |
0.62 |
199% |
2013 |
4.54% |
1.61 |
1.40 |
166% |
2014 |
-44.34% |
0.72 |
0.98 |
30% |
2015 |
16.92% |
1.52 |
1.81 |
180% |
Trend |
↑ |
■ |
↑ |
↑ |
Source: Victorian Auditor-General's Office.
Figure C13
Financial sustainability risk indicator results for
William Angliss Institute of TAFE at 31 December
Net result |
Liquidity |
Capital replacement |
Internal financing |
|
|---|---|---|---|---|
2011 |
-2.23% |
1.40 |
1.38 |
89% |
2012 |
-2.22% |
1.38 |
0.65 |
0% |
2013 |
-11.34% |
1.20 |
0.46 |
0% |
2014 |
-1.65% |
1.37 |
0.17 |
0% |
2015 |
5.21% |
1.77 |
0.25 |
2135% |
Trend |
↑ |
↑ |
↓ |
↑ |
Source: Victorian Auditor-General's Office.
Figure C14
Financial sustainability risk indicator results for
Wodonga Institute of TAFE at 31 December
Net result |
Liquidity |
Capital replacement |
Internal financing |
|
|---|---|---|---|---|
2011 |
7.43% |
1.49 |
2.00 |
155% |
2012 |
22.52% |
2.12 |
3.00 |
149% |
2013 |
2.19% |
2.28 |
2.39 |
0% |
2014 |
2.44% |
3.00 |
0.75 |
200% |
2015 |
1.60% |
3.66 |
0.31 |
754% |
Trend |
↓ |
↑ |
↓ |
↓ |
Source: Victorian Auditor-General's Office.
Appendix D. Fraud management framework
As discussed in Part 4, our review of fraud risk assessment and control monitoring at the 11 technical and further education (TAFE) institutes was based on the Controlling fraud and corruption: a prevention checklist, issued by the Independent Broad-based Anti-corruption Commission (IBAC) in November 2013.
The key components of a good fraud control framework are shown in Figure D1.
Figure D1
Fraud risk and control monitoring checklist
Element of framework |
|---|
Assessing fraud risk |
|
Implement and maintain an integrity framework |
|
Fraud control governance arrangements |
|
Management commitment to controlling risks of fraud |
|
Ethical framework |
|
Line management accountability |
|
Internal controls |
|
Employee awareness |
|
Client and community awareness |
|
Pre-employment screening |
|
Supplier and client vetting |
|
Avenues for reporting suspected incidents |
|
Protections for disclosers |
|
Source: Victorian Auditor-General's Office based on Controlling fraud and corruption: a prevention checklist, Independent Broad-based Anti‑corruption Commission (November 2013).
Appendix E. Glossary
Accountability
Responsibility on public entities to achieve their objectives, with regard to reliability of financial reporting, effectiveness and efficiency of operations, compliance with applicable laws, and reporting to interested parties.
Asset
A resource controlled by an entity from which future economic benefits are expected to flow to the entity.
Audit Act 1994
The Audit Act 1994 establishes the operating powers and responsibilities of the Auditor-General. This includes the operations of his office—the Victorian Auditor‑General's Office (VAGO)—as well as the nature and scope of audits that VAGO carries out.
Auditor's opinion
Written expression within a specified framework indicating the auditor's overall conclusion on the financial (and performance) reports based on audit evidence obtained.
Capital expenditure
Amount capitalised to the balance sheet for contributions by a public sector entity to major assets owned by the entity, including expenditure on:
- capital renewal of existing assets that returns the service potential or the life of these assets
- expenditureon new assets, including buildings, infrastructure, plant and equipment.
Clear audit opinion
A positive written expression provided when the financial report has been prepared and presents fairly the transactions and balances for the reporting period in keeping with the requirements of the relevant legislation and Australian Accounting Standards—also referred to as an unqualified audit opinion.
Depreciation
The systematic allocation of the value of an asset over its expected useful life.
Emphasis of matter
An auditor's report can include an emphasis of matter paragraph that draws attention to a disclosure or item in the financial report that is relevant to the users of the auditor's report but is not of such nature that it affects the auditor's opinion—the auditor's opinion remains unqualified.
Entity
A body, whether corporate or unincorporated, that has a public function to exercise on behalf of the state or is wholly owned by the state—including departments, statutory authorities, statutory corporations and government business enterprises.
Expense
Outflows or other depletions of economic benefits in the form of incurrence of liabilities or depletion of assets of the entity.
Financial reporting direction
Financial reports are prepared in keeping with Australian Accounting Standards and Interpretations as issued by the Australian Accounting Standards Board (AASB). When an AASB standard provides accounting treatment options, the Minister for Finance issues financial reporting directions to ensure consistent application of accounting treatment across the Victorian public sector in compliance with that particular standard.
Financial sustainability
An entity's ability to manage financial resources so that it can meet spending commitments, both at present and into the future.
Financial year
A period of 12 months for which a financial report is prepared.
Going concern
An entity that is expected to be able to pay its debts as and when they fall due, and continue in operation without any intention or necessity to liquidate or otherwise wind up its operations.
Governance
The control arrangements in place that are used to govern and monitor an entity's activities in order to achieve its strategic and operational goals.
Impairment
The amount by which the value of an asset held by an entity exceeds its recoverable amount.
Internal audit
A function of an entity's governance framework that examines and reports to management on the effectiveness of risk management, control and governance processes.
Internal control
Internal control is a means by which an entity's resources are directed, monitored and measured. It plays an important role in preventing and detecting error and fraud and protecting the entity's resources.
Liability
A present obligation of an entity arising from past events, the settlement of which is expected to result in an outflow from the entity of resources embodying economic benefits.
Management letter
A letter issued by the auditor to the governing body, the audit committee and management of an entity outlining weaknesses in controls and other issues identified during the financial audit.
Materiality
Information is material if its omission or misstatement could influence the economic decisions of users taken on the basis of the financial report. Materiality depends on the size or nature of the item or error judged in the particular circumstances of its omission or misstatement.
Net result
The net result is calculated by subtracting an entity's total expenses from the total revenue, to show what the entity has earned or lost in a given period of time.
Non-reciprocal
Transfers in which an entity receives assets without directly giving equal value in exchange to the other party to the transfer.
Qualified audit opinion
A qualified audit opinion is issued when the auditor concludes that an unqualified opinion cannot be expressed because of:
- disagreement with those charged with governance or
- conflict between applicable financial reporting frameworks or
- limitationof scope.
A qualified opinion shall be expressed as being unqualified except for the effects of the matter to which the qualification relates.
Performance report
A statement containing predetermined performance indicators, targets and actual results achieved for the financial year, with an explanation for any significant variance between the results and targets.
Relevant
Measures or indicators used by an entity are relevant if they have a logical and consistent relationship to its objectives and are linked to the outcomes to be achieved.
Revaluation
Recognising a reassessment of values for non-current assets at a particular point in time.
Revenue
Inflows of funds or other enhancements or savings in outflows of service potential, or future economic benefits in the form of increases in assets or reductions in liabilities of an entity, other than those relating to contributions by owners which result in an increase in equity during the reporting period.
Risk
The chance of a negative impact on the objectives, outputs or outcomes of the entity.
Risk register
A tool to help an entity identify, monitor and mitigate risks.
Appendix F. Audit Act 1994 section 16—submissions and comments
Introduction
In accordance with section 16(3) of the Audit Act 1994, a copy of this report, or part of this report, was provided to the Department of Education & Training and each of the 12 technical and further education institutes with a request for submissions or comments.
The submissions and comments provided are not subject to audit nor the evidentiary standards required to reach an audit conclusion. Responsibility for the accuracy, fairness and balance of those comments rests solely with the agency head.
Responses were received as follows:
RESPONSE provided by the Secretary, Department of Education & Training
RESPONSE provided by the Secretary, Department of Education & Training – continued
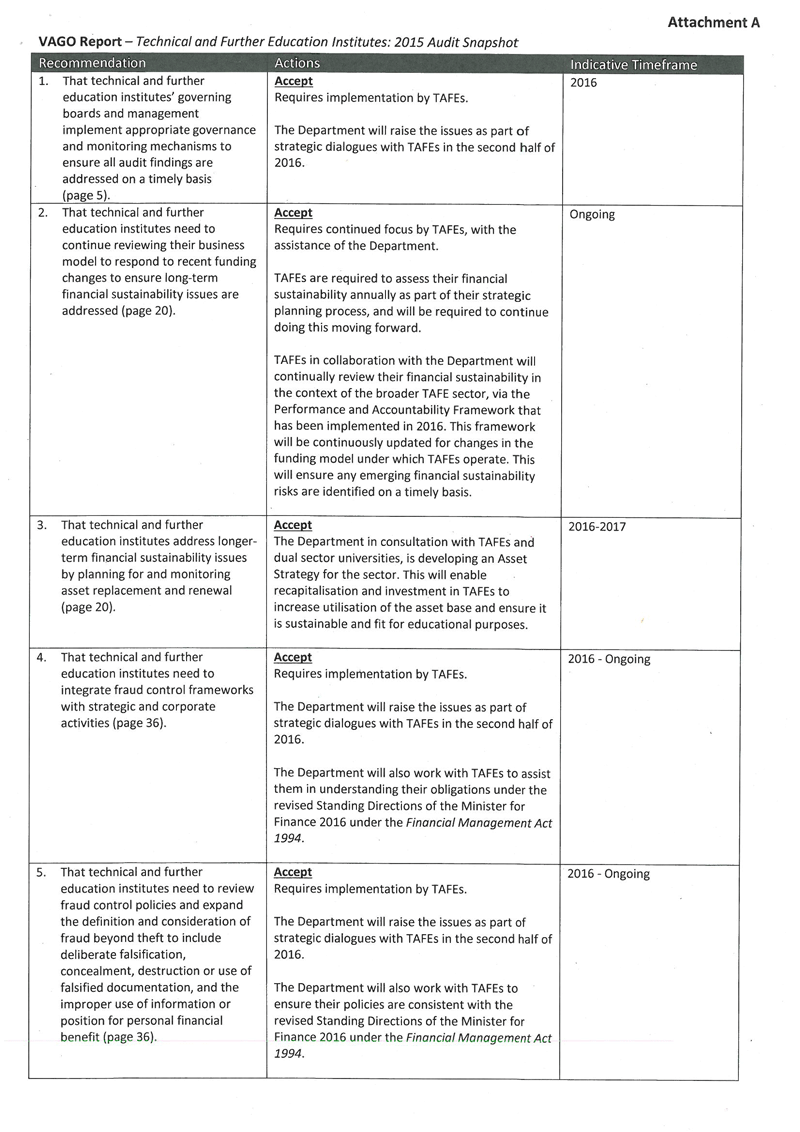
RESPONSE provided by the Secretary, Department of Education & Training – continued

RESPONSE provided by the Chief Executive Officer, Melbourne Polytechnic