Universities: Results of the 2013 Audits
Overview
This report covers the results of the 2013 financial audits of 64 entities, comprising eight universities and the 56 entities they control.
Clear audit opinions were issued on the financial reports of 59 entities. Two qualified opinions were issued, relating to the financial reports of Deakin University and The University of Melbourne, as a result of their accounting treatments of grants received in 2013. Three entities are yet to finalise their financial reports.
The eight universities generated a net surplus of $381.7 million in 2013, a decrease of $73 million from 2012. With continued operating surpluses and low levels of debt, the university sector remains in a relatively healthy financial position. However, active management is required given that operating surpluses have continued their decline since 2009.
While student revenue and the number of students enrolled in higher education continue to increase, they mask a significant decline in domestic and international vocational education and training student numbers during 2013.
Three universities were assessed as having a high risk to self-financing in 2013. The remaining five were assessed as having a medium risk. This indicates that some universities may be unable to fund asset replacement in future periods from cash generated from their operations.
In 2013 Monash University signed agreements with a private sector entity to assume control of its South African operations. From 2001 to 2013 Monash University provided $101.8 million in loan funding to its subsidiary entities associated with the South Africa campus. Monash University has incurred a net loss of $60.5 million in relation to the operation and disposal of this subsidiary, including debt write‑offs of $44.7 million.
Universities: Results of the 2013 Audits: Message
Ordered to be printed
VICTORIAN GOVERNMENT PRINTER May 2014
PP No 327, Session 2010–14
President
Legislative Council
Parliament House
Melbourne
Speaker
Legislative Assembly
Parliament House
Melbourne
Dear Presiding Officers
Under the provisions of section 16AB of the Audit Act 1994, I transmit my report Universities: Results of the 2013 Audits.
This report summarises the results of the financial audits of eight universities and the 56 entities they control at 31 December 2013.
It informs Parliament about significant issues identified during our audits and complements the assurance provided through individual audit opinions included in the entities' annual reports.
The report highlights continued operating surpluses and low levels of debt, which shows that the university sector is in a relatively healthy financial position and well placed to fund service delivery improvements. Active management is required, however, given that operating surpluses have continued to decline since 2009.
While student revenue and the number of students enrolled in higher education continue to increase, this masks a significant decline in domestic and international vocational education and training student numbers at dual-sector universities during 2013.
Yours faithfully

John Doyle
Auditor-General
28 May 2014
Auditor-General's comments
 John Doyle Auditor-General |
Audit team Tim Loughnan—Sector Director Michael Almond—Team Leader Matthew Graver—Audit Senior Ryan Ackland—Auditor Ellen Holland—Engagement Quality Control Reviewer |
Auditor-General's comments
Victoria’s universities deliver post-secondary educational services to both domestic and international students. Operating in an environment where they must compete for student enrolments, universities are tasked with delivering high-quality education but also managing their resources in a financially prudent manner.
The university sector has consistently delivered healthy financial results, and 2013 was no exception. Despite declining government funding to the sector, each of the eight universities generated an operating surplus in 2013. The total sector surplus of $381.7 million continued a strong trend for the past few years.
With low debt levels and significant asset bases, universities are well positioned to cope with changes in the tertiary education sector. They also generate significant amounts from student fees and other educational activities, which now represent a larger proportion of their income than government funding.
There are a number of challenges facing the sector, however. Expenditure growth outstripped revenue growth in 2013, and a number of financial indictors deteriorated. For example, the self-financing indicator, which is a measure of an entity’s ability to generate cash from its operations to fund asset renewal, declined sharply in 2013.
Capital expenditure also declined, due to a wind-down in activity after significant capital works across the sector in recent years. These recently completed projects see universities well placed to cope with student demand, and illustrate a commitment to improved services and growth in the sector. It is important that capital restitution is prioritised, and that buildings and major assets continue to be periodically renewed. I noted that Monash University relinquished control of its operations in South Africa during 2013, after $101.8 million was contributed to this overseas campus over the past decade. An overall loss of $60.5 million was incurred in relation to the operation and disposal of this campus, highlighting one of the risks facing universities with global aspirations.
As with any government-owned entity, Victoria’s universities are required to implement processes to ensure value for money and appropriateness of expenditure. My office examined procurement practices across each of the universities, as well as reviewing the policies and procedures in place to regulate key financial activities. These practices and policies were generally considered to be sound, although improvement can be made in some areas.
Sound financial reporting frameworks are essential to ensuring quality of the final product. My audits identified gaps in the financial reporting processes at a number of universities. I am concerned that a number of Recommendations regarding the quality of financial reporting have been made over the past few years, with little improvement in the outcomes achieved. Accordingly, in our future reports to Parliament, we intend to name the universities that do not take appropriate steps to improve their practices.
John Doyle
Auditor-General
May 2014
Audit summary
This report covers the results of the 2013 financial audits of 64 entities, comprising eight universities and the 56 entities they control.
Historically the results of audits of universities and technical and further education (TAFE) institutes are found in one report, the Tertiary Education and Other Entities: Results of Audits report. This year, however, for the first time the results will be presented in separate reports: Universities: Results of the 2013 Audits and Technical and Further Education Institutes: Results of the 2013 Audits.
This approach recognises the significant changes over recent years in the higher education and vocational training sectors. There have been changes to the market settings in both sectors, changes to legislation for both TAFEs and universities, and increased competition between public and private sector providers and between higher education and vocational training providers—with further changes signalled in the higher education sector. This means that TAFEs and universities are operating in increasingly disparate environments. The entities in each sector are subject to different pressures on their operations. By reporting separately, we aim to provide the reader with greater clarity about the performance of entities in the two sectors.
Clear audit opinions were issued on the financial reports of 59 university entities. The two qualified opinions relate to the financial reports of Deakin University and The University of Melbourne, as a result of their accounting treatment of grants received in 2013. The financial reports of three entities are yet to be finalised.
Conclusions
Parliament can have confidence in the adequacy of financial reporting of the entities that received clear audit opinions. Users of the financial statements of the remaining two entities should consider the matters leading to the qualifications in interpreting the results.
Continued operating surpluses and low levels of debt mean the university sector is in a relatively healthy financial position. Nevertheless, active management is required, given that operating surpluses have continued to decline since 2009.
Findings
Quality of reporting
Assessments of report preparation processes across the university sector showed that performance deteriorated in 2013. Results of these assessments have been reported over a number of years, however some entities have not acted to take-up the range of elements designed to improve the efficiency and effectiveness of their financial report preparation. In our future reports to Parliament, we intend to name the universities that do not take appropriate steps to improve their practices.
Financial results and sustainability
The eight universities generated a net surplus of $381.7 million in 2013, a decrease of $73 million or 16 per cent from 2012. The decrease reflected higher operating costs and increased depreciation for new assets built in prior years and revaluation increments over the past three years.
While student revenue and the number of students enrolled in higher education continue to increase, this masks a significant decline in domestic and international vocational education and training student numbers at dual-sector universities during 2013.
All universities recorded surpluses in 2013. Operating surpluses and relatively low debt show Victorian universities to be in a good financial situation. There are challenges, however, as operating surpluses have declined since 2009.
Three universities were assessed as having a high risk to self-financing in 2013. The remaining five were assessed as having a medium risk. This indicates that some universities may be unable to fund asset replacement in future periods from cash generated from their operations.
Monash University's South African campus
In 2013 Monash University signed agreements with a private sector entity to assume control of its South African operations. From 2001 to 2013 Monash University provided $101.8 million in loan funding to its subsidiary entities associated with the South African campus. Despite some small loan repayments during this time and the sale of land and buildings associated with the campus, Monash University has incurred a net loss of $60.5 million in relation to the operation and disposal of this subsidiary over the period, including debt write-offs of $44.7 million.
Internal controls
Each of the eight universities had policies and procedures relating to procurement that complied with their enabling legislation and were in line with government policies and guidelines. Although documented policies and procedures were in place for key financial activities at universities these could still benefit from a review against the better practice framework presented in this report.
While post-tender evaluations were generally completed for larger and more complex procurements, five universities did not set time lines for the completion of these reviews. As a result, the opportunity to identify areas for improvement in procurement arrangements was compromised.
Controls over financial delegations were generally sound across the university sector. However, improvements could be made in relation to governance and oversight.
Recommendations
Number |
Recommendation |
| 1. | That universities that do not demonstrate better practice in report preparation act immediately to improve their financial reporting processes in 2014. |
| 2. | That universities and their controlled entities act to ensure their financial reports meet legislated reporting time lines. |
| 3. | That universities continue to review their financial policies on a timely basis and ensure that the key elements of the better practice framework are addressed. |
Submissions and comments received
In addition to progressive engagement during the course of the audit, in accordance with section 16(3) of the Audit Act 1994 a copy of this report, or relevant extracts from the report, was provided to all universities, the Department of Treasury and Finance and the Department of Education and Early Childhood Development with a request for submissions or comments.
Agency views have been considered in reaching our audit conclusions and are represented to the extent relevant and warranted in preparing this report. Their full section 16(3) submissions and comments are included in Appendix F.
1 Background
1.1 Introduction
Historically the results of audits of universities and technical and further education (TAFE) institutes were presented in one report, the Tertiary Education and Other Entities: Results of Audits report. This year however, for the first time the results will be presented in separate reports: Universities: Results of the 2013 Audits and Technical and Further Education Institutes: Results of the 2013 Audits.
This approach recognises the significant changes over recent years in the higher education and vocational training sectors. There have been changes to the market settings in both sectors, changes to legislation for both TAFEs and universities, and increased competition between public and private sector providers and between higher education and vocational training providers—with further changes signalled in the higher education sector. This means that TAFEs and universities are operating in increasingly disparate environments. The entities in each sector are subject to different pressures on their operations. By reporting separately, we aim to provide the reader with greater clarity about the performance of entities in the two sectors.
1.1.1 This report
This report covers the results of 2013 audits of 64 entities, comprising eight universities and the 56 entities they control. It is one of a suite of Parliamentary reports on the results of 2012–13 financial audits conducted by VAGO. The full list of reports can be found in Appendix A of this report.
A breakdown of the 64 entities covered by this report is set out in Figure 1A.
Figure 1A
Universities and controlled entities
Entity category |
2012 |
2013 |
|---|---|---|
University(a) |
8 |
8 |
Entities controlled by universities(b) |
56 |
56 |
Total |
64 |
64 |
(a) Includes four dual-sector universities. Refer later in this Part for further information.
(b) Entities controlled by universities comprise subsidiary companies and trusts.
Source: Victorian Auditor-General's Office.
Details of the entities covered in this report are set out in Appendix B.
1.2 Structure of this report
Figure 1B outlines the structure of this report.
Figure 1B
Report structure
Report part |
Description |
|---|---|
Part 2: Financial reporting |
Reports the results of the 2013 financial audits of eight universities and the 56 entities that they control. |
Part 3: Financial results |
Summarises and analyses the financial results of eight universities, including financial performance for 2013. |
Part 4: Financial sustainability |
Provides insight into the financial sustainability of eight universities, based on the trends of five financial sustainability indicators over a five‑year period. |
Part 5: Internal controls |
Assesses the internal controls, including over procurement, financial policies and financial delegations, across the university sector. |
Source: Victorian Auditor-General's Office.
1.3 Audit of financial reports
An annual financial audit has two aims:
- to give an opinion consistent with section 9 of the Audit Act 1994, on whether the financial statements present fairly
- to consider whether there has been wastage of public resources or a lack of probity or financial prudence in the management or application of public resources, consistent with section 3A(2) of the Audit Act 1994.
The financial audit framework applied in the conduct of the audits is set out in Appendix C.
1.3.1 Audit of internal controls relevant to the preparation of the financial report
Integral to the annual financial audit is an assessment of the adequacy of the internal control framework, and the governance processes, related to an entity's financial reporting. In making this assessment, consideration is given to the internal controls relevant to the entity's preparation and fair presentation of the financial report, but this assessment is not used for the purpose of expressing an opinion on the effectiveness of the entity's internal controls.
Internal controls are systems, policies and procedures that help an entity reliably and cost effectively meet its objectives. Sound internal controls enable the delivery of reliable, accurate and timely internal and external reporting.
An explanation of the internal control framework, and its main components, are set out in Appendix C. An entity's governing body is responsible for developing and maintaining its internal control framework.
Internal control weaknesses we identify during an audit do not usually result in a 'qualified' audit opinion because often an entity will have compensating controls in place that mitigate the risk of a material error in the financial report. A qualification is warranted only if weaknesses cause significant uncertainty about the accuracy, completeness and reliability of the financial information being reported.
Weaknesses in internal controls found during the audit of an entity are reported to its chancellor, vice-chancellor and audit committee in a management letter.
Our reports to Parliament raise systemic or common weaknesses identified during our assessments of internal controls over financial reporting, across a sector.
1.4 Conduct of university financial audits
The audits of the eight universities and 56 controlled entities were undertaken in accordance with the Australian Auditing Standards.
Pursuant to section 20(3) of the Audit Act 1994, unless otherwise indicated any persons named in this report are not the subject of adverse comment or opinion.
The total cost of preparing and printing this report was $135 000.
1.5 Subsequent events
1.5.1 Changes to reporting by dual sector universities
Until 31 December 2013, four 'dual-sector' universities operated in Victoria, namely, Federation University (formerly University of Ballarat), Royal Melbourne Institute of TAFE University, Swinburne University of Technology and Victoria University. In addition to its higher education courses, a dual-sector university includes a TAFE component that delivers vocational education and training.
The Education and Training Reform Amendment (Dual Sector Universities) Act 2013 was enacted from 1 January 2014 and removed the requirement for dual-sector universities to make separate disclosure of their TAFE activities in their financial reports, or to include audited performance statements in their annual reports.
The legislative amendment reduces the reporting workload for the four universities and eliminates difficulties associated with separately reporting their TAFE and higher education activities given that administrative support and course delivery has been largely integrated over time.
From 1 January 2014, TAFE results of the four dual-sector universities will no longer be included in the Victorian whole-of-government consolidated financial statements.
2 Financial reporting
At a glance
Background
This Part covers the results from the 2013 audits of the eight universities and the 56 entities they control. It also compares financial reporting practices in 2013 against better practice, legislated time lines and 2012 performance.
Conclusion
Parliament can have confidence in the financial reports of 59 entities given unqualified audit opinions for 2013. The financial reports of two entities received qualified audit opinions due to their accounting treatments of grants. Users of the financial statements of the two entities should consider the matters leading to the qualifications in interpreting the results. The financial reports of three entities are yet to be finalised.
Findings
- Deakin University and The University of Melbourne received qualified opinions due to their accounting treatments of non-reciprocal research and capital grants which meant that the unspent portion of these grants received in 2013 were not accounted for as revenue in 2013.
- Only 47 of 64 entities completed their financial reports within legislated time lines.
- Assessments of report preparation processes against better practice criteria showed that performance of universities deteriorated in 2013.
Recommendations
- That universities that do not demonstrate better practice in report preparation act immediately to improve their financial reporting processes in 2014.
- That universities and their controlled entities act to ensure their financial reports meet legislated reporting time lines.
2.1 Introduction
This Part covers the results of the 2013 audits of the eight universities and the 56 entities they control.
2.2 Audit opinions issued
Independent audit opinions add credibility to financial reports by providing reasonable assurance that the information reported is reliable and accurate. A clear audit opinion confirms that the financial statements present fairly the transactions and balances for the reporting period, in accordance with the requirements of relevant accounting standards and legislation.
Clear audit opinions were issued on the financial reports of 59 entities for 2013.
2.2.1 Qualifications
A qualified audit opinion means that the financial report is materially different to the relevant financial reporting framework and is less reliable and useful as an accountability document.
Two qualified audit opinions were issued for the 2013 financial year (two for 2012). The details are provided below.
Treatment of non-reciprocal grants
Accounting standards require grants which are not required to be repaid to the provider to be recognised as revenue in the year they are received. While the Australian Accounting Standards Board continues to review grant accounting in not-for-profit organisations, until that review is complete, the accounting standards in their current form apply.
Deakin University and The University of Melbourne
Deakin University and The University of Melbourne have received qualified audit opinions for a number of years and again in 2013 because their treatment of unspent non‑reciprocal research and capital grant receipts is not in accordance with Australian Accounting Standards. In both cases, the entity usually defers the recognition of this revenue to the following year or to when the funds are spent.
Deakin University regards the receipt of these monies as a reciprocal transfer where the grants have outstanding performance or return conditions and accounts for them in accordance with Australian Accounting Standard AASB 118 Revenue. VAGO is of the opinion that these monies are non-reciprocal grants and should be accounted for in accordance with Australian Accounting Standard AASB 1004 Contributions, whereby such payments are treated as income in the year of receipt.
2.3 Quality of reporting
The quality of an entity's financial reporting can be measured in part by the timeliness and accuracy of the preparation and finalisation of its financial report, as well as against better practice criteria.
Appendix B details the legislative and reporting framework for the 64 entities.
2.3.1 Accuracy
The frequency and size of errors in the draft financial reports submitted to audit are direct measures of the accuracy of those reports. Ideally, there should be no errors or adjustments required as a result of an audit.
Our expectation is that all entities will adjust any errors identified during an audit, other than those errors that are clearly trivial or clearly inconsequential to the financial report, as defined under the auditing standards.
The public is entitled to expect that any financial reports that bear the Auditor‑General's opinion are accurate and of the highest possible quality. Therefore, all errors identified during an audit should be adjusted, other than those that are clearly trivial.
Material adjustments
When our staff detect errors in the draft financial reports they are raised with management. Material quantitative and/or qualitative errors need to be corrected before an unqualified audit opinion can be issued.
The entity itself may also change its draft financial reports after submitting them to audit if their quality assurance procedures identify that the draft information is incorrect or incomplete.
In relation to the 2013 audits, 12 material financial balance adjustments were made compared to seven in the prior year. The adjustments related mainly to errors associated with the preparation of accrual financial statements at year end. The adjustments resulted in changes to the net result and/or the net asset position of entities.
In addition to the financial balance adjustments, there were two qualitative disclosure errors that required adjustment in 2013 (six in 2012). These related to the current/non‑current nature of annual leave entitlements and debit amounts included in trade creditor balances.
All material errors were adjusted prior to the completion of the financial reports.
2.3.2 Timeliness
Timely financial reporting is key to providing accountability to stakeholders and enables informed decision-making. The later reports are produced and published after year end, the less useful they are.
The Financial Management Act 1994 requires an entity to submit its audited annual report to its Minister within 12 weeks of the end of financial year. Its annual report should be tabled in Parliament within four months of the end of financial year.
In 2013, 47 entities completed their financial reports within the legislated time frames. The remaining 17 entities failed to finalise their financial reports within 12 weeks of their applicable balance date.
Appendix B sets out the dates the 2013 financial reports were finalised.
The average time taken to finalise the university sector's 2013 financial reports was 10.5 weeks.
2.3.3 Better practice
An assessment of the quality of financial reporting processes of the universities was conducted against better practice criteria, detailed in Appendix C, using the following scale:
- no existence—process not conducted by the entity
- developing—partially encompassed in the entity's financial reporting process
- developed—entity has implemented the process, however it is not fully effective or efficient
- better practice—entity has implemented efficient and effective processes.
The results are summarised in Figure 2A.
Figure 2A
Results of assessment of report preparation processes against better practice elements
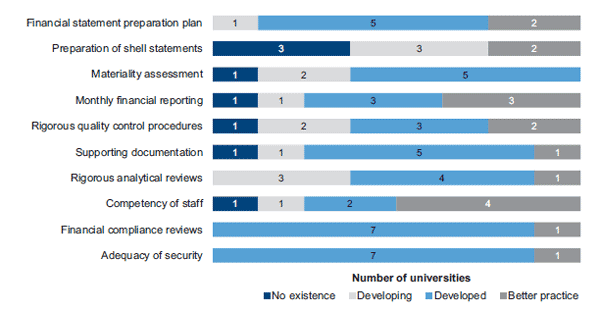
Source: Victorian Auditor-General's Office.
Security around sensitive information, financial report preparation plans and financial compliance reviews were found to be strong, with all universities' results assessed as either developed or better practice. There is, however, opportunity for further improvement in relation to most better practice elements, particularly:
- analytical reviews
- quality assurance
- materiality assessments.
The results for shell financial statements, competence of staff, monthly financial reporting, supporting documentation, quality assurance and materiality assessments deteriorated in 2013. The deterioration was most evident for two universities.
Assessments against better practice elements have been reported over a number of years. Nevertheless, some entities have not acted to take-up the range of elements which are designed to improve the efficiency and effectiveness of their financial report preparation. In our future reports to Parliament, we intend to name the universities that do not take appropriate steps to improve their practices.
Recommendations
- That universities that do not demonstrate better practice in report preparation act immediately to improve their financial reporting processes in 2014.
- That universities and their controlled entities act to ensure their financial reports meet legislated reporting time lines.
3 Financial results
At a glance
Background
This Part analyses the financial results of the eight universities for the year ended 31 December 2013.
Conclusion
The eight universities generated a net surplus of $381.7 million in 2013, a decrease of $73 million or 16 per cent from 2012, due to increased repairs and maintenance, other operating costs and depreciation due to capital works and revaluations over the past three years. While student revenue and the number of students enrolled in higher education continue to increase, this masks a significant decline in domestic and international vocational education and training student numbers at dual-sector universities during 2013.
Findings
- Revenue increased by $176.3 million or 2.5 per cent in 2013 to $7.1billion—driven by increases of $294 million in student fee revenue and $59 million in other revenue—despite a $225 million decrease in government funding.
- International student fees represented 46.7 per cent of total student fee revenue in 2013, compared to 50 per cent in 2012.
- Expenses increased by $247.1 million or 3.8 per cent in 2013 to $6.7 billion, driven by an increase in repairs and maintenance costs, depreciation expenses and other operating costs.
- The sector's level of debt decreased during the year from $788 million to $710 million (9.9 per cent) as borrowings used to fund construction of fixed assets were repaid.
- Monash University incurred a net loss of $60.5 million from its South African venture between 2001 and 2013, including foreign exchange movements, write‑offs of debt of $44.7 million, sale of land and buildings of $30 million, and $10 million in cash consideration.
- The January 2014 transfer of its Gippsland campus to Federation University resulted in a $6.1 million impairment of the associated assets in Monash's financial report and a $108.9 million asset revaluation reserve adjustment.
3.1 Introduction
Accrual-based financial statements enable an assessment of whether entities are generating sufficient surpluses from operations to maintain services, fund asset maintenance and retire debt. The ability to generate surpluses is subject to the regulatory environment in which they operate and their ability to minimise costs and maximise revenue.
3.2 Financial results
3.2.1 Financial performance
The eight universities collectively generated net surpluses of $381.7 million in 2013, a decrease of $73 million or 16 per cent over the prior year. All universities recorded surpluses in 2013 (seven in 2012).
Despite the reduction in the overall surplus, most universities are still well placed to fund service delivery improvements and meet their operating expenditure commitments.
Figure 3A compares the net results for 2013 and 2012 for each university.
Figure 3A
Net surplus/(deficit) by university, 2012 and 2013
|
Entity |
2013 ($ mil) |
2012 ($ mil) |
|---|---|---|
|
Deakin University |
77 746 |
107 388 |
|
Federation University(a) |
4 204 |
59 643 |
|
La Trobe University |
43 147 |
34 297 |
|
Monash University |
35 029 |
77 931 |
|
Royal Melbourne Institute of Technology University |
50 072 |
49 605 |
|
Swinburne University of Technology |
49 239 |
26 772 |
|
The University of Melbourne |
116 606 |
105 481 |
|
Victoria University |
5 635 |
(6 486) |
|
Total |
381 678 |
454 631 |
(a) Formerly University of Ballarat
Source: Victorian Auditor-General's Office.
Victoria University reported a surplus of $5.6 million, compared with a $6.5 million deficit in 2012, after a $55.8 million (16.7 per cent) decrease in employee costs following strategic downsizing in 2012.
Five of the eight universities improved their result in 2013, with Swinburne and Victoria Universities achieving overall operating cost savings compared to 2012.
Revenue
Total revenue is represented by government funding, student fee revenue, investment revenue and various other fees and charges. It excludes the impact of the deferred government superannuation contribution, which was offset by an equivalent expense.
In 2013, the eight universities generated revenue of $7.1 billion, an increase of $176.3 million from 2012. The increase was driven by a $294 million increase in student fee revenue and a $59 million increase in other revenue. The increases were offset by a $225 million decrease in government funding (7.1 per cent).
The composition of operating revenue for 2013 is presented in Figure 3B.
Figure 3B
Revenue composition, 2013
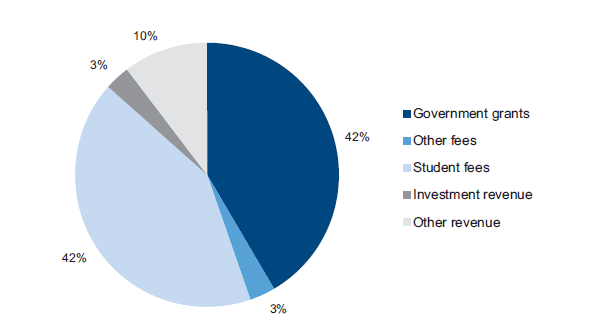
Source: Victorian Auditor-General's Office.
During 2013 the composition of revenue changed with a reduction in the proportion from government grants (45 per cent in 2012) and an increase in the proportion generated from student fees (42 per cent in 2012).
Trends in student fee revenue
Student fee revenue includes amounts provided by the Commonwealth Government to meet debts for students participating in the HECS-HELP and FEE-HELP schemes. Student fees comprised 42 per cent of total revenue in 2013.
Overall student fee revenue grew by $294 million or 10.9 per cent to $3.0 billion in 2013. Significant increases were reported at:
- La Trobe University—increase of $28.6 million (12.2 per cent)
- Royal Melbourne Institute of Technology (RMIT) University—increase of $62 million (14.0 per cent)
- The University of Melbourne—increase of $88.7 million (15.5 per cent)
- Deakin University—increase of $36.5 million (10.9percent).
Student fee revenue grew less than 10 per cent in 2013 at the remaining four universities.
The overall growth was mainly due to increases in course fees and a net 3.2 per cent increase in the number of students enrolled in higher education, including a 7.2 per cent increase in new students.
Despite the growth in student revenue and the number of higher education students, total student numbers—including vocational education and training (VET), higher education, domestic and international students—declined to around 361 500 in 2013 (from 370 200 in 2012).
Most notably, around 17 per cent of students in 2013 were VET students, compared to 23 per cent in 2012—a decline of 18 000 students or 22.2 per cent in 2013, including a 14.7 per cent decrease in new students. Changes to the funding model, where government subsidies vary depending on the course, have seen universities increase the cost to students for some VET courses.
International students
International student fees represented 46.7 per cent of total student fee revenue in 2013, compared to 50 per cent in 2012.
In 2013 international student numbers showed:
- a 3.1 percent decrease in higher education students, with 63 700 in total
- an 8.9 percent decrease in VET student numbers at dual-sector universities to 3 241 in 2013
- new student commencements were largely consistent with 2012 numbers.
Nevertheless, over the past five years, international student fee revenue has increased by $365 million (36 per cent) to $1.4 billion, contributing to the sector's generally strong surpluses. The number of international students studying higher education courses has remained relatively stable over the past five years. The number of international students studying VET courses at dual-sector universities has declined, however, by 46.7 per cent since 2009.
Figure 3C presents the number of onshore international student commencements at universities in 2013 and 2012.
Figure 3C
Onshore international new student commencements, 2012 and 2013
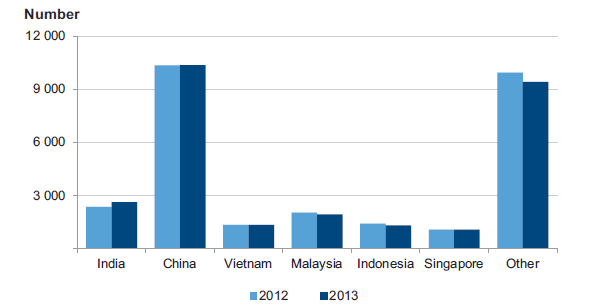
Source: Victorian Auditor-General's Office.
International students come from more than 100 countries. The six most represented countries are China, Malaysia, India, Indonesia, Vietnam and Singapore. Of the 'other' the most significant source country is the United States, representing less than 5 per cent of new student commencements.
Domestic students
Domestic student fees grew by $245.5 million or 18.3 per cent in 2013 and represented 53.3 per cent of total student fee revenue. Trends in domestic student numbers in 2013 included:
- an increase in higher education students, with total student numbers up 5.1 percent to 234 400
- a 9 300 (10 per cent) increase in higher education student commencements
- a 22.8 per cent decrease in VET course students at dual-sector universities, with total student numbers down to 60 200.
Expenses
In 2013, universities incurred expenditure of $6.7 billion, $247.1 million (3.8 per cent) more than in the prior year. This was driven by a $31.2 million (18.8 per cent) increase in repairs and maintenance and a $22.7 million (5.3 per cent) increase in depreciation and amortisation. Other operating costs also increased by $200.7 million in 2013.
The composition of expenditure is presented in Figure 3D.
Figure 3D
Expenditure composition, 2013
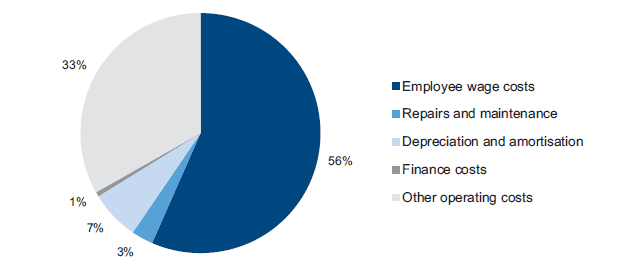
Source: Victorian Auditor-General's Office.
Other operating costs included:
- grant payments
- learning materials
- contractors and professional services.
3.3 Financial position
Universities carried land and buildings representing 69.6 per cent of their total assets on their balance sheets at 31 December 2013. Their revenue base is not tied to the value of their assets, however, and most of their assets cannot be readily sold to obtain funds.
The objective for a university should be to maintain and improve its asset base and related service provision, while managing its level of debt. Across the sector, there is evidence that this has been achieved. The significant capital works which were in progress over the last three years came to fruition in 2013, and the assets delivered are now in use.
At the same time, the level of debt decreased by 9.9 per cent in 2013 due to two universities repaying borrowings previously used to fund construction of fixed assets now in service.
3.3.1 Assets
During 2013, the total assets increased by $100.4 million (0.6 per cent) to $16.3 billion. This was mainly due to increases of $273 million in property, plant and equipment and $224 million in financial assets, offset by a $468.7 million decrease in deferred government superannuation contributions.
The increase was mainly driven by construction of new buildings ($661 million), offset by the depreciation expense and independent revaluations at some universities. Revaluation movements included:
- Monash University—$116.6 million decrease mainly relates to land and buildings at the Gippsland campus (further analysis is presented later in this Part)
- Deakin University—$71.5 million increase in land and buildings
- The University of Melbourne—$25.4 million increase in artworks.
The increase in financial assets was due to universities investing their operating surpluses, as well as achieving some holding gains from increases in market values. The composition of university assets was consistent with that of the prior year, with property, plant and equipment continuing to represent the majority of total assets.
3.3.2 Liabilities
At 31 December 2013 the total value of liabilities was $3.9 billion, $412.9 million (9.5 per cent) less than in 2012.
The deferred superannuation liability decreased by 27.8 per cent or $468.7 million during 2013 and at year end represented 30.9 per cent of total liabilities (39 per cent in 2012). The liability is based on an actuarial assessment and represents amounts expected to be paid to university employees who qualify for the defined benefits superannuation program. The decrease was driven by actuarial assumptions, including adjustments to the applicable discount rate and reducing the rate of contributions tax from 15 per cent to nil.
The decrease was matched by a decrease in the deferred superannuation receivable from government, resulting in no impact on net assets or net result.
Interest-bearing liabilities decreased by $77.8 million (9.9 per cent) during 2013. This was mainly due to a reduction in borrowings for RMIT ($39.6 million) and Monash ($19.0 million) universities. In prior years, borrowings were used to fund the construction of new and expanded building facilities. These projects are now coming to completion and the borrowings are being repaid progressively.
3.4 Monash University's South African campus
3.4.1 Background
Monash University established an overseas campus in South Africa in 2001. It created three subsidiary companies, as the legal vehicles:
- Monash Property South Africa (MPSA)—holding the campus infrastructure and assets of the South Africa campus and operating a rental/landlord arrangement with Monash South Africa (MSA)
- MSA—a private higher education institution and the operator of the campus, incorporated in 2004
- Monash Educational Enterprises (MEE)—the original higher education institution and operator of the campus.
Between 2001 and 2012, Monash University provided around $101.8 million in loans to the subsidiaries. The subsidiaries repaid $2.6 million during the same period.
Figure 3E presents the net results of each of the three entities from their inception until 2012.
Figure 3E
Net results for Monash University's South African subsidiaries, 2001–12
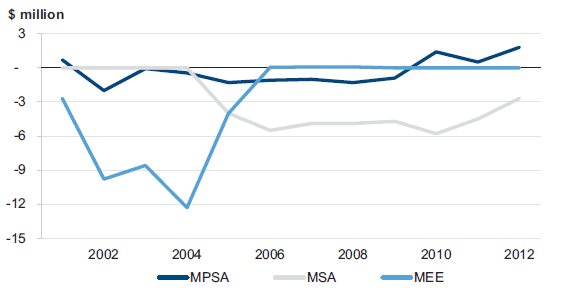
Note: Information presented is up to 2012, due to significant developments in 2013, which are discussed below.
Source: Victorian Auditor-General's Office.
Figure 3E shows that MPSA made small losses until 2010, after which it generated profits. MSA consistently generated losses since its establishment in 2004. MEE made significant losses until its operations were scaled down in 2005 and was dormant from 2006.
The loans provided by Monash University during the period, enabled the subsidiaries to continue to operate despite their poor operating results.
3.4.2 Current year developments
Monash South Africa
On 23 August 2013, Monash University signed a partnership agreement with a private sector entity aimed at accelerating the development of the South African campus and the development of education in Sub-Saharan Africa. To effect the partnership, Monash created a new company GNUCO Pty Ltd (GNUCO) which became the owner of MSA. Under the agreement Monash University sold 25 per cent of its ownership in GNUCO and subsequently on 14 February 2014 a further 50 per cent was transferred for a total initial consideration of $10 million.
Notwithstanding the transfer of majority ownership, the partnership arrangement still requires joint decision-making by the respective parties on major matters affecting campus operations.
The terms of the agreement provide that a deferred performance consideration payment of up to $12.5 million may be payable to Monash University by the private sector entity, depending on MSA's 2017 performance. The deferred consideration will be calculated based on the company's 2017 earnings before interest, tax and depreciation. Figure 3F sets out the relevant ownership details.
Figure 3F
GNUCO Pty Ltd shareholding and directorship
|
|
Number of shares |
Number of directors |
||
|---|---|---|---|---|
|
|
23 Aug 2013 |
14 Feb 2014 |
23 Aug 2013 |
14 Feb 2014 |
|
Monash University |
75 |
25 |
3 |
3 |
|
Private sector entity |
25 |
75 |
2 |
5 |
|
Total |
100 |
100 |
5 |
8 |
Source: Victorian Auditor-General's Office.
Monash Property South Africa
Of the three subsidiaries associated with the South Africa campus, only MPSA holds contributed equity from Monash University. This amounts to $11.6 million and comprises:
- $2 million in shares issued in 2001
- $4 million of debt converted to equity in 2006
- $5.6 million of debt converted to equity in 2012.
At 31 December 2012, MPSA's land and buildings were valued at $33.1 million, and it owed $17.8 million in loans to Monash University. On 23 August 2013, the private sector entity purchased MPSA's land and buildings for $30 million.
The land and buildings were revalued to the fair value of the receivable, and MPSA recognised a $1.5 million decrement in its asset revaluation reserve. A foreign exchange movement of $1.6 million was also recognised at the date of sale.
The sale proceeds of $30 million are intended to be used by MPSA to repay Monash University's loan of $17.1 million and contributed capital of $11.6 million. The directors then intend to wind down MPSA's operations and leave the company dormant.
The sale proceeds, together with compound interest on the outstanding amount calculated at 6.75 per cent, are to be paid to MPSA by the private sector entity over four years. The payments were to commence with $5 million in January 2014, followed by $1 million every year thereafter. The balance is payable on 1 January 2019. As at 31 December 2013, none of this amount had been paid to MPSA by the private sector entity.
Monash Educational Enterprises
MEE, the original higher education institution and operator of the campus, has been dormant since 2006, when MSA took over its provision of student educational services. In 2005, MEE owed Monash University $37.6 million in loans. From 2005 to 2013, the loans decreased due to the strengthening of the Australian dollar against the South African Rand, and in 2013 Monash University forgave the outstanding loan of $19.6 million.
3.4.3 Conclusion
From 2001 to 2013 Monash University provided $101.8 million in loans to the three companies associated with its South African campus. During that period $2.6 million was repaid. The companies reported consistent operating deficits, and Monash University wrote off debt balances of $44.7 million.
Arrangements entered into with the private sector entity during 2013 should enable Monash University to recoup $17.1 million of loans advanced to MPSA and receive $10 million as consideration for MSA's operations.
The overall net loss incurred by Monash University in relation to its South African venture from 2001 to 2013 is $60.5 million, inclusive of foreign exchange differences, sale of land and buildings of $30 million and cash consideration of $10 million.
3.5 Subsequent event—transfer of Monash University's Gippsland campus
On 1 January 2014, Monash University transferred its operations at its Gippsland campus for nil consideration to Federation University and implemented arrangements with Federation University for teaching its continuing students.
The sale resulted in a $6.1 million impairment of the associated assets in Monash University's financial report, and a write-back of $108.9 million in its asset revaluation reserve. Employee provisions for the campus staff were converted to a restructuring provision, representing the staged future payout to Federation University in respect of these entitlements.
A further restructuring provision of $19.8 million was recognised for ongoing financial support of the campus, over a two-year transition period.
4 Financial sustainability
At a glance
Background
This Part provides an insight into the financial sustainability of the eight universities based on an analysis of the trends in their key financial indicators over the past five years.
Conclusion
Self-financing indicators have deteriorated across the sector, with three universities in the high-risk category and none in the low-risk category in 2013. The capital replacement indicator decreased during the year as assets were used at a rate greater than they were being replaced. This was largely as a result of higher capital investment in prior periods and greater depreciation costs due to consumption of the new assets.
With continued operating surpluses and low levels of debt, the university sector remains in a relatively healthy financial position. Active management is required, however, given that operating surpluses have continued to decline since 2009.
Findings
- Seven of eight universities have recorded operating surpluses and positive underlying results in each of the past five years. Victoria University was the exception in 2012 but showed improvement in 2013.
- Average operating surpluses have declined from 9.6 per cent of total revenue in 2009 to 5.2 per cent in 2013.
- The proportion of debt to equity has been rated as 'low' for each university over the past five years.
- The self-financing risk for each of the eight universities was assessed as high or medium in 2013, indicating they may be unable to fund asset replacement in future periods from cash generated from their operations.
4.1 Introduction
To be financially sustainable entities need to be able to meet their current and future expenditure as it falls due. They also need to absorb foreseeable changes and financial risks as they materialise.
In this Part insight is provided into the financial sustainability of universities through analysis of five financial sustainability indicators over a five-year period. Appendix D describes the sustainability indicators and risk assessment criteria used in this report.
To form a definitive view of any entity's financial sustainability, a holistic analysis that moves beyond financial indicators would be required, including an assessment of the entity's operations and the regulatory environment in which the entity operates. These additional considerations are not examined in this report.
4.2 Financial sustainability risk assessment
4.2.1 Overall assessment
Overall, the financial sustainability risk assessment for the university sector showed some deterioration in 2013.
Figure 4A shows that the number of universities with a low financial sustainability risk reduced from six in 2012 to five in 2013. The number of universities with a medium-risk rating increased to two in 2013 from one in 2012.
Figure 4A
Two-year financial sustainability risk assessment
|
Entity |
2013 |
2012 |
|---|---|---|
|
Deakin University |
Low |
Low |
|
Federation University |
Medium |
Low |
|
La Trobe University |
Low |
Low |
|
Monash University |
High |
High |
|
Royal Melbourne Institute of Technology University |
Low |
Low |
|
Swinburne University |
Low |
Low |
|
The University of Melbourne |
Low |
Low |
|
Victoria University |
Medium |
Medium |
|
Total |
8 |
8 |
Source: Victorian Auditor-General's Office.
Federation University and Victoria University were assessed as medium risk due to poor self-financing ratios. Monash University was again assessed as high risk due to low liquidity. Monash University, however, had financial assets of $281.8 million that were 'available for sale' which could be converted to cash if required.
4.2.2 Summary of trends in risk assessments over the five‑year period
When the risk assessments for each indicator are analysed they show the following trends over the five years to 2013:
- underlying result—all universities remain in the low-risk category
- liquidity—the position is unchanged, with one university in the high-risk category and one in the medium-risk category
- debt-to-equity—all universities remain in the low-risk category
- self-financing—the position has deteriorated, with three universities in the high‑risk category and none in the low-risk category
- capital replacement—the position has deteriorated, with two universities in the medium-risk category.
Universities have generally recorded poor self-financing indicators, but this position has deteriorated and performance against some of the other indicators has also declined. The trend shows, however, that with generally strong operating surpluses coupled with low levels of debt, overall the university sector remains in a healthy financial position.
4.2.3 Analysis of trends in financial sustainability indicators across the five-year period
To further understand the results we analysed the five-year data for the five indicators. The relevant data, and the basis for calculating the indicators, are reproduced in Appendix D.
All universities have recorded positive underlying result indicators over the past five years, with one exception—Victoria University in 2012, due to high redundancy costs. The magnitude of the surpluses has declined at seven universities over the past five years, with an average surplus of 5.2 per cent in 2013, down from an average of 9.6 per cent in 2009. Only The University of Melbourne reported an improved result in 2013 compared to 2009.
Monash University and the Royal Melbourne Institute of Technology (RMIT) University have consistently recorded lower liquidity indicator results than the sector average. Monash University, however, had financial assets of $281.8 million available for sale at 31 December 2013. While these assets are not included in the calculation of liquidity, they would be available for conversion to cash if required, thereby mitigating the risk of having insufficient funds should debts fall due.
For the remaining six universities, current assets exceeded their short‑term liabilities, meaning sufficient cash was available to fund their day-to-day activities.
Debt-to-equity indicator results are not currently a concern for the sector, with the risk for each university consistently rated as low for this indicator over the past five years.
Universities have generally been in a high- or medium-risk self‑financing position since 2009. Five have failed to record a single risk assessment of low during the five-year period. Some may not be able to fund asset replacement with the cash they generate from operating activities and in the future may need to borrow to replace assets, or reduce asset renewal.
Capital replacement results have declined over the past year. Two universities were assessed as medium risk in 2013, indicating that assets were being consumed at a faster rate, or similar rate, than they were being renewed.
This result needs to be considered in light of the substantial capital works undertaken by Monash University, RMIT and Deakin University and across the sector in recent years. As a result, fewer assets were renewed in 2013, while depreciation increased due to the greater asset base.
4.3 Five-year trend analysis
This section provides analysis and commentary on each indicator's trend for the past five years.
4.3.1 Underlying result
Figure 4B shows the deterioration in the average underlying result for the university sector over the past three years.
Figure 4B
Average underlying result
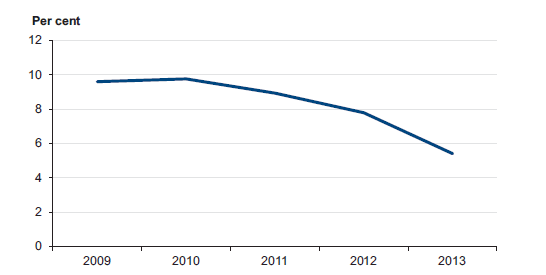
Source: Victorian Auditor-General's Office.
Eight universities generated an operating surplus in 2013 (seven in 2012), with all universities assessed as low risk, notwithstanding a decline in average underlying results. All universities generated an operating surplus in each of the past five years, with the exception of Victoria University in 2012. The rate of decline in underlying results accelerated between 2012 and 2013.
4.3.2 Liquidity
Figure 4C shows that the results of risk assessments of liquidity were stable in 2013.
Figure 4C
Liquidity risk assessment
Source: Victorian Auditor-General's Office.
Six universities have had a low liquidity risk for each of the five years. Monash University has been assessed as high risk and RMIT was assessed as medium risk in each of the past four years. Both of these ratings are consistent with their performance over the past four years. Monash University has financial assets which are accessible for conversion to cash to meet any unexpected short-term commitments, if required.
4.3.3 Debt-to-equity
All universities were assessed as low risk for the five-year period, indicating that they can comfortably meet their debt repayment obligations. Average debt for the sector remained at less than 6 per cent for the period.
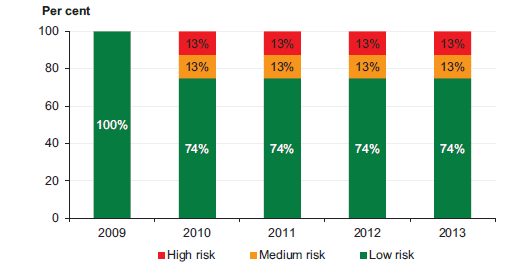
4.3.4 Self-financing
Figure 4D shows that the self-financing risk of the majority of universities has been assessed as medium over the past five years but was relatively stable until 2013, when it declined significantly.
It is particularly concerning that while the proportion of universities in the medium-risk category has remained stable over the five years, there was a significant shift from low risk to high risk during 2013.
Figure 4D
Self-financing risk assessment
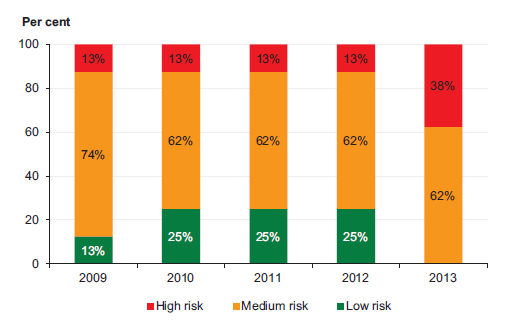
Source: Victorian Auditor-General's Office.
No university reported an improved result for this indicator in 2013 compared to 2012, while the results of three deteriorated. Figure 4E presents the self-financing risk assessments for each of the universities for the past two years.
Figure 4E
Two-year self-financing risk assessment
|
Entity |
2013 |
2012 |
|---|---|---|
|
Deakin University |
Medium |
Low |
|
Federation University |
High |
Low |
|
La Trobe University |
Medium |
Medium |
|
Monash University |
High |
Medium |
|
RMIT University |
Medium |
Medium |
|
Swinburne University |
Medium |
Medium |
|
The University of Melbourne |
Medium |
Medium |
|
Victoria University |
High |
High |
|
Total |
8 |
8 |
Source: Victorian Auditor-General's Office.
Each of the eight universities had a self-financing risk of high or medium in 2013, indicating that they may be unable to fund asset replacement from cash generated from their operations. If these trends continue, some universities may place greater reliance on government funding for asset renewal and replacement.
4.3.5 Capital replacement
Figure 4F shows that 75 per cent or six universities were assessed as having a low capital replacement risk in 2013.
Figure 4F
Capital replacement risk assessment
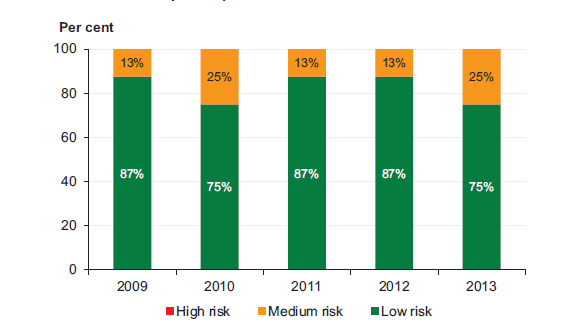
Source: Victorian Auditor-General's Office.
Capital spending has generally exceeded the aggregate depreciation expense over the five-year period. This suggests that asset-related expenditure is generally outstripping asset consumption throughout the sector. This is mainly the result of substantial building and redevelopment works that have been undertaken across the sector over the past three years.
Total expenditure on university capital programs in 2013 decreased by $251.8 million (23.8 per cent), while depreciation increased by $22.7 million (5.3 per cent). This resulted in a decline in the 2013 capital replacement indicator. The higher level of depreciation was in line with the commencement of depreciation on new building assets completed in late 2012 or early 2013.
Victoria University and RMIT were assessed as medium risk in 2013, mainly flowing from the capitalisation of substantial new building works in recent years and the resulting increase in depreciation charges.
5 Internal controls
At a glance
Background
This Part presents the results of our reviews of the procurement practices and financial policies and delegations in the university sector.
Conclusion
Each of the eight universities had established policies and procedures relating to procurement that complied with their enabling legislation and were in line with government policies and guidelines. Documented policies and procedures were in place for key financial activities at universities, however, these would benefit from a review against the better practice framework.
Findings
- While post-tender evaluations were generally completed, five universities did not set time lines for the completion of these reviews, delaying the opportunity to identify areas for improvement.
- Risks associated with procurement activities at four universities and financial policies and delegations at three universities had not been identified in the risk register.
Recommendation
That universities continue to review their financial policies on a timely basis and ensure that the key elements of the better practice framework are addressed.
5.1 Introduction
Comprehensive internal controls help entities to reliably and cost-effectively meet their objectives. Reliable internal controls are a prerequisite for the delivery of accurate and timely external and internal financial reports.
In our annual audits we focus on the internal controls relating to financial reporting and assess whether entities have managed the risk that the financial statements may not be complete and accurate. Poor internal controls diminish management's ability to achieve their entity's objectives and comply with relevant legislation. They also increase the risk of fraud and error.
The governing body of each university is responsible for developing and maintaining internal controls that enable:
- preparation of accurate financial reports and other supporting information
- timely and reliable external and internal reporting
- appropriate safeguarding of assets
- prevention and detection of errors and irregularities.
The enabling legislation for each of the eight universities requires management to implement effective internal control structures.
In this Part we report on aspects of internal controls in the state's eight universities covering procurement and financial policies and delegations.
5.2 Procurement
Universities are required to implement and maintain an effective internal control framework for procurement. The internal control framework should ensure that procurement satisfies an entity's business needs, is suitably authorised, is in line with policies and procedures, and is consistent with the principles of value for money, open and fair competition, accountability, risk management, probity and transparency. Poor procurement practices give rise to the risk of:
- the procurement process being unfair or not transparent
- inadequate supplier competition resulting in reduced value for money
- suppliers and universities facing unnecessary transaction costs
- universities purchasing inferior goods, services or assets that do not meet their operating objectives.
Victoria's universities spent $2.0 billion on the procurement of goods and services and incurred capital expenditure of $844 million in 2013.
5.2.1 Procurement management framework
The key elements of an effective procurement management function are detailed in Figure 5A. The framework draws upon the:
- Victorian Auditor-General's Office guide Public Sector Procurement: Turning Principles into Practice
- Standing Directions of the Minister for Finance under the Financial Management Act 1994 (FMA)
- Victorian Government Purchasing Board policies.
Figure 5A
Key elements of an effective procurement framework
|
Key area |
Best practice criteria |
|---|---|
|
Policies |
Procurement and tendering policies exist and:
Policy approved by the board. |
|
Management practices |
Probity plan developed for all high-value, high-risk or complex procurements. Conflicts of interest, actual or perceived, identified and managed. Evaluation plan clearly documented and specifies panel member responsibilities. Probity auditor required for complex procurement or procurements over $10 million. Tender evaluation criteria established and submissions evaluated. Documented evidence of tender evaluations maintained. Post tender evaluations conducted. Long-term contracts periodically assessed for value for money. Comprehensive and regular reporting to executive and board. |
|
Governance and oversight |
Compliance with procurement policy and government requirements monitored. Procurement risks included in the entity's risk register and managed. Board authorisation and oversight of probity plans for all high-value, high-risk or complex procurement. Monitoring of procurement performance and the results of significant tenders. Internal audit periodically engaged to review procurement activities. Policies reviewed periodically and changes approved by the board. |
Source: Victorian Auditor-General's Office.
The above elements were considered in our assessment of the procurement function at each of the eight universities.
The procurement frameworks of all universities were generally sound. All had policies in place, probity plans were developed for high-value, high-risk or complex procurements and management monitoring practices were comprehensive and thorough. Improvements can be made by placing more attention on post-tender evaluations and risk identification.
5.2.2 Policies
Each of the eight universities had policies and procedures relating to procurement that complied with their enabling legislation and were in line with government policies and guidelines. The policies and procedures generally included:
- an objective
- preferred suppliers
- arrangements for purchases on corporate cards
- probity provisions and the requirement to avoid any actual or perceived bias
- tender requirements
- arrangements for obtaining quotations.
Procurement policies were current and had been reviewed within the past three years at all but one university.
5.2.3 Management practices
Management at each of the eight universities adequately oversee procurement activities.
Better practice involves the preparation of probity plans for procurement with a value in excess of $10 million. All eight universities had procedures in place to prepare probity plans for high-value, high-risk or complex procurement activities. Probity auditors were also regularly engaged at seven of the eight universities to make sure appropriate procurement protocols were undertaken.
Seven of the eight universities required tender evaluation criteria to be set for each tender and provided guidance material for evaluations, and all eight universities required staff involved in the tender process to declare any conflicts of interest.
Post-tender evaluations enable those involved to review the processes undertaken and identify areas for improvement. While post-tender evaluations were regularly completed, only three universities set time lines for the completion of these evaluations, with the remainder delaying the opportunity to identify areas for improvement.
Management monitoring of procurement appeared sound, with all universities periodically assessing long-term purchasing arrangements to confirm adequacy of performance and value for money.
Universities regularly generated reports to brief senior management, the board or other committees on the status of high-value, high-risk or complex procurement activities, including commitments for expenditure.
5.2.4 Governance and oversight
The governing board is responsible for an entity's overall procurement framework, including risk identification, monitoring and oversight. At most universities, the council had delegated this responsibility to a subcommittee of the council. The subcommittee was typically required to review and sign-off on key decisions made by management, particularly in relation to procurement activities of high risk, complexity or value.
The entity's audit committee may be used to review an entity's compliance with regulatory requirements and established policies and procedures, and to provide assurance on the integrity of the tender process.
Oversight of procurement at council and senior management level was generally sound, with procurement policies routinely approved, compliance monitored and results of significant tender outcomes reported.
Procurement policies, procedures and internal controls had been subject to internal audit review at all eight universities within the past three years.
We found that improvements could be made in the area of risk identification, as risks associated with procurement activities had not been identified in the risk register of four of the eight universities.
5.2.5 Procurement contract testing
To confirm the operations of procurement controls we selected one contract above $200 000 entered into during the financial year at each of the eight universities. The total value of contracts tested was $8.6 million.
There was significant variation in the level of detail provided in procurement plans, particularly around business cases and options for achieving the desired outcomes, as many of the contracts reviewed were for ongoing core services.
Reviewed tender evaluation plans were generally comprehensive, detailing the tenders received, the assessment process, criteria, scoring and a rationale for selecting the preferred tender.
A post-tender evaluation had been performed for four of the eight procurement contracts reviewed. Universities could miss opportunities to identify lessons learnt and improve tender processes and procedures where post-tender evaluations are not routinely conducted.
Probity plans were not developed for six of the tenders reviewed and probity auditors were not engaged for any of the tenders, as they did not satisfy the requisite high-risk, high-value or complexity criteria.
Ongoing contractor performance was monitored post completion of the procurement processes for all eight contracts reviewed.
5.3 Financial policies and delegations
Financial policies and delegations set the framework for the internal control environment. Without them, the risk of unauthorised and inappropriate transactions increases.
Universities are required to establish effective financial policies and delegations. These policies should cover core financial activities, including revenue and debtor management, expenditure and creditor management, asset management and payroll. A register of financial delegations is required to be established that sets out which staff are authorised to incur expenditure on behalf of the entity, and to what amount.
5.3.1 Financial policies and delegations framework
The key elements of an effective financial policies and delegations framework are detailed in Figure 5B. The framework draws upon the Standing Directions of the Minister for Finance under the FMA.
Figure 5B
Key elements of an effective financial policies and delegations framework
|
Component |
Key elements |
|---|---|
|
Policy |
Financial policies Financial policies established for key financial operations, including:
Policies are comprehensive and address core aspects of financial management procedures. Relevant legislation, applicable government guidelines and other government policy requirements addressed. Policies include requirements for periodic review and approval by the council. Financial delegations Clear financial delegations given to specific positions. Register of financial delegations established and includes:
Arrangements for updating the register of financial delegations upon substantial change in duties or position. Financial delegations approved by the council. |
|
Management practices |
Quality assurance mechanisms established for monitoring policy compliance. Induction training on financial policies provided for new staff as appropriate. Register of financial delegations centrally maintained and periodically reviewed. Financial policies periodically reviewed. |
|
Governance and oversight |
Risks associated with financial policies and delegation arrangements included in the entity's risk register and managed. Internal audit periodically engaged to review compliance with financial policies and delegation requirements. Financial policies periodically reviewed and changes approved by the Council. Updates to the register of financial delegations approved by the council. |
Source: Victorian Auditor-General's Office.
The key elements were considered in our assessment of the financial policies and delegations of the eight universities.
Overall we found that documented policies existed across the university sector and financial delegations were clear and established, and monitoring was sound. Improvements could be made, however, in relation to governance and oversight.
5.3.2 Policies
Most universities had documented policies and procedures for their key financial processes—revenue and debtor management, expenditure and creditor management, asset management and payroll activities. Federation University had not established policies for expenditure and creditor management or payroll activities. There is an opportunity for this university to strengthen its internal control environment by implementing these key policies, to reduce the risk that transactions processed may not be complete, accurate or valid.
Polices generally addressed the key elements of the framework. There was, however, room for improvement in the following areas that were not addressed at the majority of universities:
- arrangements for avoiding duplicate vendor payments
- maintenance of the creditor masterfile
- establishing segregation of duties between key payroll functions.
Financial policies were current and had been reviewed within the past three years at all but one university.
5.3.3 Financial delegations
All universities had a register of financial delegations that listed all staff and positions holding financial authority along with delegation limits for specific transaction/authorisation types.
Improvements could be made as only four of eight universities had mechanisms to deal with absences of delegates and to update delegations upon changes in personnel or positions.
All universities had updated their registers within the past 12 months.
5.3.4 Management practices
Monitoring of policy compliance was undertaken by management at each of the eight universities. This was generally achieved through the use of internal audit.
All universities maintained their register of financial delegations centrally, to maintain version control and ensure that changes were made only in accordance with the instrument of delegation. Six universities demonstrated better practice by establishing information technology security controls that set financial delegation limits in their electronic payment systems.
Alternate mechanisms had been established at all universities to deal with conflicts of interest relating to delegates, or other instances where a delegate would benefit from exercising their financial delegation.
5.3.5 Governance and oversight
Oversight and monitoring of policy compliance and financial delegations registers was generally conducted at the management level. Councils at five universities reviewed changes to the register of financial delegations, with this function executed at the Vice‑Chancellor level at the remaining three.
Improvement is needed in relation to risk identification and management, with three of eight universities failing to identify and address specific risks associated with financial policies and delegations in their risk registers. This demonstrates a lack of high-level attention given to these important areas.
Financial policies and delegation arrangements had been subject to internal audit at seven of eight universities in the past three years. The remaining university has scheduled a review of these arrangements in its 2014 internal audit plan.
Recommendation
- That universities continue to review their financial policies on a timely basis and ensure that the key elements of the better practice framework are addressed.
Appendix A. VAGO reports on the results of financial audits
Figure A1
VAGO reports on the results of the 2012–13 financial audits
|
Report |
Description |
|---|---|
|
Auditor-General's Report on the Annual Financial Report of the State of Victoria, 2012–13 |
This report provides the result of the audit of the state's annual financial report. It addresses the quality and timing of financial reporting, explains significant financial results for the state and financial implications of significant projects and developments that occurred during 2012–13. Tabled in Parliament in November 2013. |
|
Portfolio Departments and Associated Entities: Results of the 2012–13 Audits |
The report provides the results of the audits of 208 entities. The report addresses their financial reporting, financial sustainability and reporting development, the use of contractors and temporary staff, and management of business continuity and information technology disaster recovery planning. Tabled in Parliament in November 2013. |
|
Public Hospitals: Results of the 2012–13 Audits |
The report provides the results of the audits of 112 entities in the public hospital sector. It addresses their financial performance, financial sustainability and management of private patient fees and risk. Tabled in Parliament in November 2013. |
|
Local Government: Results of the 2012–13 Audits |
The report provides the results of the audits of 102 entities in the local government sector. The report addresses their financial and performance reporting, financial sustainability, aspects of how they manage rate revenue and the operation of audit committees. Tabled in Parliament in December 2013. |
|
Water Entities: Results of the 2012–13 Audits |
This report provides the results of the audits of 20 entities in the water sector. The report addresses their financial and performance reporting, and financial sustainability, and comments on internal controls relating to information technology security and change management, procurement and treasury management. Tabled in Parliament in December 2013. |
|
Universities: Results of the 2013 Audits This report |
This report presents the results of audits of 64 entities in the university sector. The report addresses their financial reporting, financial sustainability and internal controls relating to procurement, financial policies and financial delegations. Tabled in Parliament in May 2014. |
|
Technical and Further Education Institutes: Results of the 2013 Audits |
This report presents the results of audits of 27 entities in the technical and further education (TAFE) sector. The report addresses their financial reporting, financial sustainability and internal controls relating to procurement, financial policies and financial delegations. To be tabled in Parliament in June 2014. |
Source: Victorian Auditor-General's Office.
Appendix B. Completed audit listing
Universities and associated entities
|
Entity |
Audit type |
Financial statements |
Timeliness of financial statements completion |
||||
|---|---|---|---|---|---|---|---|
|
FMA |
Non-FMA |
Clear opinion |
Opinion date |
Up to 12 weeks |
12 to 18 weeks |
More than 18 weeks |
|
|
COMPLETED AUDITS – 31 DECEMBER 2013 BALANCE DATE |
|||||||
|
Deakin University Reason for qualification: Grant income recognised as liability rather than as income as required by Australian Accounting Standard AASB 1004 Contributions. |
Yes |
No |
21-Mar-14 |
Yes |
|||
|
Callista Software Services Pty Ltd |
Yes |
Yes |
17-Feb-14 |
Yes |
|||
|
Deakin Digital Pty Ltd |
Yes |
Yes |
27-Feb-14 |
Yes |
|||
|
Deakin Residential Services Pty Ltd |
Yes |
Yes |
25-Feb-14 |
Yes |
|||
|
Unilink Limited |
Yes |
Yes |
25-Feb-14 |
Yes |
|||
|
Federation University(a) |
Yes |
Yes |
21-Feb-14 |
Yes |
|||
|
Datascreen Pty Ltd |
Yes |
Yes |
05-Mar-14 |
Yes |
|||
|
Inskill Pty Ltd |
Yes |
Yes |
05-Mar-14 |
Yes |
|
||
|
The School of Mines and Industries Ballarat Limited |
Yes |
Yes |
05-Mar-14 |
Yes |
|
||
|
UB Housing Pty Ltd |
Yes |
Yes |
26-Mar-14 |
Yes |
|||
|
La Trobe University |
Yes |
Yes |
13-Mar-14 |
Yes |
|||
|
La Trobe Accommodation Services Pty Ltd |
Yes |
Yes |
04-Apr-14 |
Yes |
|||
|
La Trobe International Pty Ltd |
Yes |
Yes |
04-Apr-14 |
Yes |
|||
|
Medical Centre Development Pty Ltd |
Yes |
Yes |
04-Apr-14 |
Yes |
|||
|
Monash University |
Yes |
Yes |
21-Mar-14 |
Yes |
|||
|
Australian Regenerative Medicine Institute Joint Venture |
Yes |
Yes |
07-May-14 |
Yes |
|||
|
GNUCO Pty Ltd |
Yes |
Yes |
18-Feb-14 |
Yes |
|||
|
Monash Accommodation Services Pty Ltd |
Yes |
Yes |
27-Feb-14 |
Yes |
|||
|
Monash College Pty Ltd |
Yes |
Yes |
19-Feb-14 |
Yes |
|||
|
Monash Commercial Pty Ltd |
Yes |
Yes |
26-Feb-14 |
Yes |
|||
|
Monash Custodians Pty Ltd |
Yes |
Yes |
07-May-14 |
Yes |
|||
|
Monash Health Research Precinct Pty Ltd |
Yes |
Yes |
03-Mar-14 |
Yes |
|||
|
Monash Educational Enterprises |
Yes |
Yes |
17-Feb-14 |
Yes |
|||
|
Monash Investment Holdings Pty Ltd |
Yes |
Yes |
26-Feb-14 |
Yes |
|||
|
Monash Investment Trust |
Yes |
Yes |
26-Feb-14 |
Yes |
|||
|
Monash Property South Africa Pty Ltd |
Yes |
Yes |
14-Mar-14 |
Yes |
|||
|
Monash South Africa Ltd |
Yes |
Yes |
21-Mar-14 |
Yes |
|||
|
Monash University Foundation |
Yes |
Yes |
07-Mar-14 |
Yes |
|||
|
Monash University Foundation Pty Ltd |
Yes |
Yes |
06-Mar-14 |
Yes |
|||
|
Royal Melbourne Institute of Technology University |
Yes |
|
Yes |
05-Mar-14 |
Yes |
||
|
RMIT Foundation |
Yes |
Yes |
17-Feb-14 |
Yes |
|||
|
RMIT International University Vietnam |
Yes |
Yes |
05-Mar-14 |
Yes |
|||
|
RMIT Training Pty Ltd |
Yes |
Yes |
20-Feb-14 |
Yes |
|||
|
RMIT Vietnam Holdings Pty Ltd |
Yes |
Yes |
05-Mar-14 |
Yes |
|||
|
Spatial Vision Innovations Pty Ltd |
Yes |
Yes |
10-Feb-14 |
Yes |
|||
|
Swinburne University of Technology |
Yes |
Yes |
18-Mar-14 |
Yes |
|||
|
National Institute of Circus Arts Limited |
Yes |
Yes |
06-Mar-14 |
Yes |
|||
|
Swinburne College Pty Ltd |
Yes |
Yes |
06-Mar-14 |
Yes |
|||
|
Swinburne Intellectual Property Trust |
Yes |
Yes |
06-Mar-14 |
Yes |
|||
|
Swinburne Ltd |
Yes |
Yes |
06-Mar-14 |
Yes |
|||
|
Swinburne Student Amenities Association Ltd |
Yes |
Yes |
06-Mar-14 |
Yes |
|||
|
Swinburne Ventures Limited |
Yes |
Yes |
06-Mar-14 |
Yes |
|||
|
The University of Melbourne Reason for qualification: Grant income recognised as liability rather than as income as required by Australian Accounting Standard AASB 1004 Contributions. |
Yes |
No |
21-Mar-14 |
Yes |
|||
|
Australian Music Examinations Board (Vic) Ltd |
Yes |
Yes |
04-Apr-14 |
Yes |
|||
|
Melbourne Business School Foundation Trust |
Yes |
Yes |
17-Mar-14 |
Yes |
|||
|
Melbourne Business School Foundation Ltd |
Yes |
Yes |
17-Mar-14 |
Yes |
|||
|
Melbourne Business School Ltd |
Yes |
Yes |
17-Mar-14 |
Yes |
|||
|
Melbourne Dental Clinic Ltd |
Yes |
Yes |
24-Apr-14 |
Yes |
|||
|
Melbourne University Publishing Ltd |
Yes |
Yes |
24-Apr-14 |
Yes |
|||
|
Mount Eliza Graduate School of Business and Government Limited |
Yes |
Yes |
17-Mar-14 |
Yes |
|||
|
MU Student Union Ltd |
Yes |
Yes |
2-May-14 |
Yes |
|||
|
Nossal Institute Limited |
Yes |
Yes |
04-Apr-14 |
Yes |
|||
|
UM Commercialisation Pty Ltd |
Yes |
Yes |
04-Apr-14 |
Yes |
|||
|
UM Commercialisation Trust |
Yes |
Yes |
04-Apr-14 |
Yes |
|||
|
UoM Commercial Ltd |
Yes |
Yes |
04-Apr-14 |
Yes |
|||
|
Victoria University |
Yes |
Yes |
19-Mar-14 |
Yes |
|||
|
Victoria University Enterprises Pty Ltd |
Yes |
Yes |
19-Mar-14 |
Yes |
|||
|
Victoria University Foundation |
Yes |
Yes |
19-Mar-14 |
Yes |
|||
|
Victoria University Foundation Ltd |
Yes |
Yes |
19-Mar-14 |
Yes |
|||
|
Victoria University International Pty Ltd |
Yes |
Yes |
19-Mar-14 |
Yes |
|||
|
Victoria University of Technology (Singapore) Pty Ltd |
Yes |
Yes |
19-Mar-14 |
Yes |
|||
|
2013 Total |
14 |
47 |
47 |
12 |
2 |
||
|
61 |
|||||||
|
2012 Total |
14 |
48 |
58 |
0 |
0 |
||
|
62 |
|||||||
|
INCOMPLETE AUDITS – 14 MAY 2014 |
|||||||
|
Australian National Academy of Music Ltd |
Yes |
Signed financial statements yet to be received |
|||||
|
Australian National Academy of Music Foundation Ltd |
Yes |
|
Signed financial statements yet to be received |
||||
|
UMELB Pty Ltd (Singapore) |
Yes |
|
30 June 2014 financial year end |
||||
|
2013 Total |
0 |
3 |
|
||||
|
|
3 |
|
|||||
|
2012 Total |
0 |
2 |
|
||||
|
|
2 |
|
|||||
(a) Formerly University of Ballarat.
Note: 'FMA' refers to Financial Management Act 1994.
Appendix C. Financial audit frameworks
The financial audit framework applied in the conduct of the 2013 audits covered by this report is set out in Figure C1.
Figure C1
Financial audit framework
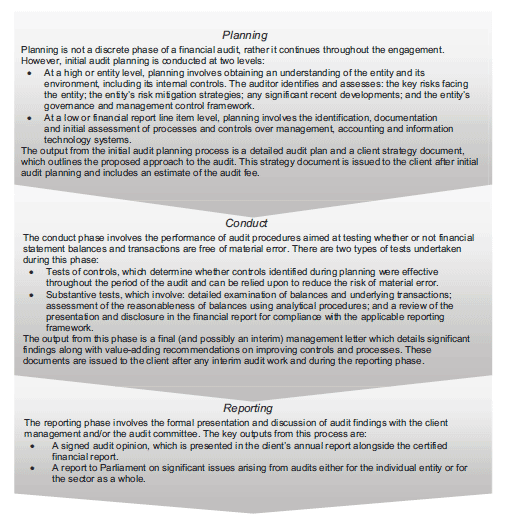
Source: Victorian Auditor-General's Office.
Internal control framework
Figure C2 identifies the main components of an effective internal control framework.
Figure C2 Components of an internal control framework
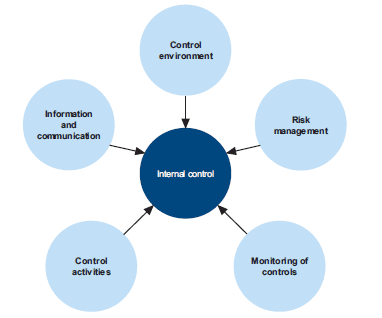
Source: Victorian Auditor-General's Office.
In the diagram:
- the control environment provides the fundamental discipline and structure for the controls and includes governance and management functions and the attitudes, awareness, and actions of those charged with governance and management of an entity
- risk management involves identifying, analysing and mitigating risks
- monitoring of controls involves observing the internal controls in practice and assessing their effectiveness
- control activities are policies, procedures and practices prescribed by management to help meet an entity's objectives
- information and communication involves communicating control responsibilities throughout the entity and providing information in a form and time frame that allows officers to discharge their responsibilities.
Financial report preparation
Our assessment of financial reporting performance against better practice was based on criteria outlined in Figure C3.
Figure C3
Financial report preparation better practice
|
Key area |
Better practice |
|---|---|
|
Financial report preparation plan |
Establish a plan that outlines the processes, resources, milestones, oversight, and quality assurance practices required in preparing the financial report. |
|
Preparation of shell statements |
Prepare a shell financial report and provide it to the auditors early to enable early identification of amendments, minimising the need for significant disclosure changes at year-end. |
|
Materiality assessment |
Assess materiality, including quantitative and qualitative thresholds, at the planning phase in consultation with the audit committee. The assessment assists preparers to identify potential errors in the financial report. |
|
Monthly financial reporting |
Adopt full accrual monthly reporting to assist in preparing the annual financial report. This allows the year-end process to be an extension of the month-end process. |
|
Quality control and assurance procedures |
Require rigorous review of the supporting documentation, data and the financial report itself by an appropriately experienced and independent officer prior to providing it to the auditors. |
|
Supporting documentation |
Prepare high-standard documentation to support and validate the financial report and provide a management trail. |
|
Analytical reviews |
Undertake rigorous and objective analytical review during the financial report preparation process to help to improve the accuracy of the report. |
|
Reviews of controls/ self-assessment |
Establish sufficiently robust quality control and assurance processes to provide assurance to the audit committee on the accuracy and completeness of the financial report. |
|
Competency of staff |
The preparers of the financial report have a good understanding of, and experience in, applying relevant accounting standards and legislation. They also have effective project management and interpersonal skills. |
|
Financial compliance reviews |
Undertake periodic compliance reviews to identify areas of noncompliance or changes to legislation that impact the financial report. |
|
Adequate security |
Protect and safeguard sensitive information throughout the process to prevent inappropriate public disclosure. |
Source: Victorian Auditor-General's Office, and Australian National Audit Office Better Practice Guide Preparation of Financial Statements by Public Sector Entities, June 2009.
Appendix D. Financial sustainability indicators and criteria
|
Indicator |
Formula |
Description |
|---|---|---|
|
Underlying result (%) |
Adjusted net surplus / Total underlying revenue |
A positive result indicates a surplus, and the larger the percentage, the stronger the result. A negative result indicates a deficit. Operating deficits cannot be sustained in the long term. Underlying revenue does not take into account one-off or non‑recurring transactions. Net result and total underlying revenue is obtained from the comprehensive operating statement and is adjusted to take into account large one-off (non-recurring) transactions. |
|
Liquidity (ratio) |
Current assets / Current liabilities |
This measures the ability to pay existing liabilities in the next 12 months. A ratio of one or more means there are more cash and liquid assets than short-term liabilities. Current liabilities exclude long-term employee provisions and revenue in advance. |
|
Debt-to-equity (%) |
Debt / Equity |
This is a longer-term measure that compares all current and non-current interest bearing liabilities to equity. It complements the liquidity ratio, which is a short-term measure. A low ratio indicates less reliance on debt to finance the capital structure of an organisation. |
|
Self-financing (%) |
Net operating cash flows / Underlying revenue |
Measures the ability to replace assets using cash generated by the entity's operations. The higher the percentage the more effectively this can be done. Net operating cash flows are obtained from the cash flow statement. |
|
Capital replacement (ratio) |
Cash outflows for property, plant and equipment and intangibles / Depreciation and amortisation |
Comparison of the rate of spending on infrastructure, property, plant and equipment and intangibles with their depreciation and amortisation. Ratios higher than 1:1 indicate that spending is faster than the depreciating rate. This is a long-term indicator, as capital expenditure can be deferred in the short term if there are insufficient funds available from operations, and borrowing is not an option. Cash outflows for infrastructure, property, plant and equipment and intangibles are taken from the cash flow statement. Depreciation and amortisation is taken from the comprehensive operating statement. |
Source: Victorian Auditor General's Office.
These indicators should be considered collectively, and are more useful when assessed over time as part of a trend analysis. These indicators have been applied to the published financial information of universities for the period from 2009 to 2013.
The analysis of financial sustainability in this report reflects on the position of each individual entity and on the university sector. The financial sustainability indicators used in this report are consistent with those used in previous reports to Parliament, and are indicative of the financial sustainability of universities.
Financial sustainability risk assessment criteria
The financial sustainability of each university has been assessed using the risk criteria outlined in Figure D2.
Figure D2
Financial sustainability indicators – risk assessment criteria
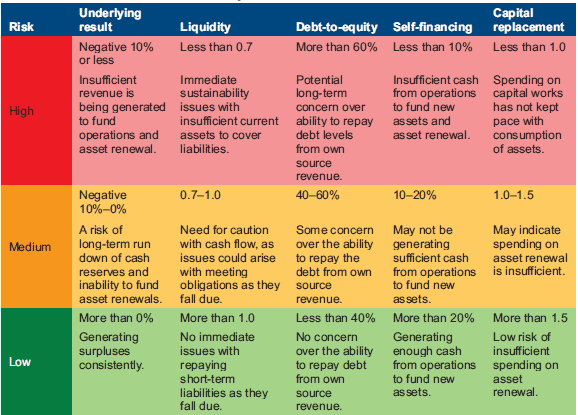
Source: Victorian Auditor-General's Office.
The overall financial sustainability risk assessment has been calculated using the ratings determined for each indicator as outlined in Figure D3.
Figure D3
Overall financial sustainability risk assessment
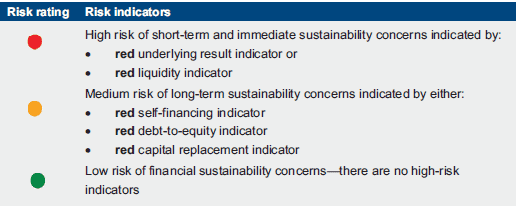
Source: Victorian Auditor-General's Office.
Financial sustainability trend key:
▲= Improving trend
▼= Deteriorating trend.
Universities
Five-year mean
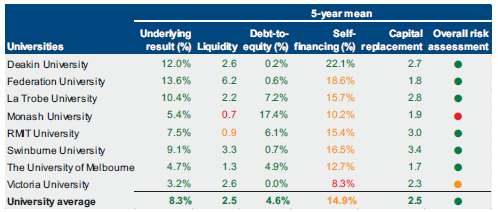
Source: Victorian Auditor-General's Office.
Underlying result
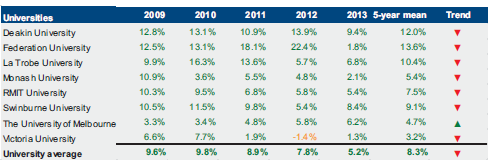
Source: Victorian Auditor-General's Office.
Liquidity
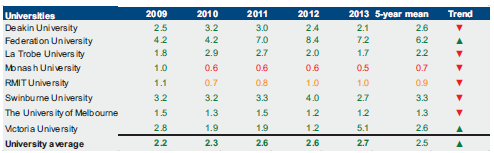
Source: Victorian Auditor-General's Office.
Debt-to-equity
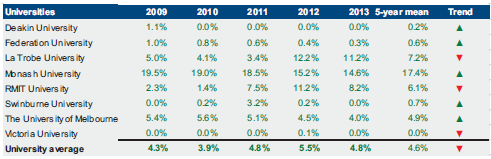
Source: Victorian Auditor-General's Office.
Self-financing
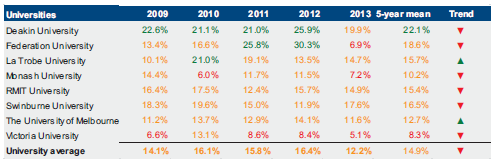
Source: Victorian Auditor-General's Office.
Capital replacement
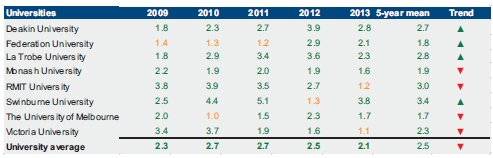
Source: Victorian Auditor-General's Office.
Appendix E. Glossary
Accountability
Responsibility of public sector entities to achieve their objectives, with regard to reliability of financial reporting, effectiveness and efficiency of operations, compliance with applicable laws, and reporting to interested parties.
Amortisation
The systematic allocation of the depreciable amount of an intangible asset over its expected useful life.
Asset
A resource controlled by an entity as a result of past events, and from which future economic benefits are expected to flow to the entity.
Asset useful life
An asset's useful life is the period over which it is expected to provide the entity with economic benefits. Depending on the nature of the asset, the useful life can be expressed in terms of time or output.
Audit Act 1994
The Audit Act 1994 establishes the operating powers and responsibilities of the Auditor-General. This includes the operations of his office—the Victorian Auditor‑General's Office (VAGO)—as well as the nature and scope of audits conducted by VAGO.
Auditor's opinion
Written expression within a specified framework indicating the auditor's overall conclusion on the financial (and performance) reports based on audit evidence obtained.
Capital expenditure
Amount capitalised to the balance sheet for contributions by a public sector entity to major assets owned by the entity, including expenditure on:
- capital renewal of existing assets that returns the service potential or the life of these assets
- expenditure on new assets, including buildings, infrastructure, plant and equipment.
Clear audit opinion – financial report
A positive written expression provided when the financial report has been prepared and presents fairly the transactions and balances for the reporting period in accordance with the requirements of the relevant legislation and Australian Accounting Standards.
Also referred to as an unqualified audit opinion.
Competitive neutrality
Competitive neutrality is about ensuring that the significant business activities of publicly owned entities compete fairly in the market when it is in the public interest for them to do so.
Corporations Act 2001
The Corporations Act 2001 is an act of the Commonwealth of Australia that sets out the laws dealing with business entities in Australia at federal and state levels. It focuses primarily on companies, although it also covers some laws relating to other entities such as partnerships and managed investment schemes.
Depreciation
The systematic allocation of the value of an asset over its expected useful life.
Employee benefits provision
The liability recognised for employees' accrued service entitlements, including all accrued costs related to employment, comprising of wages and salaries, leave entitlements, redundancy payments and superannuation contributions.
Emphasis of matter
An auditor's report can include an emphasis of matter paragraph that draws attention to a disclosure or item in the financial report that is relevant to the users of the auditor's report but is not of such nature that it affects the auditor's opinion—i.e. the auditor's opinion remains unmodified.
Entity
Is a body, whether corporated or unincorporated, that has a public function to exercise on behalf of the state or is wholly owned by the state, including departments, statutory authorities, statutory corporations and government business enterprises.
Equity or net assets
Residual interest in the assets of an entity after deduction of its liabilities.
Expense
Outflows or other depletions of economic benefits in the form of incurred liabilities or depletion of assets of the entity.
Fair value
The amount for which a financial or non-financial asset could be exchanged between knowledgeable and willing parties in an arm's-length transaction.
Financial delegation
A schedule that specifies the level or approval required for each transaction category to facilitate the execution of functions necessary for the efficient operation of the entity.
Financial reporting direction
Financial reports are prepared in accordance with Australian Accounting Standards and Interpretations as issued by the Australian Accounting Standards Board (AASB). When an AASB standard provides accounting treatment options, the Minister for Finance issues financial reporting directions to ensure consistent application of accounting treatment across the Victorian public sector in compliance with that particular standard.
Financial sustainability
An entity's ability to manage financial resources so it can meet spending commitments, both at present and into the future.
Financial year
A period of 12 months for which a financial report (and performance report) is prepared.
Going concern
An entity which is expected to be able to pay its debts as and when they fall due, and continue in operation without any intention or necessity to liquidate or otherwise wind up its operations.
Internal audit
A function of an entity's governance framework that examines and reports to management on the effectiveness of risk management, control and governance processes.
Internal control
Internal control is a means by which an entity's resources are directed, monitored and measured. It plays an important role in preventing and detecting error and fraud and protecting the entity's resources.
Liability
A present obligation of the entity arising from past events, the settlement of which is expected to result in an outflow from the entity of resources embodying economic benefits.
Masterfile
A database of records pertaining to one of the main subjects of an information system, such as customers, employees and vendors. Masterfiles contain descriptive data that does not often change, such as name, address and bank account details.
Materiality
Information is material if its omission or misstatement could influence the economic decisions of users taken on the basis of the financial report. Materiality depends on the size or nature of the item or error judged in the particular circumstances of its omission or misstatement.
Net result
The net result is calculated by subtracting an entity's total expenses from the total revenue, to show what the entity has earned or lost in a given period of time.
Non-reciprocal
Transfers in which an entity receives assets without directly giving equal value in exchange to the other party to the transfer.
Qualified audit opinion – financial report
A qualification is issued when the auditor concludes that an unqualified opinion cannot be expressed due to one of the following reasons:
- existence of a quantifiable or qualitative material error
- disagreement with those charged with governance
- conflict between applicable financial reporting frameworks
- limitation of scope.
A qualified opinion shall be expressed as being unqualified except for the effects of the matter to which the qualification relates.
Relevant
Measures or indicators used by an entity are relevant if they have a logical and consistent relationship to an entity's objectives and are linked to the outcomes to be achieved.
Revaluation
Recognising a reassessment of values for non-current assets—in particular land and buildings—at a point in time.
Revenue
Inflows of funds or other enhancements or savings in outflows of service potential, or future economic benefits in the form of increases in assets or reductions in liabilities of the entity, other than those relating to contributions by owners which result in an increase in equity during the reporting period.
Risk
The chance of a negative impact on the objectives, outputs or outcomes of the entity.
University sector
University sector refers to the eight universities and the 56 subsidiary entities they control.
VET
VET relates to the provision of vocational education and training services, in the context of technical and further education components of the dual-sector universities.
Appendix F. Audit Act 1994 section 16—submissions and comments
Introduction
In accordance with section 16(3) of the Audit Act 1994, relevant extracts from the report were provided to all universities, the Department of Treasury and Finance and the Department of Education and Early Childhood Development with a request for submissions or comments.
The submission and comments provided are not subject to audit nor the evidentiary standards required to reach an audit conclusion. Responsibility for the accuracy, fairness and balance of those comments rests solely with the agency head.
RESPONSE provided by the Secretary, Department of Education and Early Childhood Development
RESPONSE provided by the Secretary, Department of Education and Early Childhood Development – continued