Effectiveness of Arterial Road Congestion Initiatives
Audit snapshot
What we examined
We assessed the effectiveness of arterial road congestion initiatives in managing traffic congestion.
Agencies examined: Department of Transport and Planning (the department) and the Victorian Infrastructure Delivery Authority (the authority).
Why this is important
Melbourne’s population has increased more than any other Australian city, and its transport needs are also increasing.
In 2015 congestion cost $4.6 billion. Infrastructure Victoria estimated that cost would climb to $10.2 billion by 2030.
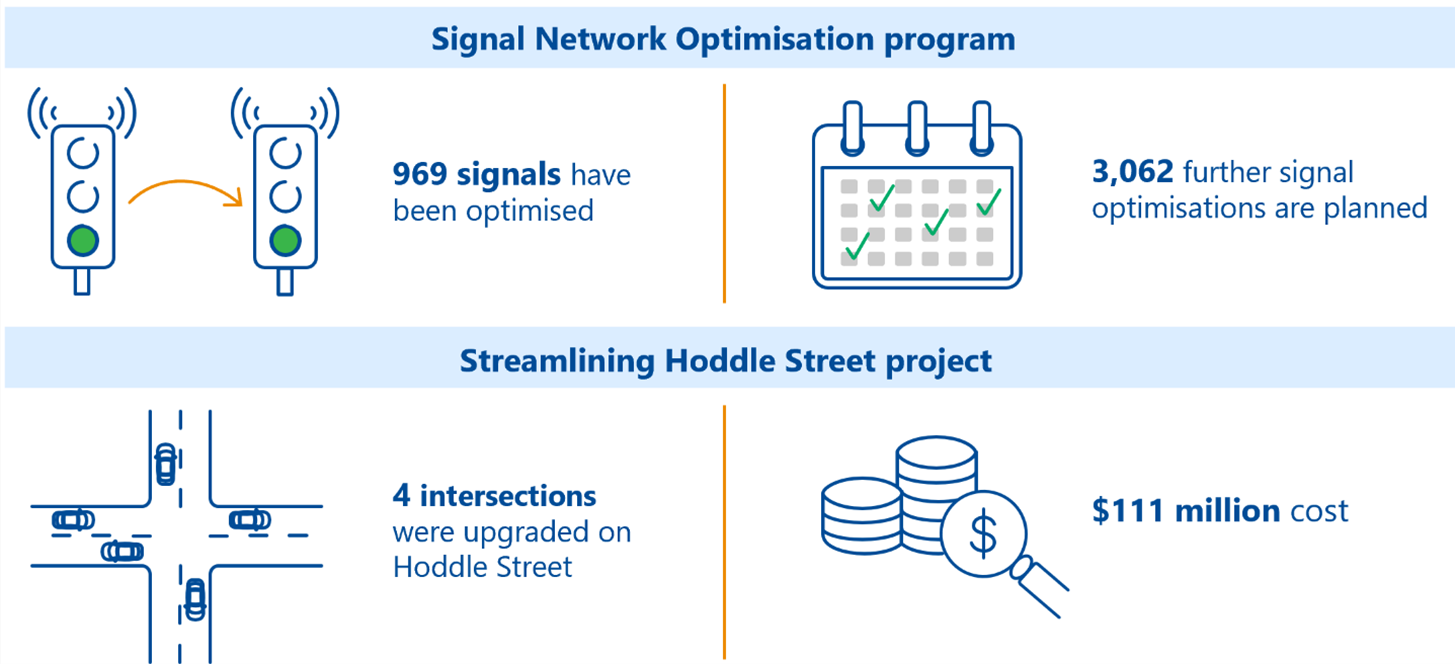
We looked at 2 of the government's initiatives to relieve traffic congestion:
- the Signal Network Optimisation program, delivered by the department
- the Streamlining Hoddle Street project, delivered by VicRoads and the authority.
Parliament and the community should know if those investments delivered their intended benefits.
What we concluded
We aimed to assess if the agencies accurately measure how much traffic congestion their programs relieve.
We could not do that because:
- the department has not developed clear objectives for its Signal Network Optimisation program overall and does not measure whether it effectively relieves network congestion
- neither VicRoads nor the authority completed a benefits management plan for the Streamlining Hoddle Street project.
The department’s Movement and Place framework encourages transport design that helps users of all kinds of transport. But the agencies have not yet effectively used transport data to plan and track their initiative’s congestion benefits.
What we recommended
We made 7 recommendations to the department and the authority that covered:
- planning benefits management and documenting project procedures
- tracking and collecting accurate and reliable data
- planning for multiple transport modes.
Key facts
Source: VAGO
Our recommendations
We made 7 recommendations to address 2 issues. The relevant agencies have accepted our recommendations in full or in principle.
| Key issues and corresponding recommendations | Agency responses | |||
|---|---|---|---|---|
| Issue: Benefits management plans and project procedures are inadequate | ||||
Department of Transport and Planning and Victorian Infrastructure Delivery Authority
| 1
| Ensure that all transport initiatives:
| Accepted
| |
| Department of Transport and Planning | 2 | Collect and track accurate and reliable data showing evidence of progress against the initiative's performance indicators (see Section 3). | Accepted in principle | |
| 3 | Maintain a comprehensive and searchable record of key project procedures and decisions (see Sections 2 and 3). | Accepted | ||
Victorian Infrastructure Delivery Authority
| 4
| Collect and track accurate and reliable data to:
| Accepted
| |
| 5 | Maintain a comprehensive and searchable record of key initiative decisions (see Sections 2 and 3). | Accepted | ||
| Issue: Inadequate planning for multiple transport modes | ||||
| Department of Transport and Planning | 6 | Collate and analyse data for all transport modes to better plan and deliver initiatives that relieve congestion (see Sections 2 and 3). | Accepted | |
7
| Plan signal network optimisation reviews of arterial roads based on:
| Accepted in principle
| ||
What we found
This section summarises our key findings. The chapters detail our complete findings, including supporting evidence.
When reaching our conclusions, we consulted with the audited agencies and considered their views. The agencies’ full responses are in Appendix A.
Why we did this audit
An effective arterial road network:
- helps people access services and connect with their community
- supports the movement of vehicles, freight, public transport, cyclists and pedestrians.
Many people want to complete their journeys in the shortest time possible and be able to reliably predict how long a journey will take.
Congestion makes travel times longer and less predictable. It also affects the economy, reduces vehicle efficiency and increases carbon emissions.
Arterial road
Arterial roads link suburbs and support high volumes of traffic at higher speeds than local roads. Freeways are not arterial roads but often link to them. Arterial roads are classified by the Road Management Act 2004.
The department’s signals program
The Department of Transport and Planning (the department) designed the Signal Network Optimisation program (signals program) to improve journey times and predictability across Melbourne’s arterial road network.
The signals program has since evolved. The department regards it as a program for multiple transport modes (not just road vehicles) with benefits beyond relieving congestion.
Signal review
When the department reviews the traffic light signals in a section of road to improve journeys for vehicles, freight, public transport, cyclists and pedestrians.
During a signal review, signal engineers make changes to signals in a corridor and record what the review achieved. A signal report includes:
- objectives of the review
- changes made at each signal
- impact of the review
- changes in travel time and volume across the corridor.
Corridor
A section of arterial road with a series of traffic signals in succession.
The authority’s Hoddle project
The Hoddle Street–Punt Road corridor is a major north-south arterial road in Melbourne.
Research by the Grattan Institute shows travel to and from the city from the northeast, especially along the Eastern Freeway and Hoddle Street, is more congested than other routes.
VicRoads designed the Streamlining Hoddle Street project (Hoddle project) to reduce road congestion and improve travel time reliability. It aimed to do this by changing the layout of intersections in the corridor to improve traffic flow.
The Victorian Infrastructure Delivery Authority (the authority) took over the Hoddle project from VicRoads in 2018 and completed it in June 2019.
Our key findings
Our findings fall into 3 key areas:
| 1 | The government’s traffic congestion initiatives have incomplete plans and lack clear objectives. |
| 2 | The department and the authority could not effectively evaluate the benefits of their traffic congestion initiatives. |
| 3 | It is not possible to determine if either initiative improved traffic congestion. |
Key finding 1: The government’s traffic congestion initiatives have incomplete plans and lack clear objectives
No clear objectives for the signals program
Government agencies should determine the objectives and intended benefits of a program at the outset.
The department has not yet determined the strategic objectives or the intended benefits of the signals program overall.
It has not determined:
- its vision of what the signals program will achieve
- objectives to work towards that vision
- baselines or indicators to measure its performance.
Baseline
A fixed starting point for later comparison.
Instead, the department has set site-specific goals, based on the Movement and Place framework, for each signal review depending on an area’s transport priorities and feedback from road users.
This has had consequences for setting priorities and measuring program level outcomes.
The department has not used available data to set priorities, potentially delaying benefits
The Smarter Roads program (Smarter Roads) significantly increased the department’s traffic data collection capability. This means the department has more data available for it to use in the signals program.
Despite this, the department has continued to primarily use this data for individual signal reviews. It has not used the data to help it prioritise which corridors to review.
The department evaluated a sample of 20 corridors (almost a quarter of the corridors in phase 1 of the signals program). It found that 3 of those corridors provided 84 per cent of travel time benefits.
This suggests that the department's current process is not prioritising corridor reviews with the greatest potential to reduce congestion. This has potentially delayed signals program benefits.
Incomplete procedures documentation for the signals program
Signal reviews are complex and involve multiple teams within the department, including highly trained signal engineers. Although the department has procedures for many parts of the signals program, it has not:
- fully documented all these procedures
- created an overarching procedure for the signals program.
The well-established signal engineer team has good documentation. But the department has not documented other teams’ procedures.
Without an overarching procedure, teams cannot see how their input contributes to the signals program’s objectives.
Incomplete benefits management planning for the Hoddle project
VicRoads and the authority did not complete a benefits management plan for the Hoddle project.
Benefits management plan
A document that specifies the:
- benefits an investment will deliver to successfully address an identified problem
- measures it will use to provide evidence of those benefits.
VicRoads prepared a benefits map and included preliminary targets in the Hoddle project business case. But it did not:
- include baseline metrics or develop final targets
- complete a benefits management plan as per the Department of Treasury and Finance’s (DTF) requirement.
Key finding 2: The department and the authority could not effectively evaluate the benefits of their traffic congestion initiatives
The signals program’s overall benefits cannot be measured
The department does not measure the full benefits of its signals program. It told us it did not define key performance indicators (KPIs) for the signals program because it did not intend to measure the benefits of the program overall.
Instead, it sets objectives and transport mode priorities for each signal review. The department explains the benefits of each signal review in its signal report.
However, the performance indicators in each report are specific to that review and its objectives under the Movement and Place framework. This means the department does not yet have a way to aggregate and evaluate the benefits of the signals program overall.
The department is improving its data model
The department is continuously improving its data fusion model (data model), which it uses to analyse and improve traffic flow.
The department uses the model to collect traffic data from multiple sources. It then chooses a single data source for traffic speed and another for traffic volume.
However, the data model does not report important data that would help the department understand network-wide congestion, such as public transport travel times.
The department says it intends to gather data for all transport types in the future and incorporate this data into the signal review process.
VicRoads did not finalise baselines and targets for the Hoddle project
VicRoads did not complete its benefits management plan in the Hoddle project business case. It did include a benefits map listing the project’s intended benefits, but not baselines or targets.
The business case said the baselines and targets would be finalised and a benefits management plan would be prepared after extensive data collection.
In June 2018, VicRoads' consultant proposed reviewing the benefits map, benefits and KPIs. But VicRoads did not go ahead with this work.
The authority could not prove the benefits of the Hoddle project
In 2016, DTF told VicRoads that it did not consider the Hoddle project a High Value High Risk project because its budget was below $100 million.
In 2019, the authority delivered the Hoddle project, at a cost of $111.2 million. The Hoddle project’s business case outlined the risks in the project, including that the proposed intersection changes had not been tried in Australia before.
Under DTF’s High Value High Risk guidelines in place in 2019 this project would have been deemed High Value High Risk and require an agency to prepare a comprehensive benefit analysis called a Gate 6 review.
The authority did not do this, and instead undertook a draft benefits assessment report in 2024. That report did not confirm whether the Hoddle project delivered its intended benefits.
Key finding 3: It is not possible to determine if either initiative improved traffic congestion
The department
does not collate signal review results
Each signal review is different and not all corridors have the same transport priorities. This means the data and sources of data the department includes in signal reports are not consistent.
Most signal reports include travel time and volume data. But the department does not report all signal reviews' travel time and volume data in one place. This means they cannot compare the effectiveness of the signal reviews overall.
Some of the reports also discuss queuing, pedestrian outcomes, green signal time, turning phases and public transport performance. The department does not analyse these measures at the program level either.
It is not possible to determine if signal reviews significantly reduce travel time
When the department measures travel time before and after a signal review, it does not account for travel time fluctuations that naturally occur without intervention.
For the department to reliably show an impact from signal reviews, the impact must be larger than natural fluctuations, or the department must develop a more sophisticated approach to measuring the impact of signal reviews.
We created a statistical model to assess if the travel time changes could be attributed to signal reviews. Although our model had limitations, there was not a statistically significant improvement in travel times for most corridors.
Further data gathering and analysis is required to better show how signal reviews impact travel time.
The scope of the Hoddle project changed when funding for Stage 2 was not approved
The Hoddle project business case outlined delivering the project in 2 stages:
- stage 1 included upgrading 4 intersections in 2 packages (A and B)
- stage 2 added the upgrade of 5 intersections.
VicRoads did not include a benefits management plan in the Hoddle Project business case. It did list intended benefits in a benefits map, without baselines or targets. VicRoads listed preliminary targets elsewhere in the business case.
Stage 2 of the Hoddle Project did not go ahead. Despite this, neither VicRoads nor the authority updated the benefits map or created a benefits management plan according to the change in scope.
The authority chose not to use traffic data prior to COVID-19 when it evaluated the project benefits
The Hoddle project business case shows that under normal circumstances the authority would have collected data 12 months after the project ended to assess its benefits.
Package A was completed by December 2018 (over 12 months before COVID-19) and the project was completed in June 2019 (8 months before COVID-19). This means pre-COVID-19 data 12 months post project is available for Package A.
However, when the authority completed the draft benefits assessment report it used data from August 2022 as an after-project point of comparison for most measures for both packages.
The authority said it was rectifying defects that would have impacted the comparability of data at this time, but 2022 data was also impacted by the change in travel patterns post-COVID-19.
The Hoddle project did not increase person throughput in vehicles
One intended benefit of the Hoddle project was a more efficient transport network. The authority tracked this by measuring:
- how many people moved both through and across Hoddle Street
- public transport travel times.
When the authority completed the draft benefits assessment report, it finalised its targets for people moving through and across Hoddle Street.
It reduced its target for the volume of people moving:
- north-south through Hoddle Street to 6 per cent, down from 20 to 30 per cent in the preliminary report
- east-west across Hoddle Street to 2 per cent, down from to 10 per cent in the preliminary report.
The draft benefits assessment report explains the authority changed this target because it only partially delivered the recommended solution. It says the full benefits would only occur if the recommended option was fully delivered.
However, the authority’s draft benefits assessment report found the Hoddle project did not meet these revised targets regardless.
1. Context
Road congestion is a complex and persistent challenge with both social and technical solutions. Interrupted traffic flow affects the economy, businesses, and people’s daily lives.
From road congestion to traffic flow
Road congestion is a multi-dimensional challenge
Roads help people to access work, school and services, and participate in their community. Roads are more than just conduits for cars and trucks. They also support public transport, cyclists and pedestrians. People live and work alongside roads, and congestion can interfere with their movement, access and lives.
Managing congestion is a constant and cyclical challenge. When government make changes that reduce traffic volume, drivers change their behaviour and over time the traffic volume increases again.
Figure 1 shows some of the many factors that can interrupt or ease a journey. Travel demand, unexpected events and driver behaviour can lead to congestion while physical controls can relieve it.
Figure 1: Factors that can hamper or support traffic flow
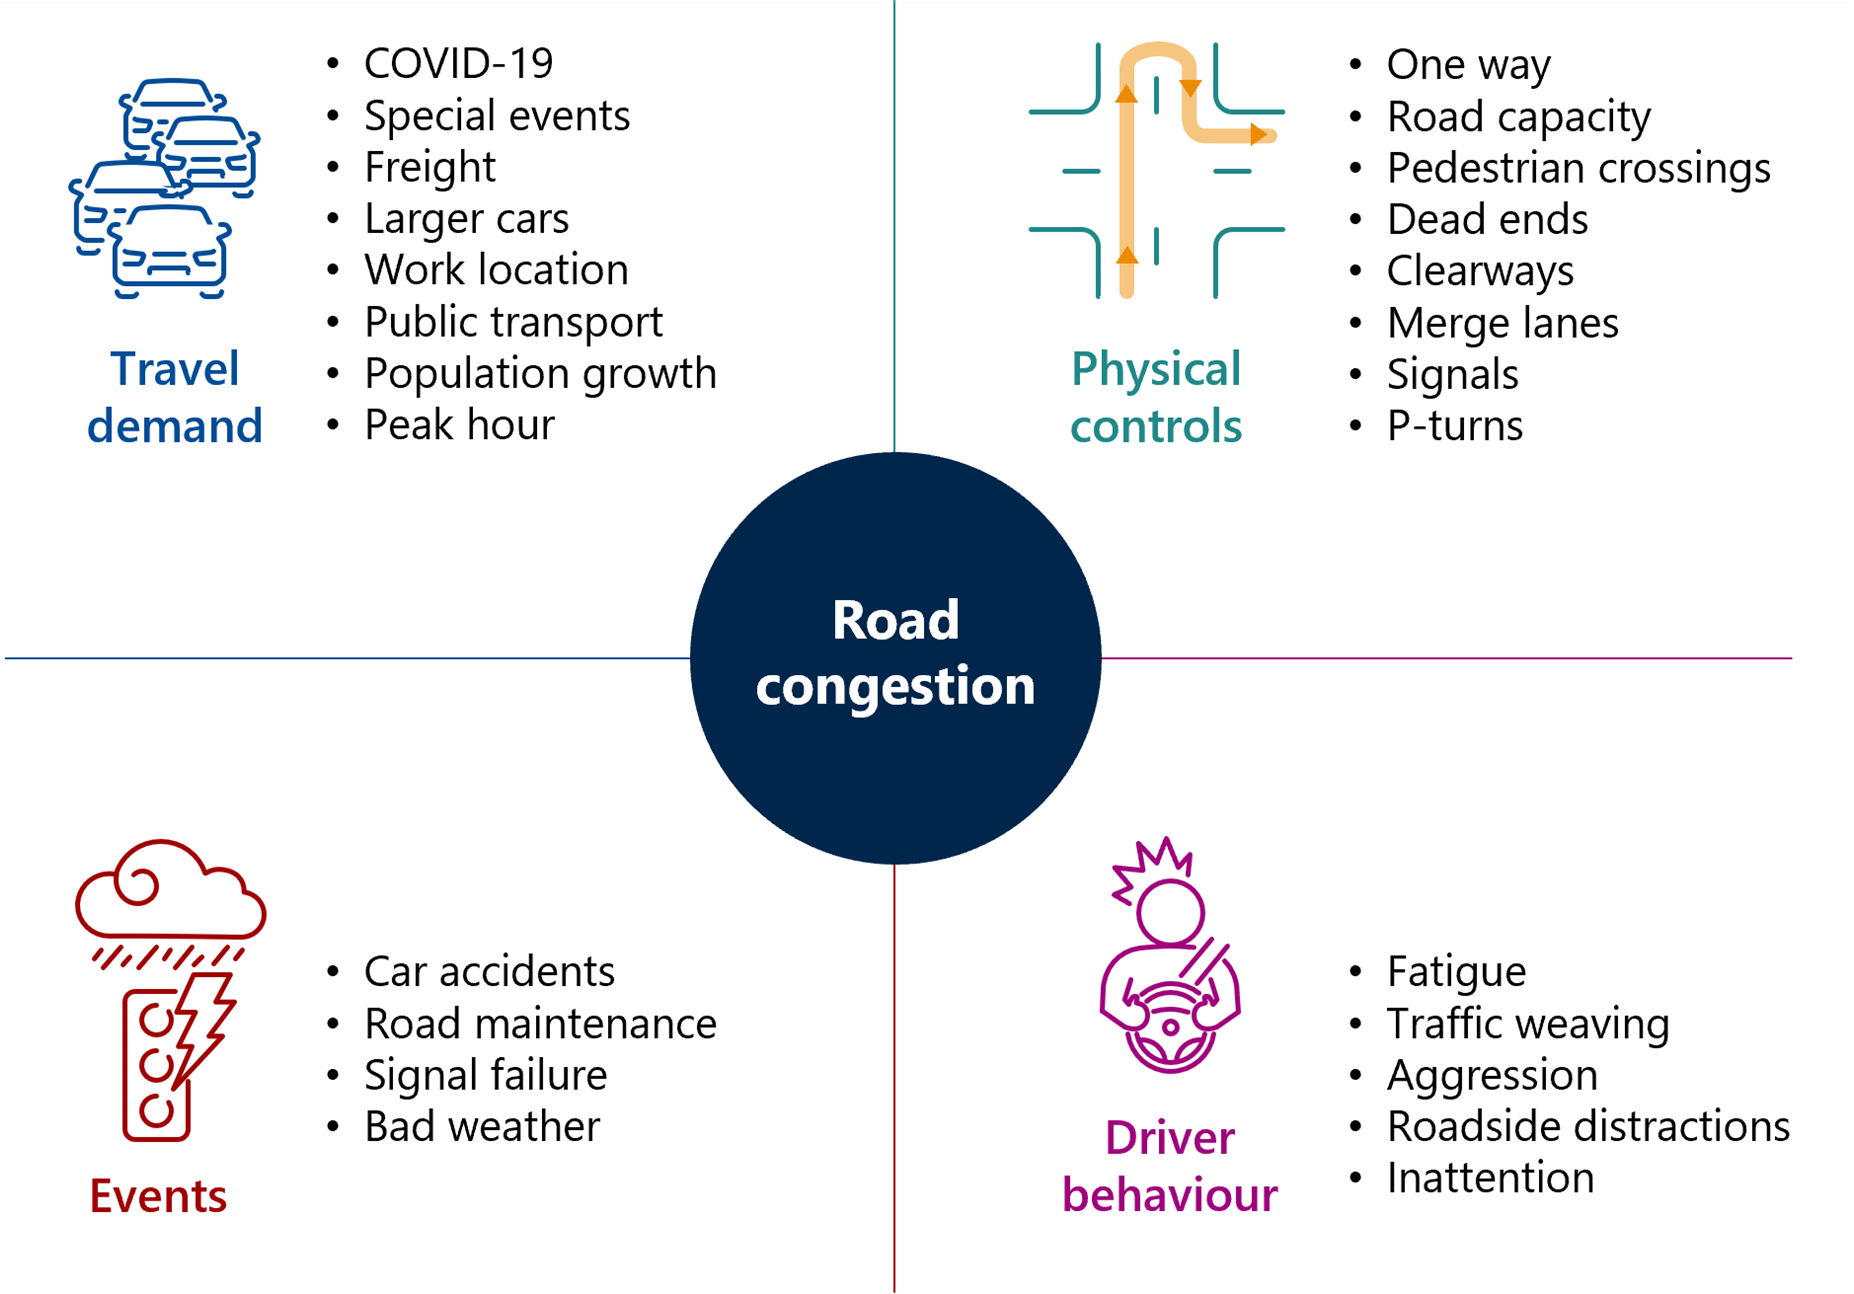
Source: VAGO.
The Movement and Place framework
The Movement and Place framework recognises that roads perform many functions and considers the needs of all users.
The department uses this framework to design Victoria’s transport network and to consider different places and transport types. It also classifies each type of place and movement along each corridor.
Figure 2 illustrates how the framework guides transport planning. We explain the Movement and Place classifications in appendix D.
Figure 2: Movement and Place framework approach to transport planning
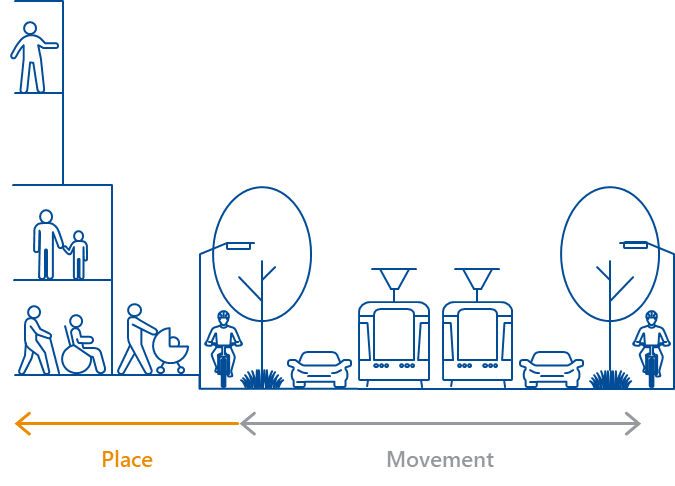
Source: VAGO, based on the Department of Transport’s 2019 Movement and Place in Victoria.
Managing traffic flow with physical controls
There are many ways to relieve congestion. This engagement looks at 2 different approaches the government has taken to manage traffic flow through physical controls:
- optimising traffic signals across Melbourne
- changing the way traffic flows along the Hoddle Street–Punt Road corridor.
The signals program seeks to optimise traffic signals to assist traffic flow
The Smarter Roads program
The department started to implement Smarter Roads in June 2020.
The government approved $342 million for a package of measures to reduce congestion and disruptions on the arterial road network in Melbourne’s western, eastern and south-eastern suburbs.
Among other measures, the package included:
- the signals program ($14.6 million over 4 years)
- installing intelligent transport assets on the road network
- upgrading road management systems and tools
- creating a data model that includes speed and traffic volume data.
The signals program
The intention of the signals program is to review traffic light sites and support traffic flow on arterial roads in 7 zones across Melbourne.
The signals program evolved from the department’s practice of periodically reviewing corridors, called route reviews. This was not an established program for reviewing corridors. Instead, the department reviewed corridors ad-hoc, usually in response to feedback from road user groups.
Route reviews had a smaller scale and fewer resources than the signals program. It had a backlog when the signals program began.
The signals program is also wider in scope and has better technology than the route reviews. It benefits from several measures that Smarter Roads funded.
The signals program is the department’s first attempt to review signal sites across Melbourne with the improved data collection and technology it now has.
Signal reviews in practice
When the department assigns an engineer to a signal review, they confirm how many signals to include in the corridor under review. This means the total number of signals reviewed changes over time.
The signal engineers are highly skilled and some have conducted signal reviews for many years. They use the Signal Design and Optimisation Guidelines, a comprehensive set of technical procedures, to guide their work. But this is only one part of the process.
They work with the Congestion Management Team (Congestion Management) which the department created more recently so signal engineers could focus on the technical side of traffic reviews.
First, the engineer completes desktop analysis and observes the traffic conditions in the corridor. They:
- consider which transport modes to prioritise according to the Movement and Place framework
- discuss and decide the objectives of the review with Congestion Management
- analyse the data and system measurements.
Some of these data sources are listed in Figure 3.
Figure 3: Signal review data sources explained
| Data source | Description |
|---|---|
| Sydney Coordinated Adaptive Traffic System | A digital platform that includes real-time traffic light status and live traffic sensors. Signal engineers use this information to optimise the network. |
| closed-circuit television (CCTV) cameras | Cameras at intersections allow signal engineers to visually monitor vehicle queuing, pedestrian crossing times and other qualitative information. |
| The data model | The department’s data model offers detailed insights into traffic speed and volume that signal engineers can use to analyse and optimise traffic flow. |
Source: VAGO.
Next, the engineer makes technical changes to the signals based on their observation and analysis.
Engineers aim to collect data for 2 weeks before and after the changes. The engineer may tweak the changes after further observation.
The engineer then prepares a signal report, based on a template, that documents the changes, improvements and corridor-specific benefits of the review. Figure 4 summarises the 8 sections of a signal report.
Figure 4: The 8 sections of a signal report

Source: VAGO
The signals program benefits from Smarter Roads measures
The department designed Smarter Roads so its measures complement each other and make the transport network more efficient overall. Smarter Roads includes several measures that feed into the signals program.
- The department recruited and trained a new cohort of traffic signal engineers. Signal reviews require highly skilled signal engineers with on-the-job training. It takes many years to develop that knowledge and become a specialist. The department employs 18 signal engineers that work on the signals program and other programs.
- The department created and recruited a new team, Congestion Management, that works on the signals program and others. This team now manages road user group feedback so that signal engineers can focus on signal reviews. It learns which intersections have issues from:
- local councils
- public transport operators and road authorities
- the department’s real time signal operations and metropolitan movement and safety teams
- public enquiries through the department’s enquiry tracking system.
- The department installed CCTV cameras, Bluetooth data stations and pedestrian detectors across the arterial road network. These technical assets have made the signals program more efficient. Other teams in the department, such as the real time signal operations team and the traffic operations centre, also make use of these technical assets.
The department completes signal reviews in normal traffic conditions
Signal engineers make strategic changes to prioritise traffic movements according to the current conditions of the network. The department aims to specify and improve the operation of the transport network in a wide range of traffic conditions to provide the best conditions for all traffic.
For this reason, the department does not conduct signal reviews:
- during school holidays when traffic is less congested
- when road works or construction projects are affecting traffic flow.
However, signal engineers continue with other parts of the review process during those times.
The authority tested an innovative intersection design on a major arterial road
VicRoads designed the Hoddle project to be innovative
The government approved the Hoddle project business case in February 2016. It aimed to use innovative traffic management solutions to make better and more efficient use of existing transport infrastructure. The project included building Victoria’s first continuous flow intersections.
Continuous flow intersection
An alternative design for a road intersection that stops vehicles from turning right at the lights and obstructing traffic while they wait to cross the opposite flow of traffic. Instead, those vehicles turn left, take a U-turn and proceed across the intersection when those lights turn green.
VicRoads planned to deliver the Hoddle project in 2 stages. Stage 1 included upgrading 4 intersections and stage 2 added the upgrade of 5 intersections, as Figure 5 shows.
Figure 5: Proposed intersection improvements for stage 1 and stage 2 of the Hoddle project
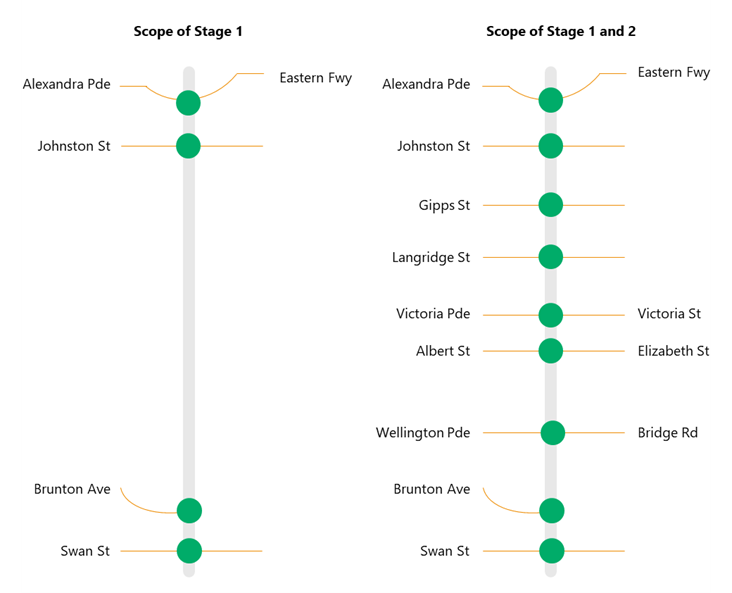
Source: VAGO, based on VicRoads/PTV’s 2016 Streamlining Hoddle Street Business Case.
The government has only funded stage 1 of the project to date
VicRoads’s business case estimated that the total investment for both stages (the recommended solution) of the Hoddle project would be $129.65 million.
The expected budget for stage 1 (which would upgrade 4 intersections in 2 packages, A and B) was $60.27 million ($58.4 million capital expenditure).
| Package … | Included ... | For improvements ... |
|---|---|---|
| A | $12.4 million | to the Eastern Freeway interchange. |
| $6.9 million | to the intersection of Johnston and Hoddle streets. | |
| B | $39.1 million | to Punt Road’s intersections with Swan Street and Brunton Avenue. |
In 2016, the government approved funding for stage 1.
In March 2018, the government approved further funding to complete stage 1, bringing the total estimated investment to $108.55 million.
Appendix E lists the changes made during stage 1 of the Hoddle project and what was delivered.
The Major Transport Infrastructure Authority took over responsibility for the Hoddle project from VicRoads in January 2019. The Major Transport Infrastructure Authority became the Victorian Infrastructure Delivery Authority (the authority) in April 2024.
The government is yet to fund stage 2 of the project.
The authority has not yet completed its project evaluation report.
2. Planning and delivering congestion solutions
When congestion initiatives are poorly planned it is more difficult to deliver and assess their benefits.
The department did not design strategic objectives for the signals program. This had consequences for setting priorities and measuring outcomes.
Similarly, the lack of a benefits management plan for the Hoddle project compromised the authority's ability to assess project benefits.
The department did not develop strategic objectives for the signals program
Strategic objectives inform priorities, resources and monitoring
Our 2013 audit Managing Traffic Congestion found the absence of clearly defined objectives and systematic reporting compromised the implementation of statewide initiatives to manage congestion.
Strategic objectives give clear direction and guidance on what an agency intends a program to achieve.
Without clear objectives, it is difficult for a department to decide what activities to do and how to prioritise them. It can also be difficult to understand the impact of these activities.
The department did not set strategic objectives for the signals program
The department had a business case for Smarter Roads and a project document for the signals program. That document explained that the department had not yet developed KPIs for the signals program. It listed the benefits, measures and targets in Smarter Roads that were relevant.
But neither the signals program's project document nor the Smarter Roads business case set strategic objectives for the signals program.
The department uses the Movement and Place framework to set objectives for each individual signal review. But it has not developed strategic objectives for the signals program overall.
Without a clear plan for the signals program (as distinct from Smarter Roads), the department has not determined:
- the goals or vision of what the signals program will achieve
- an intervention logic for the program
- baseline or indicators to measure its performance against.
The signals program expanded and improved existing practices
Instead of setting strategic objectives for the signals program, the department expanded and incrementally improved its existing signal review practices.
Smarter Roads reflected a significant increase in the funding available to undertake route reviews, which became known as signal reviews.
Without clear strategic objectives to guide the signals program's development, the department expanded its existing route review initiative.
The department used this funding to hire more traffic signal engineers and to establish Congestion Management to take on road user group feedback.
The funding also increased the number of route reviews. This meant the department could set a goal to review all signals within 4 years.
The department did not use its data insights to prioritise which corridors to review in the signals program, potentially delaying benefits
Data for all transport modes should inform prioritisation
Our 2013 report identified the opportunity for the department to improve the way it prioritises signal reviews by better capturing and using data about road corridors.
At the time, the department was primarily using available data to assess the performance of traffic signals once it had decided to review them, rather than to proactively identify corridors that needed reviewing.
Smarter Roads improved the data available to the department
Smarter Roads significantly increased data collection capacity across the arterial road network.
This included:
- 1,374 CCTV units
- 303 Bluetooth data stations
- 128 dynamic pedestrian detectors.
Together, these technical assets significantly increased the data and information the department has available to use in the signals program.
The department did not use available data to prioritise signal reviews
The department could use its data insights to monitor signal review trends over time or develop strategic objectives for the signals program.
Instead, the department prioritises which corridors to review based on:
- how critical intersections are (determined by feedback from local councils and road user groups)
- major tram or bus timetable changes
- the completion of major transport projects
- major transport projects changing network conditions in the immediate and surrounding areas
- annual events changing road conditions.
With the exception of an improved approach to capturing road user feedback through the establishment of Congestion Management, the approach to prioritising corridors for review is unchanged from our 2013 audit.
This may have delayed benefits of the signals program overall
The department contracted an economic evaluation of phase 1 of the signals program during this audit. This evaluation focussed on travel time benefits and did not explore other benefits of the signals program across different modes of transport.
The department evaluated the travel time benefits of a sample of 20 corridors (almost a quarter of the corridors in phase 1 of the signals program). It found that 3 of those corridors provided 84 per cent of the travel time benefits.
This suggests that the department's current process may not prioritise signal reviews with the greatest potential to reduce congestion. This may have delayed the signals program's benefits.
Further, if 17 corridors only provided 16 per cent of the benefit, on average they are providing less than one per cent each. This suggests the benefits of conducting signal reviews on all arterial roads may not outweigh the cost.
With the additional data, technology and assets from Smarter Roads, and the potential for mining information from road user groups, the department could develop a method to identify the corridors that would benefit most from signal reviews and review them more frequently.
The economic evaluation found that benefits appear to be highly correlated with traffic volume. After reviewing the benefit–cost ratio of the completed signal reviews, the department could determine the traffic volume benchmark for signal reviews.
Although the evaluation focused on travel time, the department could design benchmarks for any transport mode.
The department has not documented the signals program’s intended benefits
The signals program lacks a benefits management plan
While Smarter Roads had a benefits management plan, the signals program did not.
The Drive Easy Melbourne business case, which later became the Smarter Roads business case, includes a benefits management plan and KPIs. The business case for phase 2 of Smarter Roads in March 2022 also included KPIs, but they were different from the original KPIs.
In the signals program's project document, it said the Smarter Roads’ benefit 'Improved transport network efficiency' and its KPIs were directly linked to the signals program.
Figure 6 lists the KPIs, measures and targets for ‘Improved transport network efficiency’ in phase 1 and phase 2.
The department removed the throughput KPI from the Smarter Roads documentation after phase 1. Productivity and travel speed were introduced in phase 2. But none of the targets are the same in phase 2.
Throughput
Throughput is the number of people that flow through a point in the corridor as pedestrians, in cars, public transport or other vehicles.
Figure 6 Improved transport network efficiency KPIs, measures and targets for Smarter Roads phases 1 and 2
| Phase | KPI | Measure | Target for treated zones |
|---|---|---|---|
| 1 | Reliability | Standard deviation of travel time | >10% improvement of travel time reliability in peak period by 31 December 2021 |
| Throughput | Passenger density / vehicle density | >5% increase in throughput of people and goods per hour during peak time by 31 December 2021 | |
| Travel time | Travel time for private and commercial vehicles | >5% improvement in travel times by 31 December 2021 | |
| 2 | Travel speed (actual) | % travel time improvement for all vehicle types on selected corridors | 3% TBC improvement in travel speed |
| Travel time reliability | % improved nominal 30-minute journeys completed on selected corridors | >87% of nominal 30-minute journeys completed within 35 minutes | |
| Productivity | % of traffic speed and traffic flow on selected corridors | 3% increase in annual productivity | |
| Travel speed variability | % improvements in travel speed variability on selected corridors | 3% improvement in travel speed variability for the worst hour in each peak period |
Source: VAGO, based on the Department of Transport’s 2020 Continuation of Expanded Incident Response Service and Drive Easy Melbourne Stage 1 Business Case and the Department of Transport’s 2022 Smarter Roads Program Phase 2: Creating More Road Space.
The signals program has no KPIs of its own
The department has not clearly documented the intended benefits of the signals program as distinct from Smarter Roads.
The project document for the signals program said that it was important to define key strategic, tactical and operational KPIs.
However, the department told us that the signals program does not have targeted KPIs of its own.
The department does measure the corridor specific benefits of each signal review and describes those unique benefits in each signal report. But the travel time and volume are specific to each location.
Without consistent KPIs across signal reviews, the department cannot measure benefits at the program level.
The department lacks data and comprehensive procedures for the signals program
The department uses the Movement and Place framework to guide signal reviews
Instead of defining strategic objectives for the signals program, the department sets unique performance objectives for each signal review based on the Movement and Place framework and road user group feedback.
The department uses the framework to define the existing and desired level of service for the different types of transport, and it then makes strategic choices about which type of transport it will prioritise.
The aim of a signal review is to reduce the gap between the current performance and aspirational performance.
The department intends the Movement and Place framework to be an overarching guide to transport planning. However, it:
- has not documented its part in the signals program
- does not report on reducing performance gaps as an outcome of each signal review
- does not always include the current and desired level of service in its signal reports.
The department needs data to analyse performance gaps
The department does not yet collect data for pedestrians, cyclists or public transport to use in signal reviews. This means it cannot measure those performance gaps.
If the department measured these gaps, it could:
- more accurately describe the objective and benefits of individual signal reviews
- potentially contribute to a network-wide understanding of movement and place.
Collecting this data for all types of transport would also support the department to:
- monitor corridor trends over time
- identify and prioritise corridors it should review more often.
Signal reviews are managed by staff who have other responsibilities
The department needs clear procedural guidance with good document hygiene to manage the signals program effectively. This is because the program continues to evolve.
Signal reviews are complex and rely on input from 2 teams:
- signal engineers who design and undertake the technical work
- Congestion Management, which gathers input from road user groups.
Signal engineers and Congestion Management both work, sometimes together, on various parts of the process. Both teams have other responsibilities that compete with their signal review tasks:
- The department often diverts signal engineers to design new signal sites and complete ad hoc reviews of corridors that infrastructure changes may have affected.
- Congestion Management also work with the Real Time Signal Operations team who check the network and make changes in real time.
The department has not documented its processes
The department needs clear procedural guidance with good document hygiene to manage the signals program effectively. This is because the program continues to evolve.
Congestion Management collects and manages stakeholder feedback. It says it considers road user group feedback to:
- inform the corridor performance objectives
- confirm any problems (such as road works) with the timing for a review.
To date, Congestion Management has not formally documented all the processes it uses in supporting signal engineers and signal reviews.
This means there can be inconsistencies in:
- the content of reports from different team members
- the way they engage road user groups
- which road user groups they reach out to
- the way the department assesses road user group feedback.
However, during this engagement the department:
- created a road user group engagement template which Congestion Management uses to gather feedback
- documented procedures for scheduling and prioritising corridors.
Without consistent documentation and guidance, how Congestion Management assesses road user group feedback can depend on individual’s knowledge and judgment and for that reason it can be inconsistent.
No overarching procedure document for signal reviews
The department has 9 different procedures that guide the signals program. The department told us they do not have a single document that guides the teams involved in signal reviews because the process is complex.
Figure 7 shows the information included in the procedures the department uses for signal reviews. Using multiple procedure documents makes the signals program more complex.
Without an overarching procedure document, different teams cannot see how their input in the process contributes to the overall program objectives.
Figure 7: Signal review procedures, what they cover and who uses them
| Who uses it | What it covers | ||||||
|---|---|---|---|---|---|---|---|
| Procedure | Signal engineers | Congestion Management | Technical guidance | Process guidance | Reporting and benefits | Movement and Place | Stakeholder feedback |
| Signal optimisation process | ✓ | ✕ | ✕ | ✓ | ✓ | ✕ | ✕ |
| Signal optimisation checklist | ✓ | ✕ | ✓ | ✓ | ✕ | ✕ | ✓ |
| Signal Design and Optimisation Guidelines | ✓ | ✕ | ✓ | ✕ | ✕ | ✕ | ✕ |
| Signal report template | ✓ | ✕ | ✕ | ✓ | ✓ | ✕ | ✕ |
| Signal Network Optimisation Overview and Instruction | ✕ | ✓ | ✕ | ✓ | ✓ | ✕ | ✓ |
| Prioritisation principles | ✕ | ✓ | ✕ | ✓ | ✕ | ✕ | ✓ |
| Scheduling principles | ✓ | ✕ | ✕ | ✓ | ✕ | ✕ | ✕ |
| Process for determining network performance objectives | ✕ | ✓ | ✕ | ✓ | ✕ | ✓ | ✓ |
| Movement and Place technical appendix | ✓ | ✓ | ✓ | ✓ | ✕ | ✓ | ✕ |
Source: VAGO.
Signal review progress reporting has improved over time
The department created a template for signal reports in July 2021. Signal engineers use this template to report the benefits of each review for internal stakeholders, usually Congestion Management.
The contents of this template have evolved over the life of the signals programs. This means there are inconsistencies between earlier and more recent signal reports.
Signal reports now include:
- travel time and volume benefits (2 weeks before and 2 weeks after the review)
- a summary of the network performance objectives for the corridor
- reflections on the modal priorities relevant to the area
- Movement and Place classifications, but not always the current and desired level of service.
The content of each report also varies according to the requirements of the location and reflects the unique objectives for each review. This also means the scope of findings in each report is not always comparable.
COVID-19 and resourcing affected the delivery of the signals program
COVID-19 affected the delivery of phase 1 of the signals program
The COVID-19 pandemic, the lockdowns in Melbourne, and changes to where and how people work impacted travel patterns. Since the pandemic, people have changed when they travel, how they travel and the mode they use to travel.
The department aims to conduct signal optimisation under ‘normal’ conditions, so it delayed phase 1 of the signals program until after the lockdowns and traffic volumes had stabilised.
The department was also unable to recruit and train staff during the pandemic, which meant they did not have enough resources to deliver phase 1 of the signals program as scheduled.
Due to COVID-19, the department delivered phase 1 of the signals program 11 months late, but it reviewed 210 more signal sites than it had planned.
| In ... | The department planned to review … | By … | The department ... | By … | On arterial roads in ... |
|---|---|---|---|---|---|
| Signals program phase 1 | 759 traffic signal sites | June 2022 | reviewed 969 traffic signal sites | June 2023 | metropolitan Melbourne zones 1, 5 and 6. |
| Signals program phase 2 | 2,214 traffic signal sites | July 2026 | now plans to review 3,062 traffic signal sites | August 2027 | metropolitan Melbourne zones 2, 3, 4 and 7. |
Lower technical asset coverage may affect signal review efficiency in phase 2
When route reviews became the signals program and part of Smarter Roads, they benefited from the extra technical assets the department installed in phase 1 zones.
The department specifically positioned those technical assets to benefit the signals program, which has made it more efficient and effective. The signal engineers can now access traffic data from many signal sites from their desks rather than having to physically visit them.
However, there are fewer technical assets in phase 2 zones. This means a greater proportion of signal reviews may require site visits that take more time.
Figure 8 shows the distribution of technical assets across Smarter Roads zones and the lower coverage in phase 2 zones.
Figure 8: Technical asset coverage across Smarter Roads zones
| Signals program phase 1 | Signals program phase 2 | ||||||||
|---|---|---|---|---|---|---|---|---|---|
| Technical asset type | Zone 1 | Zone 5 | Zone 6 | Total | Zone 2 | Zone 3 | Zone 4 | Zone 7 | Total |
| CCTV cameras | 179 | 173 | 396 | 748 | 196 | 135 | 139 | 158 | 628 |
| Bluetooth detectors | 70 | 19 | 42 | 131 | 36 | 15 | 40 | 19 | 110 |
| Dynamic pedestrian detectors | 17 | 28 | 62 | 107 | 1 | 2 | 6 | 17 | 26 |
Source: VAGO, based on information from the department.
The rate of signal reviews has not improved
International research suggests that agencies should optimise signal timing every 3 to 5 years, and more often if there are significant changes in traffic volume or road condition.
The department's 2020 business case stated that VicRoads' overall average route review cycle was between 7 and 10 years and that it had a considerable backlog.
The department was aiming to complete a cycle of signal reviews in 4 years, but it now expects the first full signal review cycle will take 7 years. This is because of COVID-19, resourcing and the expansion of the scope of reviews.
VicRoads did not finalise a benefits management plan for the Hoddle project
VicRoads’ benefits management plan did not follow the standard
DTF’s 2012 Investment Management Standard applied to the Hoddle project business case VicRoads prepared in 2016. That standard outlines the requirements of a benefits management plan.
VicRoads’ business case lacked elements of a benefits management plan DTF's standard requires, as Figure 9 shows.
Figure 9: Hoddle project compliance with Investment Management Standard
| Investment Management Standard requirement | Hoddle project benefits management plan |
|---|---|
| Baselines | ✗ |
| Targets | ✗ |
| Expected delivery date for benefits | ✗ |
| Who is responsible for benefit delivery | ✗ |
| How benefits will be reported | ✓ |
Source: VAGO, based on VicRoads/PTV’s 2016 Streamlining Hoddle Street Business Case.
VicRoads did not prepare a benefits management plan
VicRoads did not include a completed benefits management plan in the Hoddle project business case. It did include a benefits map, which listed the project’s intended benefits, but not baselines or targets.
The business case said the baselines and targets would be finalised and a benefits management plan would be prepared after extensive data collection.
Figure 10 shows the benefits map VicRoads included in the Hoddle project business case. It shows that baselines and targets were not set. It listed preliminary targets elsewhere in the business case, but it did not review them as intended.
The business case outlined a project that would have 2 stages. It noted that the full benefits of the Hoddle project would not be realised unless both stages were complete.
The government has not yet funded stage 2 of the project.
Figure 10: Hoddle project benefits map
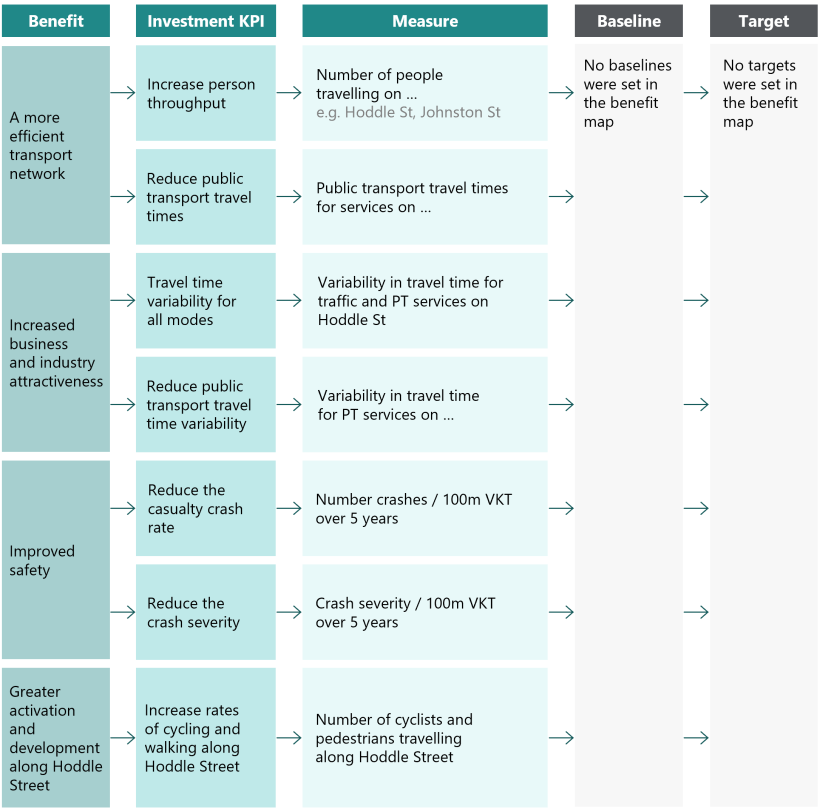
Note: ‘VKT’ stands for Vehicle Kilometres Travelled.
Source: VAGO, based on VicRoads/PTV’s 2016 Streamlining Hoddle Street Business Case
The authority could not effectively assess the benefits of the Hoddle project
The authority changed the measures and targets retrospectively
In 2023, when the authority prepared to assess the benefits of the Hoddle project it had no benefits management plan to assess the project against. Instead, it created an assessment framework by taking and revising the measures and preliminary targets from the business case.
Figure 11 shows the changes that the authority made to the measures and targets for its draft benefits assessment report.
The authority needed to make these changes to reflect:
- the timing of its assessment
- the fact that only stage 1 of the intended project was delivered.
VicRoads not finalising the benefits management plan in 2016 meant the authority could later not assess the project against its intended benefits.
Figure 11: Revised measures and targets used in the authority’s draft benefits assessment report
| Target or measure | Preliminary | Revised |
|---|---|---|
| All targets | Preliminary target 12 months (or 5 years) after opening | This text was removed from all targets because the authority did not measure targets 12 months after opening (due to COVID-19) or 5 years after opening (because that date has not happened yet) |
| All measures | The location of all measures | The location of each measure was changed to reflect the scope of the project being limited to 4 intersections |
| Target for the number of people travelling … | 20% to 30% along the corridor | 6% increase along the corridor |
| 10% across the corridor | 2% across the corridor |
Source: VAGO, based on the authority’s 2024 draft benefits assessment report.
The draft benefits assessment report did not follow guidelines
The authority did not follow DTF guidelines for the Hoddle project's draft benefits assessment report.
DTF's Investment Lifecycle and High Value High Risk Guidelines apply to all government departments, corporations, authorities and other bodies falling under the Financial Management Act 1994.
In 2016, when VicRoads prepared the Hoddle project business case, projects were designated as High Value High Risk if they cost over $100 million. The total estimated investment for Hoddle project stage 1 and stage 2 described in the business case was $130 million.
If DTF names a project as High Value High Risk it must take part in the Gateway Review process, including a comprehensive independent benefit analysis.
When VicRoads sought funding for only stage 1 of Hoddle project, costing $60 million, DTF did not designate the Hoddle project as High Value High Risk because its cost less than $100 million.
But in 2018, and when the authority took on responsibility for the Hoddle project in 2019:
- the Hoddle project’s final project budget was $108.55 million
- DTF's High Value High Risk definition included regard to the project’s level of risk.
The Hoddle project business case noted both high and medium risks inherent in the project. One risk was that the proposed intersection changes had not been tried in Victoria before. The business case said that the project owner needed to manage this risk.
Despite these risks, and although the final cost was $111.2 million, the authority acted on DTF’s initial advice and did not undertake a Gate 6 review for an independent view of the project’s process.
Instead, the authority prepared a draft benefits assessment report.
Delivering stage 1 of the Hoddle project cost more than planned
Stage 1 of the Hoddle project cost more and delivered less than planned
In 2018, the total estimated investment of stage 1 of the Hoddle project nearly doubled. VicRoads explained the cost increase was due to factors such as high tender prices and delivery complexity.
At the same time, VicRoads changed what it planned to deliver in stage 1.
The 2018 business case proposed a staged approach to delivering the recommended solution. Different parts of the scope would be delivered:
- in the next financial year
- in stage 2 of the original business case program
- as part of another project.
Some of the items that would be deferred included:
- delivering intelligent transport systems
- reducing the speed limit from 70 km/h to 60 km/h
- implementing full-time clearways along the corridor.
Our 2023 major projects performance report shows that scope and total estimated investment often change during construction.
When VicRoads did not consider the risk of higher tender prices, increasing material costs and delivery complexity in planning this project, it failed to accurately budget for the project.
3. Monitoring, reporting and evaluating traffic initiatives
The impact of the initiatives on road congestion is uncertain. However, the department is significantly improving its data capability, which will allow it to better inform interventions and assess performance.
The department has changed the way it tracks signals program progress
The department
reports how many signal reviews it completes
The department regularly reports its progress towards reviewing the total number of signal sites.
Although the department has no performance indicators for the signals program, it tracks progress by counting the number of signal sites that it has reviewed.
The department tracks progress against its forecast and presents weekly and monthly reports to management. The data in the tracker and the reports are not comparable because they have different purposes and time periods.
Figure 12 summarises the different indicators that the department uses to report progress.
Figure 12: Signal review progress reporting methods and what they cover
| Actual sites reviewed | Total planned sites overall | Planned sites by week | Planned sites % | Actual sites % | Planned corridors | Actual corridors | |
|---|---|---|---|---|---|---|---|
| Weekly reports | ✕ | ✕ | ✕ | ✓ | ✓ | ✕ | ✕ |
| Monthly reports | ✓ | ✓ | ✕ | ✓ | ✓ | ✓ | ✓ |
| Signals program phase 1 tracker | ✓ | ✕ | ✓ | ✓ | ✓ | ✕ | ✕ |
| Signals program phase 2 tracker | ✓ | ✓ | ✓ | ✓ | ✓ | ✓ | ✓ |
Source: VAGO, based on information from the department.
The department has not reported progress against its baseline over time
The department calls the dates for program milestones its baseline. If it realises it cannot meet one of these milestones (because of planned disruptions or delays to major infrastructure projects) it changes the baseline. When the department changes a baseline, it must create a formal baseline change request.
A baseline is a fixed starting point for later comparison. There can only be one baseline. What the department calls changes to the baseline are actually forecasts.
During our audit, the department told us it updated its reporting structure to accurately refer to the difference between the forecast and a baseline.
The department’s baseline for phase 1 of the signals program, which the government approved, was to review 759 signal sites by June 2022.
But when it changed the baseline to a forecast and expanded the scope of the program it did not continue to track progress against the original baseline.
The department delivered 969 signal sites by June 2023 because the program was delayed and the number of sites in each corridor can change when the review begins.
The department has changed its forecast 3 times
The department has changed its forecast 3 times for phase 1. Figure 13 shows the changes the department made to the program milestones in each forecast.
Figure 13: Signals program milestone completion dates across the department’s forecasts
| Forecast version | Signals program phase 1 milestones | Signals program phase 2 milestones | ||
|---|---|---|---|---|
| Start | Finish | Start | Finish | |
| First forecast | 1 February 2021 | 23 August 2022 | - | - |
| Second forecast | 1 February 2021 | 2 June 2023 | 17 January 2023 | 16 September 2025 |
| Third forecast | 1 February 2021 | 31 May 2023 | 29 May 2023 | 5 November 2026 |
Source: VAGO, based on information from the department.
The department is improving how it collects and analyses data for the signals program
The department does not collate or analyse signal report data at the program level
The department collects data in signal reports but does not collate or analyse it at the program level. The department cannot check and report on the signals program overall because individual signal reports:
- are not consistent (for example, not all corridors have public transport)
- include different data
- use different data sources.
The department’s signal report template (dated 28 March 2023) indicates that data for travel time and volume should come from the model, accessed through a Power BI dashboard. The dashboard shows the network’s current performance. Users can compare performance over time, including comparing 2 time periods.
But the department does not always source signal report data from the dashboard. This may be because the sections of road in the signal review do not match the sections of road in the model. This has the potential to introduce ‘noise’ (errors or unexplained variables) into the data.
We reviewed a sample of 64 signal reports since 2021.
| We found that … | Of the 64 signal reports ... |
|---|---|
| 44 | did not use data from the model. |
| 34 | used data from AddInsight. |
| 10 | did not provide data at all. |
| 22 | were completed before the model was created. |
AddInsight
Traffic information software that uses Bluetooth data to measure point-to-point travel speeds, travel times, delay and congestion.
This means that, even though the department consistently reports travel time and volume in signal reports, it does not collate travel time and volume data for all signal reviews in one place.
Signal reports can also include:
- discussion of queuing
- phase timings
- pedestrian delays
- pedestrian travel time
- the time that lights are green
- turning phase time
- public transport performance.
These types of measures require manual analysis, so the department does not include them in the model or the dashboard.
The department is not using road user group input to its full potential
The department told us Congestion Management collects stakeholder feedback for each signal report. But they do not always include the details in the signal report. Two-thirds of the 30 signal reports we reviewed included stakeholder feedback.
The Real Time Signal Operations team makes changes to signals to optimise traffic flow around infrastructure projects and disruptions, sometimes as often as every hour. Real Time Signal Operations is a key stakeholder for Congestion Management.
Congestion Management also has established relationships with local councils and public transport operators. This enables it to seek information for each signal review. Road user groups give information in response to the department’s signals program or corridor-specific requests.
Congestion Management uses road user group information to understand corridor-specific requirements for all transport types and to prepare for planned works that may require the department to delay a particular signal review.
But the department has not yet prepared guidance for Congestion Management to:
- report road user group feedback consistently
- centrally collate information from road user groups
- have formal mechanisms to consider the insights from one corridor that may be relevant to other corridors.
The information road user groups have about the transport priorities for corridors across Melbourne’s network is a rich source of data. The department could collate and use this data to proactively plan which corridors should be prioritised.
The department's data quality for the signals program is improving but has limitations
Department data modelling has evolved
The department’s data collection and analysis has come a long way since we looked at it in our 2014 report Using ICT to Improve Traffic Management.
The department has created and provided extensive documentation on its data model, which includes the sources of data and transformations made.
However, the department does not document data quality for each source comprehensively.
The department is continuously improving the model, adding more accurate and reliable data sources, and improving its estimation techniques with input from its signal engineers team.
However, the model does not yet capture or report some data that is critical to understanding congestion across the network, such as public transport times.
The department says it aims to gather data for all transport modes (include public transport data) and incorporate it into its signal review processes in the future.
The data modelling still has room for technical improvement
The department describes its model for understanding transport data as a data fusion model.
Data fusion processes integrate multiple data sources to produce more consistent, accurate and useful information than any individual data source.
The department's model does not integrate its data sources so it is not strictly a data fusion model. Instead, it collects data from multiple sources and chooses one data source for speed and another for volume.
This process is better than simply choosing one preferred data set because some sources are more accurate under particular conditions.
However, integrating data would still have these benefits and also be more accurate overall. This is because fusing multiple data sources allows users to reduce random error. It could also help the department detect more subtle signal failures by having points of comparison.
The department likely over estimates travel time variability in its data model
Another example of a technical improvement the department can make is in how it calculates travel time variability.
While the department does not use this metric to assess signal network optimisations, it does use it in monthly performance reports. The department has adapted a formula to calculate travel time variability for corridors that include multiple sections of road.
The department’s formula adds the travel time variability for each part of the corridor. However, this approach is only accurate if each part of the road is independent. This is unlikely to be true. If one part of the road is slow, the adjacent part is also likely to be slow.
This means that the department is likely to overestimate the travel time variability for multiple sections of road. However, the department currently does not use this data to assess the performance of signal reviews.
Signal review data quality assessment
All government departments and agencies should apply the Department of Premier and Cabinet’s Data Quality Guideline and hold data quality statements for all critical data assets.
We assessed the department’s signal review data against the 7 data quality dimensions outlined in Data Quality Guideline.
Figure 14 shows our assessment of the department's signal review data against the 7 Department of Premier and Cabinet data quality dimensions.
Figure 14: The department’s signal review data quality assessment
| Dimension | Rating | Reason |
|---|---|---|
| Accuracy | Amber | The department does not actually combine data in their data model so the data may not be as accurate as it could be. Outside of strict sanity checks, there is no process for independently verifying data. This means more subtle errors may be introduced. |
| Completeness | Amber | Roughly 7.6% of travel speed data is missing. Over 53.5% of volume data is estimated. This makes comparison across long timelines difficult for homogeneous flows affected. Certain homogenous flows have no data for any time. |
| Timeliness | Green | Data is updated every single day after processing. This is often enough for reporting purposes. |
| Consistency | Green | Using the Homogenous Traffic Volume Network means that the data model aligns to existing intelligent transport systems and datasets. |
| Collection | Green | Data is collected through automatic sensors. Outside of faulty detectors, there is little to no risk of sampling bias occurring. Documentation makes it clear how this data is processed, providing a shared understanding of the meaning of the data. |
| Representativeness | Amber | Due to issues raised above around potential inaccuracies, the data presented is not completely representative of actual traffic conditions. Additionally, while the decision to use the Homogenous Traffic Volume Network improves consistency with other datasets, its lack of detail may mean that some impacts of signal reviews are drowned out by noise. |
| Fit for purpose | Amber | Potential inaccuracies, completeness issues and the lack of detail in some cases means that the data model may not always show the true impact of signal reviews. |
Source: VAGO, based on information from the department.
The department should qualify conclusions when data quality has limitations
The signals program relies on accurate data to assess its impact. Much of this data is difficult to collect accurately, such as travel time and pedestrian counts.
This can be due to a lack of available sensors, or technical challenges in integrating different sensors.
When data quality is poor or has limitations under certain conditions, the department should present conclusions with an explanation of the limitations of its data quality dimensions.
It is not possible to determine if the signals program reduced congestion
Changes in travel time may be random or seasonal
Changes in travel time may be random or seasonal The department’s reviews of travel time do not consider natural travel time fluctuations that occur day to day, week to week or throughout the year. The department’s reviews also do not try to assess whether travel time changes were caused by seasonal factors or random data errors.
The primary reason we could not show an impact in our analysis was because of high week to week irregularity in travel time. We found when we analysed the data that random week to-week variations could easily be as large as any effect from a signal review.
Figure 15 gives an example of a corridor showing its travel time over 5 years. It shows that the intervention has an effect, but it is not so different to the natural flow of travel time.
For the department to reliably show impacts from signal reviews, the impacts must be large, or the department must develop a more sophisticated approach to measuring them.
Figure 15: Travel time variation in a corridor
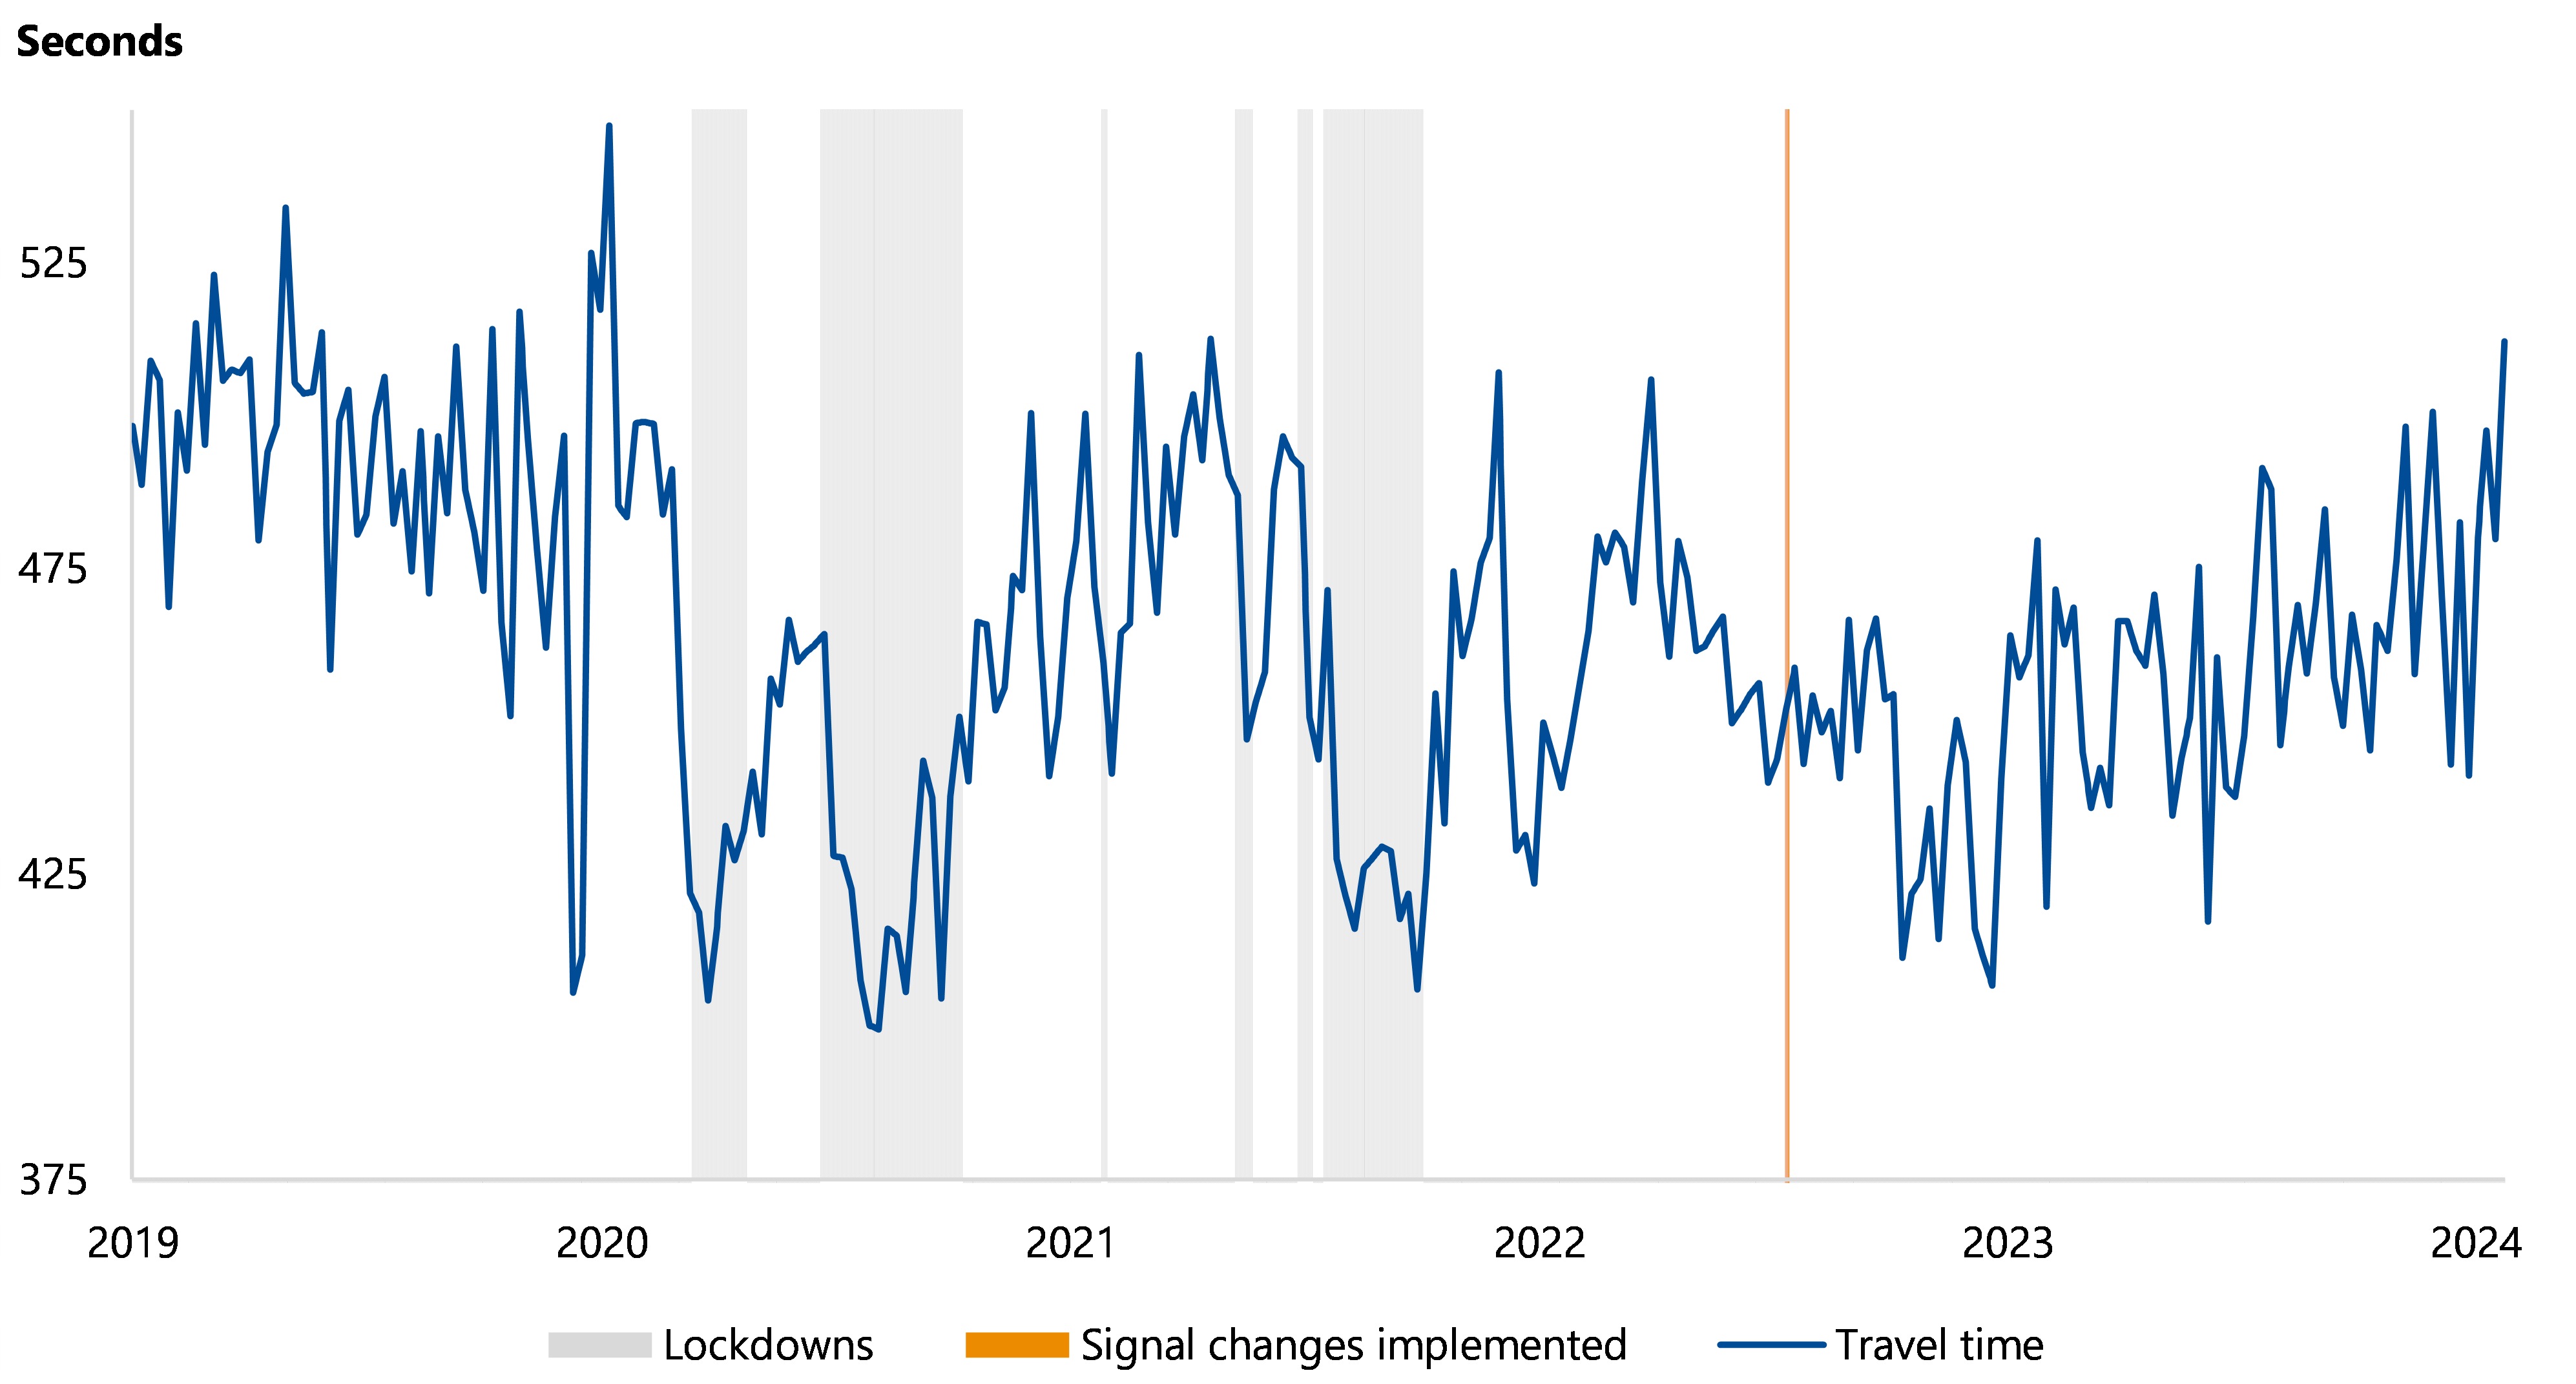
Source: VAGO.
The department needs more data analysis to show signal reviews are effective
The department's signal reports include a range of data across different modes of transport that it does not analyse at a program level.
For example, it measures travel time before and after each signal review. The department could collate and analyse this data, but it does not.
We used travel time data from the department’s data model to create a statistical model. We used our model to assess if the changes to travel time came from signal reviews.
Our model did consider random variation and cyclical trends to assess whether a signal review was likely to have had an impact.
We assessed 33 signal reviews and found that only 6, or 18.2 per cent of, corridors showed a statistically significant improvement in travel time. Further, the improvement in those 6 reviews was not constant, but limited to specific directions and time periods.
Although our evidence appears to show signal reviews show little significant improvement in travel time, our data model has limitations (see Appendix F), and caution should be exercised in drawing conclusions.
We did not analyse any data the department collected for other modes of transport.
Road travel time should not be the only measure of the benefits of signal reviews. The department needs to gather and analyse more data to understand outcomes for different modes of transport and fully measure the program's performance under the Movement and Place framework.
The authority did not have a baseline to assess the Hoddle project benefits
No baselines or targets in the benefits map
VicRoads did not include baseline values or targets in the Hoddle project benefits map.
In 2016, VicRoads collected baseline data it could have used for baselines and to update the benefits map. VicRoads did not use the data it collected.
In 2018, VicRoads’ consultant proposed confirming the baselines and targets by:
- reviewing the benefits management plan, benefits, KPIs and measures
- analysing data.
It noted that:
- the benefits outlined in the full business case were based on upgrading the whole Hoddle Street–Punt Road corridor
- the review would identify if the benefits and KPIs were still relevant given the project only involved part of the corridor.
But neither VicRoads nor the authority proceeded with this work.
Because neither agency followed the consultant's advice, they were working with a benefits management plan that did not match the scope of work.
This also meant that when the authority prepared the draft benefits assessment report in 2024, it had to:
- review the baseline data VicRoads had originally collected in 2016
- revise the preliminary targets VicRoads had set.
The data the authority used to assess Hoddle project benefits was of mixed quality
Hoddle project data quality limitations and concerns
The authority recognised and listed the limitations of the datasets it used in its draft benefits assessment report. It noted the data it used to assess the measures varied in quality and reliability.
We also assessed the data that the authority used to determine the benefits of the Hoddle project against the Department of Premier and Cabinet's Data Quality Guideline (except consistency and timeliness because they were not relevant).
Figure 16 lists the concerns we had about the data sources that the authority used to support its draft benefits assessment report.
Figure 16: Some limitations and concerns around selected data sources the authority used in its benefits assessment
| Dataset | Rating | Limitations and concerns |
|---|---|---|
| Sydney Coordinated Adaptive Traffic System | Amber | This data is usually accurate for counting vehicles but does not give any information on how many people are in them. This means the authority needs to estimate car occupancy to understand how many people are moving along or across the corridor. Both now and in 2016, the authority estimated that there was an average of one person per car. |
| Myki | Red | Myki touch on/touch off data is not reliable. It relies on people touching on and touching off every time they enter or exit the tram and it does not account for faulty readers. Myki has changed the way it records data since the Hoddle project began. This means data before and after the project should not be compared. Public transport patronage is now lower than forecast in 2016 due to COVID-19. Due to the concerns about data quality, the authority did not include the data. But this meant it could not include the number of people in trams and buses in its data on people moving through the corridor. |
| Pedestrian and cycle survey | Amber | The sample sizes that the authority used are too small to be meaningful. Package A was sampled on 2 days and Package B data on one day. This data would have large confidence intervals that may lead to variations that do not represent reality. |
| Bus data | Amber | A small number of buses are either extremely early or extremely late. Some routes have data missing and this may lead to uneven weighting when assessing overall travel times. At least 5% of departure times and 4% of arrival times are missing values. |
Note: The authority also used TomTom data (which we rated green) to assess travel time and other software, which we did not have the license to analyse. TomTom data is the best source of data for congested locations.
Source: VAGO.
The authority did not ease traffic congestion when it delivered the Hoddle project
The Hoddle project did not increase person throughput in vehicles
A more efficient transport network should relieve traffic congestion and allow more people to get to where they want to go in the shortest time possible.
The authority calls this intended benefit of the Hoddle project 'person throughput'. It assumed one person per vehicle.
When the authority completed the draft benefits assessment, 4 years after the project finished, it significantly revised the preliminary target for person throughput to reflect the funded scope of the project.
| The authority revised its person throughput target for… | From a … | To a… |
|---|---|---|
| vehicles moving north–south along Hoddle Street | 20–30 per cent increase | 6 per cent increase. |
| vehicles moving east–west across Hoddle Street | 10 per cent increase | 2 per cent increase. |
The authority did not include myki data in its person throughput calculations because of data quality issues. This means the person throughput data does not include people using public transport.
We looked at the data for person throughput in vehicles provided in the draft benefits assessment report. It did not meet either the initial or revised target at any of the 4 completed intersections:
- Johnston and Hoddle streets
- Eastern Freeway and Hoddle Street
- Brunton Avenue and Hoddle Street
- Swan Street and Punt Road.
However, it did meet the targets for people turning right onto Olympic Boulevard.
The government approved the Hoddle project business case based on the preliminary benefit targets. VicRoads did not update those targets when government agreed to fund stage 1.
Figure 17 shows the person throughput results for the Hoddle project.
Figure 17: Johnston Street and Swan Street person throughput results
| Across Hoddle Street before project | Across Hoddle Street after project | Along Hoddle Street before project | Along Hoddle Street after project | |
|---|---|---|---|---|
| Johnston Street person throughput | ||||
| Traffic AM inbound | 1,180 | 640 | 3,040 | 3,000 |
| Traffic AM outbound | 850 | 560 | 1,690 | 2,180 |
| Traffic PM inbound | 620 | 610 | 2,530 | 2,440 |
| Traffic PM outbound | 720 | 690 | 3,730 | 3,660 |
| Johnston Street total person throughput | ||||
| Total vehicles (number) | 3,370 | 2,500 | 10,990 | 11,280 |
| Difference (number) | −870 | +290 | ||
| Difference (proportion) | −25.8% | +2.6% | ||
| Swan Street person throughput | ||||
| Traffic AM inbound | 800 | 440 | 2,560 | 2,540 |
| Traffic AM outbound | 750 | 570 | 2,170 | 2,430 |
| Traffic PM inbound | 630 | 450 | 2,560 | 2,540 |
| Traffic PM outbound | 1,150 | 690 | 2,010 | 2,030 |
| Swan Street total person throughput | ||||
| Total vehicles (number) | 3,330 | 2,150 | 9,300 | 9,540 |
| Difference (number) | −1,180 | +240 | ||
| Difference (proportion) | −35.4% | +2.6% | ||
Note: Traffic volumes for person throughput are collected from Sydney Coordinated Adaptive Traffic System and assume one person per vehicle.
Source: VAGO presentation of Sydney Coordinated Adaptive Traffic System data in the authority’s 2024 draft benefits assessment report.
The Hoddle project met its other targets
The authority’s draft benefits assessment report suggests that the Hoddle project met the revised targets for all other performance indicators:
- reduce public transport travel times
- travel time variability for private/commercial vehicles all modes (north–south)
- reduce public transport travel time variability (east–west)
- reduce casualty crash rate
- reduce crash severity
- increase rates of cycling and walking along Hoddle Street.
However, these results should be considered in relation to the quality of the data, as previously discussed.
The authority could have assessed the Hoddle project differently
Although the authority completed the Hoddle project in June 2019 (before the pandemic), it says COVID-19 hindered its post-project evaluation tasks because there were not stable traffic volumes to compare with pre-COVID-19 traffic.
Under normal circumstances, the authority would evaluate a project like the Hoddle project at least 12 months after completing it. However, the authority said this period coincided with the first stages of the pandemic and Melbourne’s lockdowns. The authority says it delayed the Hoddle project evaluation to avoid this period.
Package A was completed by December 2018. But the authority also said it was rectifying construction defects that would have impacted the comparability of data at this time.
We found 3 issues with the authority’s framing of the Hoddle project draft benefits assessment.
| We note that ... | The authority could have ... | But instead, it … |
|---|---|---|
| Melbourne’s lockdowns ended in October 2021 | started assessing the benefits of the Hoddle project in October 2022 | did not complete its draft benefits assessment until February 2024 and has not yet completed a Project Evaluation Report. |
| Pre-COVID-19 traffic congestion is not comparable to today | compared data from March 2016 with data from March 2020 | compared data from March 2016 with data from August 2022. |
| acknowledged that it is problematic to compare pre and post-COVID-19 traffic data and therefore it is not possible to confirm whether the Hoddle project delivered its intended benefits | said in its draft benefits assessment report that the Hoddle project had delivered its intended benefits. |
The authority did not demonstrate the benefits of the Hoddle project
DTF guidance requires agencies to:
- monitor and measure benefit delivery when they implement an investment
- determine whether the expected benefits have been delivered.
There are several reasons why the authority could not effectively assess the benefits of the Hoddle project:
- The Hoddle project did not have a completed benefits management plan.
- VicRoads did not define baselines or targets based on detailed operational modelling.
- VicRoads collected baseline data but did not use it to update the benefits management plan. The authority used the baseline data to revise the targets in the benefits management plan for its draft benefits assessment report.
- Neither VicRoads nor the authority revised the benefits management plan to reflect that they were only delivering stage 1 of the Hoddle project.
- The COVID-19 pandemic and the lockdowns disrupted travel demand when the authority should have completed the benefits assessment report.
Despite these limitations, the authority prepared a draft benefits assessment report that found the Hoddle project delivered its intended benefits, but these findings should take into account potential data quality limitations.
However, the scope of the project that VicRoads and the authority delivered could not resolve road congestion and travel time reliability along the Hoddle Street–Punt Road corridor because it was limited to 4 intersections, not the entire corridor.
Appendix A: Submissions and comments
Download a PDF copy of Appendix A: Submissions and comments.

Appendix B: Abbreviations, acronyms and glossary
Download a PDF copy of Appendix B: Abbreviations, acronyms and glossary.
Appendix C: Audit scope and method
Download a PDF copy of Appendix C: Audit scope and method.
Appendix D: Movement and Place Framework
Download a PDF copy of Appendix D: Movement and Place Framework.
Appendix E: What did the Hoddle project deliver?
Download a PDF copy of Appendix E: What did the Hoddle project deliver?
Appendix F: Limitations of our modelling
Download a PDF copy of Appendix F: Limitations of our modelling.