Tertiary Education and Other Entities: Results of the 2011 Audits
Overview
This report covers the results of the annual audit of 106 entities from the tertiary education, sustainability and environment, health, planning and community development and local government sectors, with a financial year end other than 30 June 2011. It focuses principally on 98 tertiary education sector entities, comprising the eight public universities and their 57 controlled entities, 14 technical and further education (TAFE) institutes and their 11 controlled entities, seven training entities and the one controlled entity.
The report informs Parliament about significant issues arising from the audits of financial and performance reports and augments the assurance provided through audit opinions included in the respective entities’ annual reports.
The report comments on the effectiveness of internal controls, and for the tertiary education sector, controls over information technology (IT) security and capital project management. It also comments on the financial sustainability of universities, TAFE institutes and alpine resort management boards, and their financial management and reporting activities.
Parliament can have confidence in 100 of 103 financial reports and all performance reports that received clear audit opinions.
The internal control structures over financial reporting within audited entities were adequate, that is they enabled production of accurate, complete and reliable information for reporting. However, improved information security policies and oversight of IT systems security, including having a dedicated governance committee would improve IT security. The review of capital project management revealed that a third of tertiary education entities are not performing post-project evaluations, and 25 per cent are experiencing budget variances or delays in completion.
Tertiary Education and Other Entities: Results of the 2011 Audits: Message
Ordered to be printed
VICTORIAN GOVERNMENT PRINTER May 2012
PP No 131, Session 2010–12
President
Legislative Council
Parliament House
Melbourne
Speaker
Legislative Assembly
Parliament House
Melbourne
Dear Presiding Officers
Under the provisions of section 16AB of the Audit Act 1994, I transmit my report on Tertiary Education and Other Entities: Results of the 2011 Audits.
Yours faithfully
![]()
D D R PEARSON
Auditor-General
23 May 2012
Audit summary
This report presents the results of the 2011 audits of 106 entities mainly with a 31 December financial year end. It focuses on universities, tertiary and further education (TAFE) institutes and alpine resort management boards (ARMBs), providing detailed analysis of their internal controls, financial results and sustainability.
Clear audit opinions were issued on the financial reports of all but three entities, while all 20 performance reports received clear audit opinions. The three qualified opinions related to the financial reports of The University of Melbourne, Deakin University and the Anti-Cancer Council of Victoria. An ‘emphasis of matter’ comment was included in the opinion for a further seven entities, mainly relating to financial sustainability issues.
Conclusion
Notwithstanding some deficiencies, Parliament can have confidence in the adequacy of financial reporting and the internal controls of the entities audited.
Internal controls
We found that all universities and TAFEs operate adequate internal controls to maintain reliable financial reporting, assist with the efficiency and effectiveness of their operations and to comply with relevant laws and regulations. As part of our annual assessment of internal controls we focused on controls over information technology (IT) security and capital project management. Significant expenditure is incurred in relation to these core business activities, therefore robust systems and documented policies are required to maintain probity and maximise efficient use of public sector resources.
The tertiary education sector spent approximately $415 million on software, hardware, IT contractors and IT staff in 2011. We found that IT systems’ security was strong, as universities and most TAFEs have documented policies and procedures. However, tertiary education sector entities need to improve their information security classification policies and oversight of IT systems security, including having a dedicated committee for the governance of their IT environments. Some TAFEs did not have documented IT security policies, which is concerning given that private student information is stored electronically.
Capital project management frameworks were generally strong and all entities regularly reported to their governing bodies on capital project matters. However, our review indicated that a quarter of capital projects were either not completed within budget or on time. The opportunity to improve the management of capital projects is also being neglected, as post-project evaluations are not being performed in a third of tertiary education entities.
Financial results and sustainability
Our financial sustainability assessments of the tertiary education sector indicated that most entities are in the low risk category. However, the sector generally recorded poor self-financing indicators, with 90 per cent of entities recording a medium- or high-risk assessment. This suggests that these entities are not able to effectively fund capital programs with cash generated from their operations. This is problematic given that many of these entities have limited cash reserves to draw upon to fund future capital activities.
Universities continued to record strong financial results, with the sector generating a healthy $478.5 million surplus in 2011. Monash University and Victoria University’s financial sustainability was assessed as medium risk overall due to their poor self‑financing indicators.
The TAFE sector recorded a surplus of $100.5 million, down 32.5 per cent on 2010, partially due to a decrease in international student fee revenue. We noted that three of the 11 TAFEs that currently provide educational services to international students could not provide infromation on these students’ countries of residence or social demographics. This deficiency impacts on their ability to effectively market and tailor educational programs.
Our analysis of the TAFE funding model shows that capital grants are strategically allocated across the sector rather than progressively to each entity, with funds for asset replacement provided at government discretion. The governing body is accountable for an entity’s financial management and performance but has limited ability to make decisions around asset upgrades and replacement, with adverse implications for the adequacy of the sector’s facilities and impacting on their long-term operational performance.
Alpine resort management boards
Substantial support payments of $8.2 million contributed by the Department of Sustainability and the Environment and insurance recoveries of $1.9 million resulted in the sector achieving a $5.2 million surplus. Without these support payments there would have been an overall deficit of $4.9 million. At the smaller ARMBs, expenditure has grown faster than revenue over the past five years, with government grants representing an expanding component of total revenue.
We have concerns with the ongoing financial sustainability of the smaller boards, Lake Mountain and Mount Baw Baw. These entities recorded overall financial sustainability risk assessments of high and medium, respectively. These assessments highlight the ongoing challenge for smaller ARMBs to control their expenditure, particularly given their limited ability to increase revenue streams. The Minister for Environment and Climate Change has directed the ARMBs and the Alpine Resorts Co-ordinating Council to provide advice on an integrated financial sustainability solution for the sector.
Recommendations
- That performance reporting for the TAFE sector be elevated to legislative status.
- That universities and TAFEs continue to refine their financial reporting processes by preparing shell financial statements and adopting rigorous quality control and assurance procedures.
That tertiary education bodies:
- assess their policies and practices against the identified general internal control weaknesses to determine the adequacy of their controls, and whether they are operating reliably, efficiently and effectively
- develop comprehensive policies and procedures over information technology system security which are approved at board or council level and subject to regular review
- develop an information security classification policy that outlines criteria for assigning security classifications to information and the required security controls for each classification
- undertake periodic assessments of the adequacy of, and compliance with, information technology security requirements
- develop capital project management policies and procedures which are approved by the governing body
- undertake post-project evaluations to learn from recent projects and report findings to the governing body
- engage internal audit to conduct periodic reviews of their information technology security policies and capital project management arrangements and outcomes
- develop and maintain the capacity to monitor the country of residence and other socio-economic details of their international students to improve their marketing focus and provide appropriately structured courses.
- The Alpine Resorts Co-ordinating Council together with Lake Mountain and Mount Baw Baw alpine resort management boards should investigate the potential for implementing revised operating arrangements to improve their longer-term financial viability.
- Alpine resort management boards should continue to address commonly identified internal control weaknesses to ensure they are operating in a reliable and sustainable manner.
Submissions and comments received
In addition to progressive engagement during the course of the audit, in accordance with section 16(3) of the Audit Act 1994, relevant extracts from the report were provided to all universities, TAFEs, alpine resort management boards, the Department of Treasury and Finance, the Department of Education and Early Childhood Development and the Department of Sustainability and Environment with a request for submissions or comments.
Agency views have been considered in reaching our audit conclusions and are represented to the extent relevant and warranted in preparing this report. Their full section 16(3) submissions and comments, however, are included in Appendix E.
1 Background
1.1 Introduction
This report covers 106 entities from the tertiary education, sustainability and environment, health, planning and community development, and local government sectors, with a financial year end other than 30 June 2011. Principally it deals with the results of the audits of 98 tertiary education sector entities, comprising universities, technical and further education (TAFE) institutes, training entities and the entities that they control. The profile of these entities is set out in Figure 1A.
Figure 1A
Entities with a financial year end other than 30 June 2011
|
2011–12 |
|||||||
|---|---|---|---|---|---|---|---|
|
Balance date |
|||||||
|
Sector |
Type of entity |
2010 |
30 Sep |
31 Oct |
31 Dec |
31 Mar |
Total |
|
Tertiary Education |
University |
8 |
8 |
8 |
|||
|
Entity controlled by university |
63 |
57 |
57 |
||||
|
TAFE Institute |
14 |
14 |
14 |
||||
|
Entity controlled by TAFE Institute |
12 |
11 |
11 |
||||
|
Training entity |
6 |
7 |
7 |
||||
|
Entity controlled by training entity |
2 |
1 |
1 |
||||
|
Total Tertiary Education |
105 |
98 |
|||||
|
Sustainability and Environment |
Alpine resort |
5 |
5 |
5 |
|||
|
Health |
Charity |
1 |
1 |
1 |
|||
|
Planning and Community Development |
Trust |
1 |
1 |
1 |
|||
|
Local Government |
Company |
1 |
1 |
1 |
|||
|
Total |
113 |
1 |
5 |
99 |
1 |
106 |
|
Note: Controlled entities generally include associated companies, trusts and joint ventures.
Source: Victorian Auditor-General's Office.
This report informs Parliament about significant issues arising from the financial audits within the tertiary education and alpine resort sectors, and augments the assurance provided through audit opinions on financial reports and performance reports included in the respective entities’ annual reports.
The report comments on the quality and timeliness of financial reporting in the sector, and the financial sustainability of tertiary education bodies and alpine resort management boards. It also comments on the effectiveness of information technology security and capital project management controls in the tertiary education sector.
The other reports on the results of financial audits are outlined in Appendix C.
1.2 Financial audit framework
1.2.1 Audit of financial reports
An annual financial audit has two aims:
- to give an opinion consistent with section 9 of the Audit Act 1994, on whether financial reports are fairly stated
- to consider whether there has been wastage of public resources or a lack of probity or financial prudence in the management or application of public resources, consistent with section 3A(2) of the Audit Act 1994.
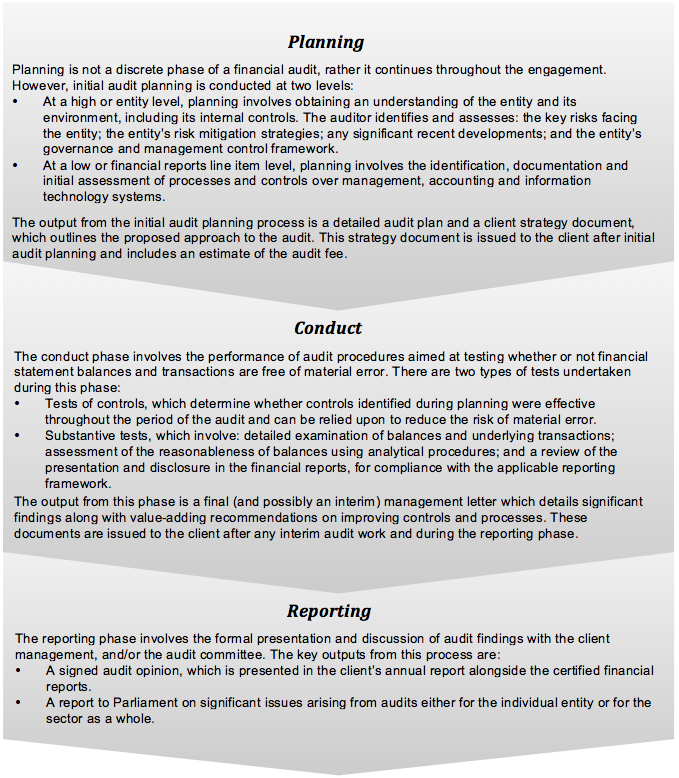
The financial audit framework applied in the conduct of the 2011 audits of tertiary education, alpine resorts and other entities is set out in Figure 1B.
Figure 1B
Financial audit framework
Source: Victorian Auditor-General's Office.
1.2.2 Audit of internal controls
An entity’s governing body is responsible for developing and maintaining its internal control framework. Internal controls are systems, policies and procedures that help an entity to reliably and cost effectively meet its objectives. Sound internal controls enable the delivery of reliable, accurate and timely external and internal financial reporting.
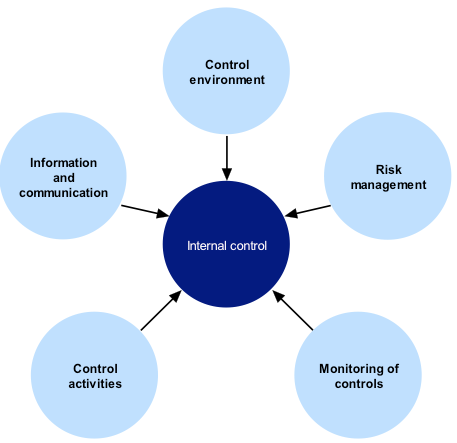
Figure 1C identifies the main components of an effective internal control framework.
Figure 1C
Components of an internal control framework
Source: Victorian Auditor-General's Office.
In the diagram:
- the control environment provides the fundamental discipline and structure for the controls and includes governance and management functions and the attitudes, awareness and actions of those charged with governance and management of an entity
- risk management involves identifying, analysing and mitigating risks
- monitoring of controls involves observing the internal controls in practice and assessing their effectiveness
- control activities are policies, procedures and practices prescribed by management to help meet an entity’s objectives
- information and communication involves communicating control responsibilities throughout the entity and providing information in a form and time frame that allows officers to discharge their responsibilities.
The annual financial audit enables the Auditor-General to form an opinion on an entity’s financial report. An integral part of this—and a requirement of Australian Auditing Standard 315 Understanding the Entity and its Environment and Assessing the Risk of Material Misstatement—is to assess the adequacy of an entity’s internal control framework and governance processes related to its financial reporting.
Internal control weaknesses we identify during an audit do not usually result in a ‘qualified’ audit opinion. A qualification is usually warranted only if weaknesses cause significant uncertainty about the accuracy, completeness and reliability of the financial information being reported. Often, an entity will have compensating controls that mitigate the risk of a material error in the financial report.
Weaknesses we find during an audit are brought to the attention of an entity’s chairperson, chief executive officer and audit committee by way of a management letter.
Section 16 of the Audit Act 1994 empowers the Auditor-General to report to Parliament on the results of audits. This report includes the results of our review of internal controls related to the financial reporting responsibilities of the tertiary education and alpine resort sectors.
1.2.3 Audit of performance reports
Section 8(3) of the Audit Act 1994 authorises the Auditor-General to audit performance indicators included in the annual reports of a public sector entity to determine whether they fairly represent the entity's actual performance.
The Auditor-General uses this authority to audit the performance reports prepared by the TAFE sector.
1.3 Audit conduct
The audits were undertaken in accordance with the Australian Auditing Standards.
The total cost of preparing and printing this report was $195 000.
1.4 Structure of this report
Details of the entities covered within each Part of this report are set out in Figure 1D.
Figure 1D
Report structure
|
Report part |
Description |
|---|---|
|
Part 2: Audit opinions and quality of reporting |
Covers the results of audits of the 2011 financial reports of eight universities, 14 TAFE institutes, seven training entities and the 69 entities that they control. It comments on the timeliness and accuracy of financial reporting in 2011. |
|
Part 3: Internal controls |
Assesses internal controls at eight universities and 14 TAFE institutions and summarises the control weaknesses commonly identified. It also comments on information technology security controls and capital project management across the tertiary education sector. |
|
Part 4: Financial results |
Analyses the financial results of eight universities and 14 TAFE institutes, including financial performance for 2011 and financial position at 31 December 2011. It also comments on movements and trends in international student fee revenue. |
|
Part 5: Financial sustainability |
Provides insight into the financial sustainability of eight universities and 14 TAFE institutes obtained from analysing the trends in five sustainability indicators over a five-year period. |
|
Part 6: Alpine resorts |
Covers the results of five alpine resort management boards which have a 31 October 2011 balance date, including financial performance and position. It also provides insight into the financial sustainability of the sector. |
Source: Victorian Auditor-General's Office.
2 Audit opinions and quality of reporting
At a glance
Background
This Part covers the results of the audits of the 2011 financial reports of eight universities and their 57 controlled entities, 14 technical and further education (TAFE) institutes and their 11 controlled entities, seven training entities and the one entity they control and other entities with a financial year ended on 31 December 2011.
Findings
- Overall, the financial report preparation processes of universities and TAFEs are adequate. They produced accurate, complete and reliable information.
- Financial reporting quality would still improve if entities prepared shell financial statements early to identify issues to be resolved, undertook rigorous analytical review and quality assurance procedures, and prepared materiality assessments.
- The financial reports of all but three entities received clear audit opinions:
- Deakin University and The University of Melbourne were again qualified due to their accounting treatment for non-reciprocal research and capital grants.
- Anti-Cancer Council of Victoria received a qualified audit opinion due to the inherent risks associated with cash donations.
- All 20 performance reports receivedclear audit opinions (20 in 2010).
Recommendations
- That performance reporting for the TAFE sector be elevated to legislative status.
- That universities and TAFEs continue to refine their financial reporting processes by preparing shell financial statements and adopting rigorous quality control and assurance procedures.
2.1 Reporting framework
2.1.1 Financial reporting
This Part covers the results from the audits of 98 universities, tertiary and further education (TAFE) institutes and controlled entities for the 2011 reporting period, as shown in Figure 2A. Each of the audited entities must prepare its financial report in accordance with Australian Accounting Standards, including the Australian Accounting Interpretations.
Figure 2A
Tertiary education entities
|
Type of entity |
2010 |
2011 |
|---|---|---|
|
Universities |
8 |
8 |
|
Entities controlled by universities |
63 |
57 |
|
TAFE institutes |
14 |
14 |
|
Entities controlled by TAFE institutes |
12 |
11 |
|
Training entities |
6 |
7 |
|
Entities controlled by training entities |
2 |
1 |
|
Total |
105 |
98 |
Note: Controlled entities generally include associated entities, trusts and joint ventures.
Source: Victorian Auditor-General's Office.
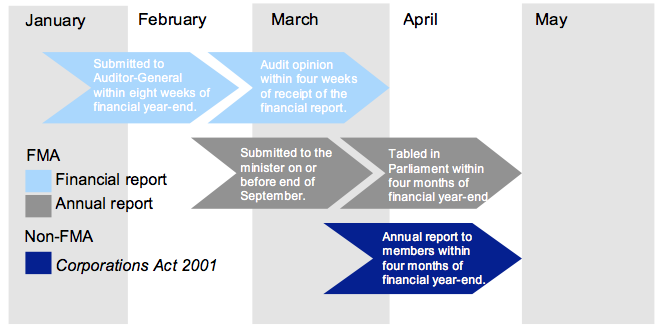
The principal legislation governing financial reporting by the tertiary education sector is the Financial Management Act 1994 (FMA) and the Corporations Act 2001. Appendix D details the legislative framework applying to each tertiary education sector entity.
Figure 2B
Legislative reporting time frames
Source: Victorian Auditor-General's Office.
2.2 Audit opinions issued
At 11 May 2012, audit opinions had been issued on 94 education bodies and controlled entities’ financial statements for the financial year ended 31 December 2011. The audits of four of the controlled entities were still to be finalised.
Independent audit opinions add credibility to financial reports by providing reasonable assurance that the information is reliable. A clear audit opinion confirms that the financial report has been prepared according to the requirements of relevant accounting standards and legislation. A qualified audit opinion means that the financial report is materially different to the requirements of the relevant reporting framework or accounting standards, and is less reliable and useful as an accountability document.
Qualifications
Three qualified audit opinions were issued for the 2011 financial year (three for 2010).
The University of Melbourne and Deakin University again received qualified audit opinions because their accounting treatment of non-reciprocal research and capital grant income as a liability was not in accordance with Australian Accounting Standards. Accounting standards require grants which are non-reciprocal in nature to be recognised as revenue in the year they are received—when the entity gains control of the funds.
The ongoing qualified opinion issued to the Anti-Cancer Council of Victoria is generally attached to the financial reports of entities with significant voluntary fundraising activities. The qualification draws attention to the risk inherent in management assuring the complete recording of cash collected through donations. The risk is unavoidable and cannot be cost-effectively mitigated by further internal controls.
Emphasis of matters
In certain circumstances an audit opinion may draw attention to, or emphasise, a matter that is relevant to the users of an entity’s financial report but does not warrant a qualification.
Audit opinions on the financial reports of Monash Educational Enterprises, Monash South Africa Ltd, RMIT Drug Discovery Technologies and the Driver Education Centre of Australia Ltd contained an ‘emphasis of matter’ comment. The comment emphasised each entity’s reliance on continuing financial support from its parent entity to sustain its operations.
At 31 December 2011, Monash Educational Enterprises and Monash South Africa Ltd together owed $41.6 million to Monash University. Monash University has indicated that it is not its current intention to require repayment of these funds. The going concern assumption would be invalid without this continuing financial support.
The Driver Education Centre of Australia Ltd (DECA) had total liabilities of $4 million, a working capital deficit of $2.3 million at 31 December 2011 and reported an operating deficit of $0.1 million for 2011. Skills Victoria, an office of the Department of Education and Early Childhood Development, has agreed to financially support DECA to enable it to meet its current and future obligations.
RMIT Drug Discovery Technologies Pty Ltd has made net operating losses since it was established in 2007, including a $1.1 million operating loss in 2011. The entity has been sold post-signing but the transaction has not yet been settled.
2.2.1 Performance reports
In 2011 and 2010, clear audit opinions were issued on all 20 performance reports submitted for audit.
2.3 Quality of reporting
2.3.1 Introduction
The quality of an entity’s financial reporting can be measured by the timeliness and accuracy of the preparation and finalisation of its financial report. To achieve cost‑effective financial reporting, tertiary education bodies and their controlled entities need to have well planned and managed financial report preparation processes.
Entities should aim for the better practice elements detailed in Figure 2C to assist them to produce a complete, accurate and compliant financial report within the legislative time frame.
Figure 2C
Selected better practice – financial report preparation
|
Key area |
Better practice |
|---|---|
|
Financial report preparation plan |
Establish a plan that outlines the processes, resources, milestones, oversight and quality assurance practices required in preparing the financial report. |
|
Preparation of shell statements |
Prepare a shell financial report and provide it early to the auditors to enable early identification of amendments, minimising the need for significant disclosure changes at year-end. |
|
Materiality assessment |
Assess materiality, including quantitative and qualitative thresholds, at the planning phase in consultation with the audit committee. The assessment assists preparers to identify potential errors in the financial report. |
|
Monthly financial reporting |
Adopt full accrual monthly reporting to assist in preparing the annual financial report. This allows for the year-end process to be an extension of the month-end process. |
|
Rigorous quality control and assurance procedures |
Require review of the supporting documentation, data and the financial report itself by an appropriately experienced and independent officer prior to providing to the auditors. |
|
Supporting documentation |
Prepare high-standard documentation to support and validate the financial report, and provide a management trail. |
|
Rigorous analytical reviews |
Undertake rigorous and objective analytical review during the financial report preparation process to help improve the accuracy of the report. |
|
Reviews of controls/ self-assessment |
Establish sufficiently robust quality control and assurance processes to provide assurance to the audit committee on the accuracy and completeness of the financial report. |
|
Competency of staff |
Require that preparers of the financial report have a good understanding of, and experience in applying, relevant accounting standards and legislation. Require that they also have project management and interpersonal skills. |
|
Financial compliance reviews |
Undertake periodic compliance reviews to identify areas of noncompliance or changes to legislation that impact the financial report. |
|
Adequate security |
Protect and safeguard sensitive information throughout the process to prevent inappropriate public disclosure. |
Source: Victorian Auditor-General's Office and Australian National Audit Office Better Practice Guide: Preparation of Financial Statements, June 2009.
2.3.2 Quality of financial reporting
As shown in Figure 2D, the overall quality of financial reporting has substantially improved in 2011 from 2010.
Figure 2D
Quality of financial reporting in 2011
|
Universities |
TAFEs |
Total |
||||
|---|---|---|---|---|---|---|
|
Quality of financial reporting |
(%) |
(no.) |
(%) |
(no.) |
(%) |
(no.) |
|
Improved from previous year |
50 |
4 |
50 |
7 |
50 |
11 |
|
Same as previous year |
50 |
4 |
43 |
6 |
45 |
10 |
|
Worse than previous year |
0 |
0 |
7 |
1 |
5 |
1 |
|
Total |
100 |
8 |
100 |
14 |
100 |
22 |
Source: Victorian Auditor-General's Office.
The assessment of performance was against better practice criteria using the following scale:
- no existence—function not conducted by the entity
- developing—partially encompassed in the entity's financial reporting preparation processes
- developed—entity has implemented the process, however, it is not fully effective or efficient
- better practice—entity has implemented processes which are effective and efficient.
Despite the improvements that have been made, VAGO found that eight entities (36.4 per cent) have consistently indicated they were still ‘developing’ their financial statement preparation processes over the past three years. This is of concern as these entities show little or no significant progress in the development of financial statement preparation processes over a substantial period of time.
The results of our analysis are summarised in Figure 2E.
Figure 2E
Results of assessment of report preparation processes against better practice elements
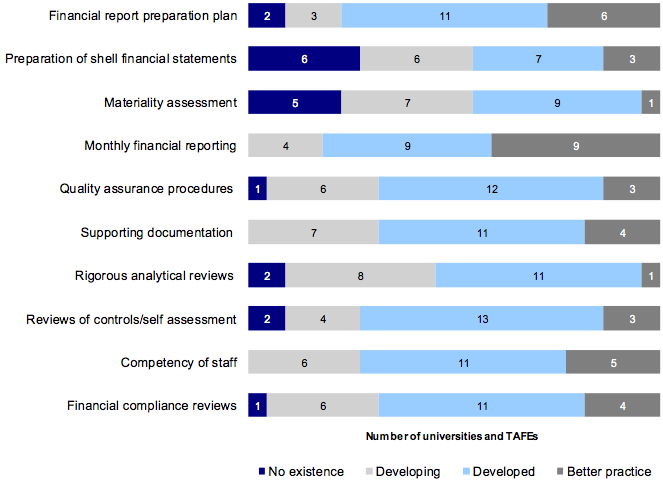
Source: Victorian Auditor-General's Office.
The developed or better practice elements commonly shared by university and TAFE entities included:
- monthly financial reporting
- financial report preparation plan
- reviews of controls/self-assessment
- competency of staff.
Further improvement is needed in relation to:
- rigorous analytical reviews
- materiality assessment
- preparation of shell financial statements.
Improving these areas will assist the timely preparation of financial reports and early detection and correction of errors.
2.4 Timeliness of reporting
Recognising the importance of financial reports in providing accountability for the use of public monies, entities should prepare and publish their financial information on a timely basis. The later the reports are produced and published after year-end, the less useful they are for stakeholders and for informing decision-making.
Figure 2F shows that the average time taken by tertiary education entities to finalise their financial reports has improved from 11.4 weeks in 2010 to 10.3 weeks in 2011.
For 2011, 88 per cent or 86 of the 98 tertiary education entities achieved the 12-week time frame. This was an improvement on 2010, when 78 per cent met the 12-week requirement.
Figure 2F
Average time to finalise financial reports for tertiary education entities
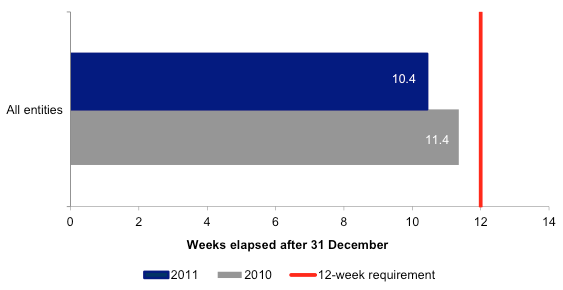
Source: Victorian Auditor-General's Office.
Recommendations
- That performance reporting for the TAFE sector be elevated to legislative status.
- That universities and TAFEs continue to refine their financial reporting processes by preparing shell financial statements and adopting rigorous quality control and assurance procedures.
3 Internal controls
At a glance
Background
Comprehensive internal controls help entities reliably and cost-effectively meet their objectives. Effective internal controls are a prerequisite for the delivery of reliable, accurate and timely external and internal financial reports.
Findings
- Internal controls over segregation of duties, maintenance of masterfiles, account reconciliations and employee leave management can be improved.
- Information technology (IT) systems’ security was strong, particularly around documented policies, physical access controls and the adequacy of IT training. Deficiencies were noted mainly at tertiary and further education (TAFE) institutes relating to monitoring compliance, governance, oversight and IT security classification policies.
- Capital project management frameworks are strong, but could be improved by undertaking post-project evaluations to enhance future processes, and engaging internal audit to perform regular reviews of capital project management arrangements.
- A quarter of capital projects across the tertiary education sector were subject to delays in completion or budget overruns.
Recommendations
That tertiary education bodies develop comprehensive policies for IT systems security, information classification security controls and capital project management. These policies should be regularly reviewed by the governing university council or TAFE board.
Universities and TAFEs could improve their processes and practices by engaging management and internal audit to undertake periodic assessments of IT security and capital project management arrangements, and completing post-project evaluations on larger capital projects. The results of these reviews should be reported to the governing body.
3.1 Introduction
Comprehensive internal controls help entities reliably and cost-effectively meet their objectives. Effective internal controls are a prerequisite for the delivery of reliable, accurate and timely external and internal reports.
In our annual audits we focus on the internal controls relating to financial reporting and assess whether entities have managed the risk that their financial statements will not be complete and accurate. Poor controls diminish management’s ability to achieve their entity’s objectives and comply with relevant legislation. They also increase the risk of fraud.
Universities and tertiary and further education (TAFE) governing bodies are responsible for developing and maintaining adequate systems of internal control to enable:
- preparation of accurate financial records and other information
- timely and reliable external and internal reporting
- appropriate safeguarding of assets
- prevention or detection of errors and other irregularities.
The enabling legislation for each of the eight universities we audit is similar and requires management to implement an internal control structure. For TAFE institutes, the Education and Training Reform Act 2006 requires management to implement an internal control structure.
In this Part we report on aspects of internal controls in the state’s eight universities and 14 TAFEs. We specifically address:
- general internal controls
- controls over information technology (IT) security
- controls over capital projects.
3.2 General internal controls
All universities and TAFEs have adequate internal controls to maintain the reliability of financial reporting, the efficiency and effectiveness of their operations and compliance with relevant laws and regulations. Nevertheless, we identified a number of instances where important internal controls need to be strengthened. These matters were reported to the related entity’s governing body and management team.
The commonly identified areas that require improving were:
- segregation of duties
- maintenance of masterfiles
- quality of account reconciliations
- excess leave balances.
3.2.1 Segregation of duties
One of the principal control mechanisms for sound financial management involves the segregation of key accounting roles between multiple personnel. The benefit of segregation of duties is that it maximises accountability and mitigates the risk of fraud or error in processing transactions. Critical accounting functions, such as the maintenance of vendor masterfiles and the payment of employees or suppliers are important roles which should be performed independently by staff.
A key component of segregation of duties is the timely completion of reviews, particularly over data input and processing of sensitive data. Timely reviews decrease the risk that errors may go undetected or may not be resolved in a timely manner, both of which can adversely impact on the accuracy of periodic financial reporting.
Throughout the tertiary education sector, there were a number of control weaknesses in this area, which put the integrity of the underlying financial systems at risk. These included:
- independent review over payroll functions not conducted
- lack of segregation of duties over vendor masterfile changes
- bank reconciliations not reviewed
- bank reconciliations and fixed asset reconciliations not reviewed in a timely manner.
3.2.2 Maintenance of masterfiles
Financial systems, such as accounts payable and payroll systems, rely on the maintenance of standing data on masterfiles to enable reliable processing of individual payments. Masterfile data can include details such as name, address, pay rates and bank account information.
Masterfiles can also include access or authority details for staff, listing who has been granted access to certain functions, or where authority for financial responsibilities has been delegated.
It is important that all changes made to standing data on masterfiles are checked for completeness, accuracy and legitimacy. Otherwise subsequent processing errors can be repeated many times over or data integrity reduced. Further, it is important that masterfiles are kept up to date and data reviewed periodically:
- to maintain accurate and current details
- for the detection and timely correction of unintentional or fraudulent changes
- to guard against payments to unauthorised suppliers or unauthorised adjustments to pay rates.
A number of instances of control weaknesses in masterfile maintenance were identified across the tertiary education sector, including:
- lack of independent review of changes to vendor masterfile
- former employees listed as current signing authorities
- unauthorised staff with uncontrolled access to operating systems and databases
- lack of audit trail for changes made to bank account details in employee masterfile.
3.2.3 Quality of account reconciliations
A financial report is generally prepared based on information captured in an entity’s general ledger, with key balances within the general ledger often supported by information recorded in subsidiary ledgers such as accounts payable, billing, fixed assets and payroll systems. Periodic reconciliation of the general ledger with subsidiary ledger balances is vital to confirm the completeness and accuracy of data.
Timely preparation and independent review of key account reconciliations decreases the risk that errors may go undetected or may not be resolved in a timely manner, both of which can adversely impact on the accuracy of periodic financial reporting.
While entities were generally performing key account reconciliations, we found a number of exceptions across the tertiary education sector, including reconciliations that:
- were not prepared, either in a timely manner or at all
- lacked sufficient detail for them to be meaningful
- although marked as complete and reviewed still contained significant errors
- contained long outstanding unreconciled amounts, with no indication of when they would be cleared or why they were still listed.
3.2.4 Excess leave balances
Universities and TAFE institutions have policies dealing with employee leave balances, which stipulate certain limits to leave balances that an employee can accrue at any given time. These limits are determined in the context of industrial agreements applying to the employer. Leave management is important, as large balances can present significant current and future liabilities to an organisation.
Incidences of excess leave balances may indicate understaffing, or an unhealthy reliance on particular staff to perform their functions. There is also a risk that long periods without absences may not encourage information sharing and can result in significant payouts when staff cease working with an organisation. Where significant leave balances are being accrued, it may also foster an environment where opportunities for fraudulent behaviour are created.
There were instances throughout the tertiary education sector where a significant number of staff had excess annual and long service leave balances. Where these were identified, entities were encouraged to develop leave management policies to reduce these balances, and better manage employee leave accruals in the future.
3.2.5 Other control weaknesses identified
A number of other control weaknesses were identified during the course of the 2011 audits. These included:
- poor controls over the upload of student payment reports into a student management system
- lack of review of repair and maintenance accounts for incorrect capital inclusions
- non-compliance with standing directions of the Minister for Finance in relation to the requirements for investment of cash balances
- poor controls around receipting processes
- flaws in management reporting and budgeting processes.
3.3 Controls over information technology security
IT security controls relate to the protection of computer applications, infrastructure and IT assets from a wide range of security and access threats. Such controls promote business continuity, minimise business risk, reduce the risk of fraud and error and help meet business objectives.
There is extensive reliance placed on information systems across the sector, and a critical aspect of this is the continuous upgrade and replacement of systems to improve information management and the quality of services provided to students.
Information held by universities and TAFEs about students, and the financial and operational aspects of the business can be highly sensitive. It needs to be protected from unauthorised access, theft or manipulation. With the implementation and upgrade of new IT systems, and the increasing sophistication of external threats, new security risks to the IT environment continue to arise.
Inadequate IT security can result in:
- unauthorised access to systems and information
- privacy breaches
- loss of critical business information assets
- material misstatements in financial statements
- disruptions to the delivery of essential educational services that are dependent on IT interfaces
- increased potential for fraud
- damage to the reputation of an agency.
IT systems security in both the University and TAFE sectors was generally strong, particularly around documented policies and procedures, effective physical access controls and the adequacy of IT training. Overall the IT environments were adequate for the security of sensitive data and the reliability of financial information, and the majority of entities IT security processes had been subject to internal audit review.
However deficiencies were noted relating to the governance and oversight of IT systems security and IT security classification policies. Also, some entities did not have approved IT security policies, which is concerning given the size of their operations and IT expenditure programs.
At 31 December 2011 the tertiary education sector reported $167 million of IT infrastructure assets at their depreciated value (31 December 2010, $177 million). Depreciation on those assets for the year was $58 million (2010, $47 million).The significance of IT security is highlighted with the tertiary education sector spending approximately $415 million on software, hardware, IT contractors and IT staff in 2011 (2010, $403 million). The breakdown of IT related expenditure is reproduced in Figure 3A.
Figure 3A
IT expenditure components
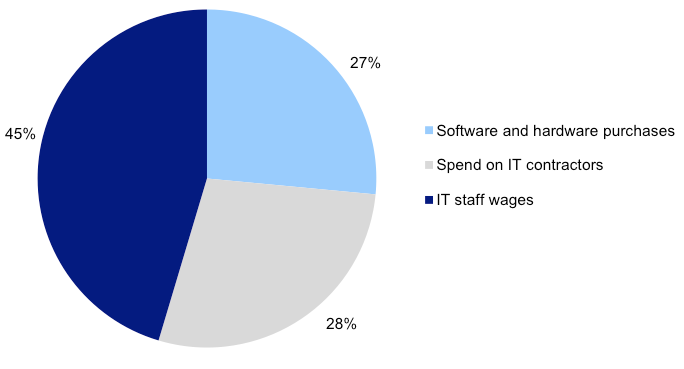
Source: Victorian Auditor-General's Office.
The chart highlights that the majority of IT expenditure relates to personnel costs (73 per cent), relating to operating, developing and maintaining infrastructure systems.
3.3.1 Information technology security framework
Controls over IT security can be placed into two categories:
- general controls—entity-wide controls which are pervasive to many applications and support the effectiveness of application controls
- application controls—manual or automated procedures that apply to the processing of transactions through individual applications and serve to protect the completeness, accuracy and security of information.
Our review focuses on the general or entity-wide security controls.
Figure 3B outlines the key components of an effective IT security framework. It draws on the:
- Department of Treasury and Finance’s Whole of Victorian Government Information Security Management Framework
- Standing Directions of the Minister for Finance under the Financial Management Act 1994
- International Standard Organisation’s ISO27001:2006, Specification for Information Security Management
- the Information Systems and Control Association’s best practice guidelines.
The IT security framework provides entities with a comprehensive approach to the management of their IT security arrangements.
Figure 3B
Key elements of an effective IT security framework
|
Component |
Key elements |
|---|---|
|
Policy |
IT security policies that include:
An information security classification policy that provides:
Policies reviewed by the information security committee or the IT steering committee. Policies approved by the board. |
|
Management practices |
Adequate training for staff about IT security. IT risk register developed and maintained. Policies and procedures regularly reviewed and updated. Establishment and monitoring of the operation of:
Periodic reporting on the status of IT systems and security arrangements, to the board. |
|
Governance and oversight |
IT security committee to oversee the development and update of security strategies, standards, policies and procedures, and to monitor mitigation of risks. IT steering committee to advise management on IT acquisitions and provide guidance on the provision of IT services. Adequacy of IT security arrangements reviewed and tested periodically by internal audit or consultants. Monitoring compliance with policies and procedures by management and the board. |
Source: Victorian Auditor-General's Office.
3.3.2 Information technology security policies
Universities and TAFEs store, process and communicate large volumes of information electronically. Effective IT security controls mitigate the risk that this information could be inappropriately accessed, or that information necessary for efficient functioning will be incomplete or inaccurate.
IT systems should be supported by security policies and procedures that control access, and require monitoring and reporting on compliance with organisational policies and procedures.
Existence of information technology security policies
Twenty of the 22 tertiary education bodies (91 per cent) had a documented IT security policy. Documented IT security policies did not exist at two of the TAFEs (14 per cent), however, these entities were in the process of drafting a policy at 31 December 2011.
Where IT security policies had been established, they were generally comprehensive, incorporating most of the better practice elements set out in Figure 3B. Across the tertiary education sector, policies commonly incorporated the following better practice elements:
- consequences of information security policy violations—95 per cent
- compliance with legislative, regulatory and contractual requirements—90percent
- incident management processes—90 per cent
- human resources and user access security—90 per cent
- communication and connectivity management processes—90 per cent
- asset management and allocation processes—80 per cent.
Conversely, the following better practice elements were not incorporated into the IT security policies at a significant number of tertiary education bodies:
- business continuity management practices—35 per cent
- acquisition, development and maintenance—30 per cent
- security education, training and awareness—30 per cent.
Each of these aspects if not properly addressed can have far reaching impacts in the event that IT systems are compromised. Of particular concern was that just four of the eight universities had covered security education, training and awareness in their IT security policies.
Board approval of policy
IT security is a contemporary issue and should be a concern to members of university councils and TAFE governing boards, who are ultimately accountable. Seven of the eight universities (88 per cent) with an IT security policy obtained governing council approval. Nine of the 12 TAFEs (75 per cent) with an IT policy had it approved by their board.
Review of information technology policies
IT policies need to be periodically updated to keep up with changes in the development of IT systems and the increasing complexity of IT environments. It was positive to note that where IT security policies had been established, 80 per cent had been reviewed and updated at least once in the past three years.
Information security classification policy
An information security classification policy outlines criteria for assigning security classifications to information and the required security controls for each classification, to limit access to sensitive information by unauthorised parties.
Eleven of the 22 tertiary education bodies (50 per cent) had an information security classification policy. Five were universities and six were TAFEs. Four of the 22 tertiary education bodies (18 per cent) were developing an information security classification policy.
Figure 3C shows the information classification security policy status across the tertiary education sector. This shows that the TAFE sector is lagging in developing and approving information security classification policies.
Figure 3C
Information Classification Security Policy status
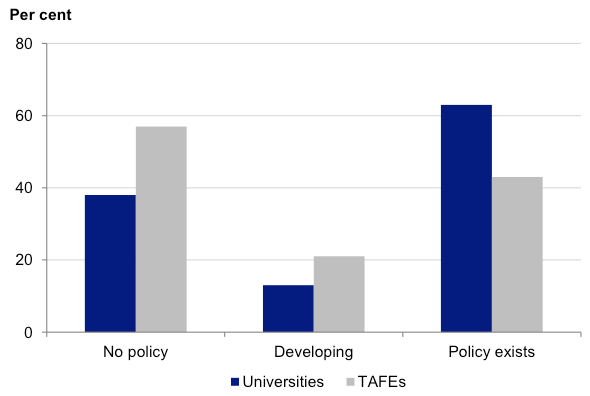
Source: Victorian Auditor-General's Office.
This low rate of security classification policy establishment increases the risk of security access violations. Across the tertiary education sector there is a risk that confidential and sensitive information may be easily accessible to parties with no authority to obtain such information, thus compromising student privacy and the security, completeness and accuracy of business information.
3.3.3 Management practices
Training
Training of staff is a critical component of implementing and maintaining IT security. Proper training enhances understanding of endorsed policies and procedures, and enables their correct and consistent application. Training can also highlight to staff the areas of greatest concern.
Fifteen of the 22 tertiary education bodies (68 per cent) had conducted training for staff on IT security policies and procedures. The level of training provided was comparable across both the university and TAFE sectors.
Logical access and physical access controls
Logical access controls such as passwords restrict access to information on computer systems to people with the appropriate level of authorisation.
Physical access controls act to protect unauthorised access to information and hardware. Examples include requiring pass cards to enter buildings, locking offices at night, storing servers in secured data centres and keeping laptop computers locked up when not in use.
Based on a high-level review, physical security controls over IT systems at the 22 tertiary education bodies were generally considered to be adequate.
Change management controls
Replacing and upgrading systems should lead to better management of information. However, the process of implementing changes to existing systems and transferring information from old systems to new poses a significant risk to information security. Effective controls over such changes are important to protect the integrity of data and any information transferred.
Twenty one of the 22 tertiary education bodies (95 per cent) had adequate controls, and processes to manage changes to IT systems. Of these, three of the TAFEs (21 per cent) relied on change management controls established by their external IT service providers. These organisations outsource the hosting of core finance applications, with the service providers responsible for providing an appropriate change management framework. However, each TAFE is still responsible for the change management controls.
In the case of one TAFE institute there were no established controls around the reconciliation of information before and after system upgrades.
Backup and recovery procedures
Tertiary education bodies handle large volumes of important and sensitive information, the loss of which would cause significant problems for both students and these entities. In order to protect this information, it is essential that universities and TAFEs have appropriate backup and recovery procedures in place. These procedures should be tested regularly to check that they work as intended.
The Standing Directions of the Minister for Finance require entities to maintain up‑to‑date backups for all financial management systems and data being used.
We found that the backup and recovery procedures were adequate at all tertiary education bodies. Three TAFE institutes relied on the backup procedures established by their IT service providers, and in most instances these were performed daily.
Management of information technology risks
The Standing Directions of the Minister for Finance outline the government’s expectations with respect to IT risk assessments and financial management impacts. All public sector agencies are also required to identify and manage their risks within the Victorian Government Risk Management Framework.
A risk assessment will identify key information assets and perceived security threats, and assess them based on probability and the risk appetite of the entity. This enables mitigation strategies to be put in place focusing resources on the most highly rated IT risks, reducing the probability of these occurring and the severity of their impact.
Of the 22 tertiary education bodies, we found that 20 (91 per cent) had adequate IT risk management practices, with:
- fourteen (70 per cent) managing IT risks through an IT risk register
- six (30 per cent) including IT risks in the organisation’s overall risk register as part of their risk management framework.
The two remaining tertiary education bodies (9 per cent) had not included IT security as a risk in their risk register. These were moderate to small-sized TAFEs, but given their annual combined turnover of at least $75 million and the sensitive information maintained, it is concerning that a documented and approved IT risk identification process was not in place.
3.3.4 Governance and oversight
Establishment of an information technology steering committee
Best practice across the public sector is to establish specialist committees for the governance of an entity’s IT environment. The functions of an IT steering committee include advising management on IT investment requirements and providing guidance on the provision of IT services.
Of the 22 tertiary education bodies, six (32 per cent) did not have an IT steering committee. These were all TAFE institutes, whereas all eight of the universities had an IT steering committee.
Where there was no separate committee, the function was commonly performed by the respective TAFE board. This does not seem appropriate for these six TAFEs that are responsible for a range of complex activities and expenditure ranging from at least $27 million up to over $150 million per annum. There is a risk that inadequate focus will be given to IT security by the governing body.
Monitoring compliance with policies and procedures
Governing councils and boards are responsible for reviewing the adequacy of IT security and assessing compliance with relevant internal policies. Responsibilities of TAFE boards are contained within the Financial Management Act 1994, while university council responsibilities are stipulated by the individual enabling legislation of each university.
Governing bodies at seven of the 22 tertiary education bodies (32 per cent) had not established arrangements to monitor compliance with IT policies and procedures. This included two of the eight universities (25 per cent), and five of the 14 TAFE institutes (36 per cent). The lack of monitoring increases the risk that any breaches will not be identified and mitigated in a timely manner, or at all.
Where compliance monitoring updates were provided to the governing council or board they were most commonly undertaken through internal audits and monitored by the audit committee.
Internal audit
Reviews of IT security controls and compliance with policies and procedures are necessary for identifying control weaknesses, potential process improvements and training needs. Such reviews can provide management and the governing body with assurance over the entity’s IT security arrangements and assist them in meeting their monitoring obligations.
Five of the 22 tertiary education bodies (23 per cent) had not had an internal audit of their IT security arrangements during the past three years. This included three of the eight universities (38 per cent) and two of 14 TAFE institutions (14 per cent).
3.4 Controls over capital projects
Controls over capital projects relate to the processes involved in undertaking capital expenditure programs and the construction of infrastructure and other fixed assets. Such controls promote effective capital investment, minimise cost inefficiencies, reduce the risk of fraud and error and help meet business objectives.
There are extensive capital project developments across the tertiary education sector, as organisations commit funding for the replacement of existing buildings and expansion of current facilities to improve the quality of services provided to students and research capacity. This increased expenditure largely reflects Commonwealth Government initiatives to increase student participation and access. In 2011 the sector planned to spend approximately $1.0 billion on new capital projects.
Capital project management frameworks in the tertiary education sector were considered to be effective, particularly around the scope and coverage of those documented policies in existence.
However, deficiencies were noted relating to some governance areas and post-project reviews. Also, some entities did not have documented capital project management policies, which is concerning given the size and scope of their capital programs.
Figure 3D provides a summary of the actual capital expenditure across the tertiary education sector for 2009 and 2010, and the planned capital expenditure for 2011.
Figure 3D
Capital expenditure incurred
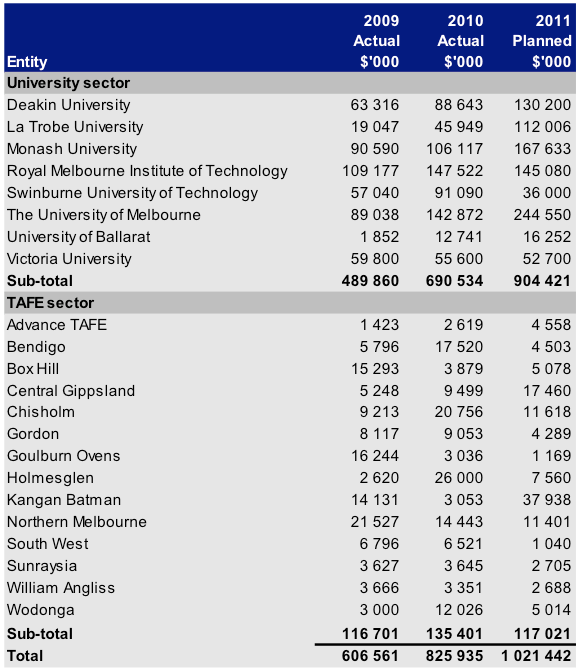
Note: Planned figures for 2011 were obtained during the course of the 2011 audits.
Source: Victorian Auditor-General's Office.
Figure 3D highlights the significant level of capital spending undertaken during the past three years, particularly in the university sector. The growth in capital expenditure in 2011 also largely relates to the university sector, which has seen a number of large building and redevelopment projects undertaken, particularly at The University of Melbourne, La Trobe University, Deakin University and Monash University. These high levels of capital expenditure need to be supported by appropriate policies and procedures, to ensure the timely completion of projects within budget, and accurate reporting of costs incurred.
At 31 December 2011, tertiary education entities had total assets of $16.6 billion, with buildings, plant and equipment accounting for $9.0 billion or 54 per cent of the total asset base. Most of the remaining balance consisted of land holdings.
The effective management of capital projects is critical given the materiality of buildings, plant and equipment and the extensive capital expenditure program.
Inadequate management and control over capital projects can result in:
- budget overruns
- delays in project delivery
- inefficient allocation of resources
- project benefits and outcomes not achieved.
Financial and timing outcomes
Our review of the capital expenditure programs across the tertiary education sector for 2011 indicates that a significant number of projects are experiencing delays and budget overruns. Based on our high level review of 158 projects, we were advised that approximately 15 per cent of capital projects had experienced variations from original budgets and 27 per cent of capital projects had experienced delays based on the original planned completion date.
Factors contributing to the delays and budget overruns included:
- underestimation of the size and complexity of the project
- quality and preparation issues
- project defects
- scope changes.
3.4.1 Capital project management framework
Figure 3E outlines the key components of an effective capital project management framework. It draws on the:
- Department of Treasury and Finance’s Gateway Review Process
- Standing Directions of the Minister for Finance under the Financial Management Act 1994.
It provides entities with a comprehensive approach to managing their capital project management arrangements.
Figure 3E
Key elements of an effective capital projects management framework
|
Component |
Key elements |
|---|---|
|
Policy |
Capital project management policies established and include:
Policy regularly reviewed and approved by governing body or subcommittee. Policy and procedures comply with the directions and policy of state government. |
|
Management practices |
Executive management monitors capital projects through checking that:
Project costs are processed timely and accurately within supporting ledgers. Post-project evaluation completed and learnings consolidated and used in practice. Comprehensive and regular reporting to the governing body or subcommittee. |
|
Governance and oversight |
The governing body or subcommittee monitor:
Policies and procedures are regularly reviewed, updated and approved by the governing body or subcommittee. |
Source: Victorian Auditor-General’s Office.
We assessed the universities and TAFEs capital project management frameworks against the above key elements.
3.4.2 Capital project management policies
Capital projects should be supported by policies that effectively control the ongoing capital project management process. These policies should be monitored and reported on to assure compliance, and to identify any necessary changes.
Existence of policies
Eighteen of the 22 tertiary education bodies (81 per cent) had a documented capital project management policy. Formal capital project management policies did not exist at four TAFEs (29 per cent). However, one of these was drafting a policy at 31 December 2011. Given the size of the asset bases of these four entities, totalling $549 million, and their collective annual capital works programs of over $15 million per annum, it is important that all entities have documented capital project management policies.
Of the 10 TAFEs who had a documented capital project management policy, two relied on the Capital Infrastructure Guidelines published by the Victorian Skills Commission, rather than independently developing a capital management framework. While these guidelines represent a sound base for developing policy, they are not tailored to the specific operations of the entity, and have not been reviewed since February 2008. This reinforces the importance of entities developing their own internal policies to ensure ongoing relevance.
Where capital project management policies had been established, they were generally comprehensive, incorporating most of the better practice elements set out in Figure 3E. Across the tertiary education sector, policies commonly incorporated the following better practice elements:
- scope for the preparation of a project plan and specification—100 per cent
- authorisation arrangements—100 per cent
- objectives—94 per cent
- budget setting and approval process—89 per cent
- criteria for project selection—83 per cent
- risk assessment and management plan—78 per cent.
Conversely the following better practice elements were not incorporated into the capital project management policies at a significant number of tertiary education bodies:
- circumstances requiring probity auditors and advisors—50 per cent
- process of assigning a sponsor to a project—33 per cent
- references to legislative requirements—28 per cent.
Each of these elements if not properly addressed can have substantial impacts on the capital project process, resulting in budget overruns and time delays. It is concerning that just four universities and five TAFEs had covered the engagement of either independent probity auditors or advisors prior to the awarding of a contract.
Board approval of policy
Capital project management is a critical business activity and should be a concern to members of university councils and TAFE governing boards, who are ultimately accountable for their operations.
Only 10 of the 18 tertiary education bodies (56 per cent) with a capital project management policy had obtained governing body approval. Six of the eight universities (75 per cent) with a capital project management policy obtained council approval. Four of the 10 TAFEs (40 per cent) with a policy had it approved at board level.
3.4.3 Management practices
Monitoring of capital projects
Regular monitoring of capital projects by executive management teams is central to assessing whether projects are running on time and on budget, as well as determining whether benefits are being achieved and risks are being adequately managed and mitigated.
The majority of tertiary education bodies maintain systems which enable the production of monthly reports relating to work in progress and completed project listings, from which transaction postings to general ledgers are made. These reports allow project managers and executive management to review, and report on, the progress of projects and complete analysis of financial and other outcomes for finalised projects.
We found shortcomings in the underlying capital project systems at eight of the 22 tertiary education bodies (36 per cent), as these entities’ systems were not capable of scheduling payments and projecting cash flows. This is of concern, particularly for the four universities (50 per cent) where these systems were found to be inadequate.
Executive management teams across the sector are monitoring the status of projects, with key project elements and milestones being reviewed at each of the tertiary education bodies. This indicates that while there may have been some deficiencies noted in the composition of capital project management policies and underlying system capabilities, the high-level management oversight of capital projects is operating effectively.
Conduct of post-project evaluations
An important aspect of the capital works process is the experience that can be derived from analysing whether the planned outcomes of the project were achieved, and whether works were completed on time and within budget. The application of this ongoing experience by management to future projects would improve an entity’s ability to deliver projects on time and within budget.
Seven of the 22 tertiary education bodies (32 per cent) do not undertake a post-project evaluation at the completion of capital projects. This important mechanism for driving process improvement should be implemented in the four universities and the three TAFE institutes that currently do not perform this activity.
3.4.4 Governance and oversight
Reporting to the board
To facilitate effective decision-making, internal reports should be prepared on a regular basis, containing complete and accurate information with sufficient commentary included. These reports should be provided to the governing board on a regular basis to enable it to fulfil its oversight obligations.
All of the entities within the tertiary education sector were reporting monthly or quarterly to their governing bodies on overall capital expenditure programs as well as specific projects. While the reports generally focus on the achievement of project outcomes and the management of project risks, greater attention should be given to reporting on the achievement of key milestones.
Emergence of board subcommittees
To facilitate effective monitoring of performance against delivery dates and cost, regular reports should be prepared and provided to board subcommittees with commentary on variations against targets.
These subcommittees provide a sharper focus on the delivery of the capital expenditure program and, in conjunction with management, play an important role by looking to clear any potential disruptions that would impact on the achievement of key milestones.
In response to the expanded capital work programs, we noted that 19 tertiary education bodies (86 per cent) have established a separate subcommittee, directly responsible to the governing board, to overview the management of capital projects from the initiation of contract proposals to post-completion evaluation.
Risk management
With a significant capital works program underway, it is important that the risks associated with contract management and project delivery are monitored by the executive management team and governing body.
Five of the 22 tertiary education entities do not include risks associated with their capital expenditure program in their risk register. Given that the size of these entities’ aggregate programs exceeds $75 million per annum, we would have expected some documented risk assessment to have been completed.
Internal audit
Reviews of capital project management controls and compliance with policies and procedures are necessary for identifying control weaknesses, potential process improvements and training needs. Such reviews can provide management and the board with assurance over the entity’s capital project management arrangements and assist them in meeting their monitoring obligations.
Thirteen of the 22 tertiary education bodies (59 per cent) had not had an internal audit review of their capital project management arrangements during the past three years. Specifically, nine of 14 TAFE institutes (64 per cent) had not commissioned an internal audit review of their capital project management arrangements.
Recommendations
That tertiary education bodies:
- assess their policies and practices against the identified general internal control weaknesses to determine the adequacy of their controls, and whether they are operating reliably, efficiently and effectively
- develop comprehensive policies and procedures over information technology system security which are approved at board or council level and subject to regular review
- develop an information security classification policy that outlines criteria for assigning security classifications to information and the required security controls for each classification
- undertake periodic assessments of the adequacy of, and compliance with, information technology security requirements.
That tertiary education bodies:
- develop capital project management policies and procedures which are approved by the governing body
- undertake post-project evaluations to learn from recent projects and report findings to the governing body
- engage internal audit to conduct periodic reviews of their information technology security policies and capital project management arrangements and outcomes.
4 Financial results
At a glance
Background
Accrual-based financial statements enable an assessment of whether universities and technical and further education (TAFE) institutes are generating sufficient surpluses from operations to maintain services, fund asset maintenance, and retire debt.
Student fees represent a significant portion of own-source revenue for the tertiary education sector, with 84.9 per cent of these fees received from international students.
Findings
- The university sector generated a surplus of $478.5 million, down 0.5 per cent on the 2010 result, including a $61.7 million increase in international student fee revenue.
- The TAFE sector generated a surplus of $100.5 million, down 32.5 per cent on the 2010 result, partly as a result of decreased student numbers, including international students.
- An 11.7 per cent decrease in onshore international student commencements across the TAFE sector resulted in a $13.9 million decrease in fee revenue from this source.
- Three of the 11 TAFE institutes providing educational services to international students cannot provide information on these students' countries of residence; this deficiency impacts on their ability to effectively market their services.
- In 2011, the first year of the contestable market introduced by the former state government, there was a reduction in domestic student fee revenue across the TAFE sector of $1.4 million (2.1 per cent).
Recommendation
Tertiary education bodies should develop and maintain the capacity to monitor the country of residence and other socio-economic details of their international students to improve their marketing focus and provide appropriately structured courses.
4.1 Introduction
Accrual-based financial statements enable an assessment of whether universities and tertiary and further education (TAFE) institutes are generating sufficient surpluses from operations to maintain services, fund asset maintenance and retire debt.
Universities can generate surpluses to fund asset renewal and acquisitions. The TAFE sector has greater reliance on a funding model that allocates capital grants strategically across the sector.
4.2 Financial performance
Financial performance is measured by an entity's result—the difference between revenue inflows and expenditure outflows.
An entity’s financial position is generally measured by reference to its net assets—the difference between its total assets and total liabilities. However, this measure is less relevant in the public education sector, as most of these entities are ‘not for profit’, and generally do not hold assets that generate revenue. Instead, they mainly hold building and infrastructure assets, which require funds to meet operating costs, repairs, maintenance and replacement.
As the revenue base for universities and TAFEs is not tied to the value of their asset base and they cannot sell most of their assets to obtain funds, their objective should be to maintain and improve their asset base and related service provision, while managing the level of debt so it can be paid from future operations.
The ability of universities and TAFEs to maintain their assets depends on asset and liability management policies, and is reflected in the composition and rate of change in the value of assets and liabilities.
4.2.1 Universities
Operating result
Figure 4A provides a comparison of the total operating results for the eight universities for 2011 and 2010.
Figure 4A
Total operating results of universities for 2010 and 2011
|
Operating result ($’000) |
Movement |
||
|---|---|---|---|
|
2010 |
2011 |
($’000) |
(%) |
|
480 894 |
478 523 |
(2 371) |
(0.5) |
Source: Victorian Auditor-General's Office.
The 2011 overall operating result for universities of $478.5 million was similar to 2010, indicating that the sector again generated strong returns. A 2.4 per cent increase in expenditure was almost matched by a 2.2 per cent increase in revenue recorded during 2011.
Operating revenue
The composition of operating revenue remained consistent with that of the previous year. The composition of university revenue for 2011 is presented in Figure 4B.
Figure 4B
Revenue composition for 2011
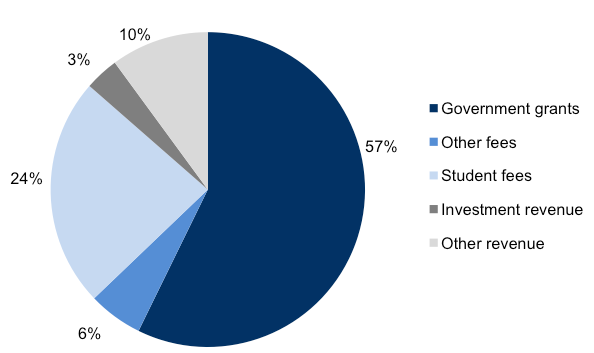
Source: Victorian Auditor-General's Office.
Universities collectively generated $6.5 billion in revenue in 2011, an increase of $139.0 million (2.2 per cent) from 2010 ($6.4 billion).
Commonwealth and state government funding accounted for 57 per cent of total revenue in 2011 (55 per cent in 2010). Government funding grew by $225.9 million (6.4 per cent) from 2010.
Government funding is provided for two purposes: operating grants, mainly from the Commonwealth government, for delivery of student education services, and capital grants for projects. In 2011, universities received $3.6 billion in operating grants and capital funding of $168.2 million.
Fees, the second largest source of revenue, accounted for 30 per cent of total revenue in 2011 (2010, 29 per cent). The majority of this amount is from student fee revenue. Universities generated $1.9 billion from fee revenue in 2011, an increase of $65.5 million (3.6 per cent) over 2010.
Operating expenditure
The composition of university expenditure also remained consistent with that of the previous year. The composition is presented in Figure 4C.
Figure 4C
Expenditure composition for 2010–11
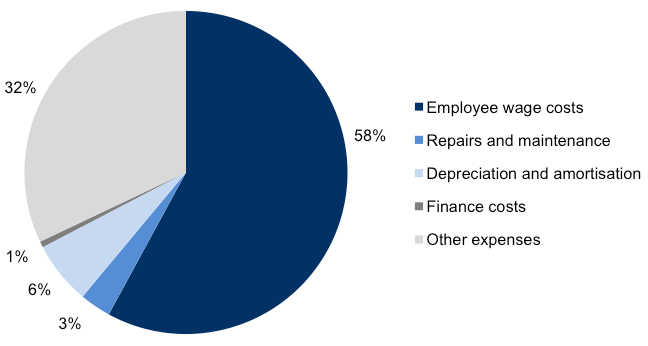
Source: Victorian Auditor-General's Office.
In 2011, universities reported operating expenses of $6.0 billion, an increase of $141.3 million (2.4 per cent) from 2010.
The largest component of expenditure for 2011 was employee wage costs—58 per cent of total expenditure. Employee wage costs grew by $194.5 million (5.9 per cent) on the prior year mainly due to increments agreed to in the collective salary agreements which were implemented in 2010, with the full effect impacting on the 2011 financial year.
Assets
In 2011 total university assets increased by $745.4 million (5.4 per cent). This was mainly due to large movements in property, plant and equipment (up $515.3 million or 5.6 per cent) and receivables (up $121.6 million or 35.3 per cent). These movements were primarily driven by the construction of new buildings across the sector, as well as an independent revaluation which resulted in an upward revision of land assets at The University of Melbourne. The increase in receivables at 31 December 2011 primarily related to a short-term loan provided by Swinburne University to a subsidiary to finance the construction of a new building.
Property, plant and equipment continue to represent the majority of total assets, comprising 68 per cent of the balance in 2011.
Liabilities
As at 31 December 2011, total university liabilities amounted to $3.7 billion, an increase of $275.8 million (8.0 per cent) on 2010.
Interest bearing liabilities increased by $96.3 million (16.8 per cent), primarily due to RMIT borrowing additional funding to finance its capital works program. Another $20 million was also raised by Swinburne University which was used to help fund a short-term loan to a subsidiary for a building development.
Provisions increased by $54.2 million (8.5 per cent) reflecting the ongoing outcome of new collective salary agreements. The balance of other liabilities rose by $117.5 million, mainly due to The University of Melbourne recognising a rent in advance liability which was used for funding the development of two new neuroscience facilities.
The composition of liabilities has not changed in 2011, with the deferred superannuation liability representing the main component at 36 per cent (2010, 38 per cent).
4.2.2 TAFEs
Operating result
Figure 4D provides a comparison of the total operating result for the TAFE sector for 2011 and 2010.
Figure 4D
Total operating results of TAFEs for 2010 and 2011
|
Operating result ($’000) |
Movement |
||
|---|---|---|---|
|
2010 |
2011 |
($’000) |
(%) |
|
149 007 |
100 487 |
(48 520) |
(32.5) |
Source: Victorian Auditor-General's Office.
In 2011, the TAFE sector generated an operating surplus of $100.5 million, down $48.5 million (32.5 per cent) on 2010. The decrease is mainly due to a $9.1 million (2.6 per cent) drop in fee revenue, and a $22.5 million (3.2 per cent) increase in employee wage costs.
Operating revenue
In 2011, TAFEs collectively generated $1.2 billion in revenue, a decrease of $11.7 million (1.0 per cent) from 2010. The most significant decrease was noted in capital grant funding provided to the sector, down $67.0 million. Fee revenue also decreased $9.1 million, largely due to fewer commencing international students than in 2010. These decreases were partially offset by an increase of $68.5 million in operating grant revenue.
The composition of TAFE revenue remained fairly consistent in 2011, with government funding contributing 66 per cent of total revenue (2010, 65 per cent) and student fees representing a further 28 per cent (2010, 29 per cent). TAFE revenue composition for 2011 is presented in Figure 4E.
Figure 4E
Revenue composition for 2011
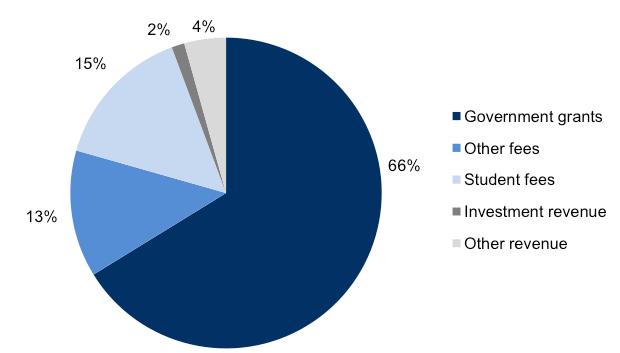
Source: Victorian Auditor-General's Office.
Operating expenditure
In 2011 operating expenditure for the TAFE sector was $1.1 billion, an increase of $35.6 million (3.4 per cent) from 2010. Expenditure growth was less than in 2010, where the increase was $60.6 million (6.1 per cent). Such increases are unsustainable over the longer term, particularly given the recent decreases in the revenue base and capital funding provided.
Employee benefit costs represented the majority of total expenditure in 2011 at $723 million (66 per cent). Employee costs increased by $22.5 million (3.2 per cent) on 2010, due in part to increased staff training costs.
The composition of TAFE expenditure remained consistent with that of the previous year, as presented in Figure 4F.
Figure 4F
Expenditure composition for 2011
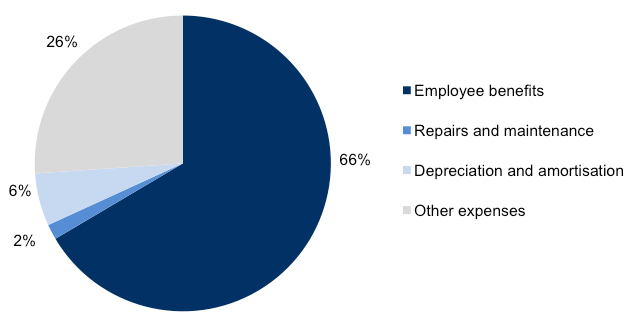
Source: Victorian Auditor-General's Office.
Assets
In 2011 total TAFE assets increased by $91.0 million (4.3 per cent) due to a net increase in property, plant and equipment values, up $52.2 million (3.1 per cent). This was caused by a $141.8 million (11.9 per cent) increase in the value of buildings due to the capitalisation of new structures and independent revaluations.
Cash balances increased by $34.4 million largely due to delays in the timing of cash flows related to the acquisition of property, plant and equipment across the TAFE sector.
The composition of assets has remained stable over the past five years with property, plant and equipment continuing to be the largest component, representing almost 80 per cent of total TAFE assets.
Liabilities
As at 31 December 2011, total TAFE liabilities amounted to $233.2 million. Total liabilities increased by $20.1 million (9.5 per cent), due to an increase in payables of $15.9 million (28.5 per cent) and employee leave provisions of $9.5 million (8.6 per cent). This was partially offset by a $5.2 million (11.1 per cent) decrease in other liabilities, mainly as a result of fewer international student numbers which meant that the fees received in advance liability was reduced.
The composition of liabilities has remained stable over the past five years. Provisions (51 per cent) and payables (31 per cent) continue to represent the majority of liabilities across the TAFE sector.
4.3 Trends in student fee revenue
Student fees represent a significant portion of own-source revenue for universities and TAFEs, with 84.9 per cent received from international students. Student fee revenue is a significant factor for the ongoing financial viability of TAFEs. Tertiary bodies' reliance on international student fees has increased the risk of financial instability to both universities and TAFEs. This is especially so with a fluid global economic environment, a strong Australian dollar and the uncertainty surrounding Australia's continuing ability to attract international students.
In 2011, immigration policy changes and the growing strength of the Australian dollar adversely impacted on international student fee revenue. Annual growth in international student fees for universities has slowed to 4.8 per cent, compared to an average growth of 13.7 per cent between 2007 and 2010. TAFEs experienced a $13.9 million (11.0 per cent) reduction in international student fees in 2011, compared to an increase of $40.5 million (47.2 per cent) over four years between 2007 and 2010.
4.3.1 Universities
In 2011, universities recorded a moderate increase in total student fee revenue of $64.0 million to $1.54 billion, an increase of 4.3 per cent from 2010. This largely consisted of a $61.7 million (4.8 per cent) rise in international student fee revenue. Some universities have a TAFE component which forms part of the universities' overall results and have nevertheless been included as part of the university component for the purposes of our analysis.
The University of Melbourne recorded the highest relative growth in student fees with a $24.0 million (7.7 per cent) increase on the prior year. Monash University recorded the second highest relative growth of $21.2 million (6.2 per cent).
Victoria University recorded a decline in student fee revenue in 2011 of $5.9 million (7.1 per cent).
Figure 4G shows the relationship between international student fee revenue at universities and operating surpluses over the past five years. It is important to note that these figures include both onshore and offshore components of international student fees.
Figure 4G
International student fee revenue and operating surpluses – universities
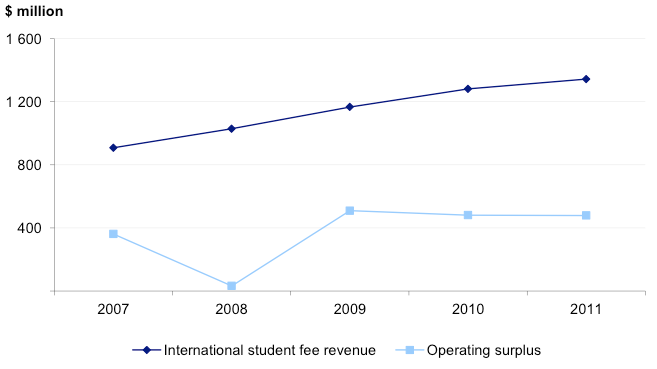
Source: Victorian Auditor-General's Office.
The trend in international student fees received by the university sector over the past five years shows an increase of $436 million (48.0 per cent) to $1.34 billion in 2011. This significant growth highlights the substantial contribution made by international student fee revenue to university operating surpluses.
Despite the growth in fees from international students, the onshore market has become more volatile as a result of recent publicised increases in racial vilification and safety concerns, government immigration reforms, the increased strength of the Australian dollar, and legislative changes to student visa requirements.
Figure 4H indicates the level of onshore international students commencing at universities in 2011, compared to 2010.
Figure 4H
Number of onshore international students commencing – universities
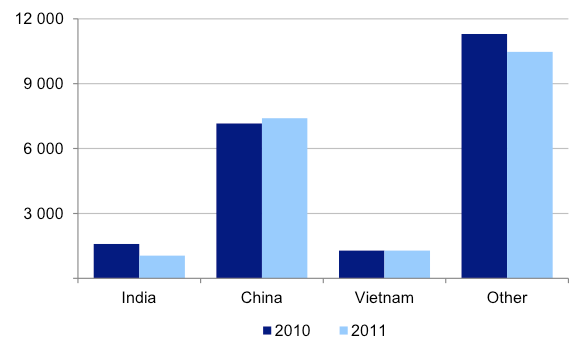
Source: Victorian Auditor-General's Office.
Overall there has been a decline across the university sector in onshore international student numbers of 1.8 per cent in 2011, compared to 2010. This decline has been driven by fewer onshore international students commencing their studies in 2011, down 6.3 per cent compared to 2010. Our analysis of student enrolment data showed that there was a moderate increase of 3.4 per cent in newly enrolled Chinese students in 2011. However, total international student numbers have been negatively impacted by a 33.7 per cent decline in the commencement of Indian students, and a 7.3 per cent decline in international students from other backgrounds commencing their studies in 2011.
With the expected downturn in the number of international students enrolling in universities it is critical that they effectively manage their operating budgets to remain financially sustainable.
4.3.2 TAFEs
In 2011, total student fee revenue decreased by $15.3 million (7.9 per cent) to $178.2 million in 2011, compared to 2010. This was due to a $13.9 million decrease in international student fee revenue and a decrease of $1.4 million in domestic student fee revenue.
Holmesglen Institute of TAFE and Northern Melbourne Institute of TAFE recorded the highest relative student revenue decreases of $7.8 million (27.0 per cent) and $8.4 million (23.8 per cent), respectively.
Figure 4I shows the relationship between international student fee revenue and operating surpluses over the past five years.
Figure 4I
International student fee revenue and operating surpluses – TAFEs
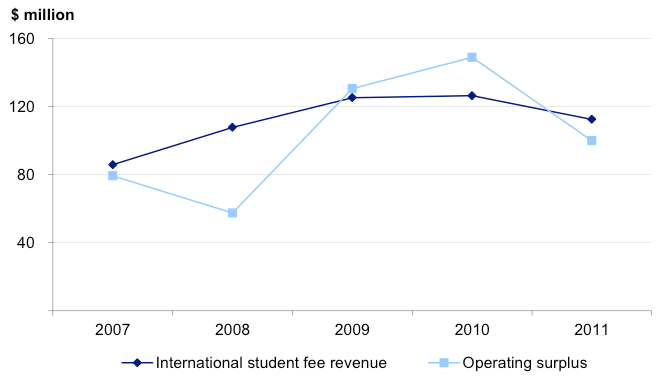
Source: Victorian Auditor-General's Office.
The recent trend of reduced international student fees is starting to adversely impact the operating surplus of TAFEs. In 2011 the total operating surplus of the TAFE sector reduced by $48.5 million (32.5 per cent) to $100.5 million in 2011.
Quality and comprehensive data on commencing students was only received from five of the 11 TAFEs with international students. Our analysis of this data showed an overall 11.7 per cent decline in onshore international student commencements in 2011. While there has been a decline in students from most nationalities, the number of Indian students has seen a more substantial reduction of 42.1 per cent in 2011.
Information regarding countries of residence for international students was not able to be identified by three out of the 11 TAFEs with international students. Failure to analyse this information is likely to impact on the ability of individual TAFEs to appropriately focus their marketing efforts. This deficiency also impacts on the capacity of TAFEs to tailor their courses and manage their student base effectively.
In 2011, the first year of the operation of a contestable market introduced by the former state government, domestic student fee revenue has reduced by $1.4 million (2.1 per cent) to $65.7 million in 2011. Management will need to monitor and react to these pressures so that entities remain financially sustainable.
Recommendation
That tertiary education bodies:
-
develop and maintain the capacity to monitor the country of residence and other socio-economic details of their international students to improve their marketing focus and provide appropriately structured courses.
5 Financial sustainability
At a glance
Background
To be financially sustainable, universities and technical and further education (TAFE) institutes need the capacity to meet current and future expenditure as it falls due, and to be able to absorb foreseeable changes and financial risks as they materialise. This Part provides our insight to the financial sustainability of tertiary education bodies obtained from analysing the trends in five indicators over a five-year period.
Findings
- The university sector’s overall financial sustainability risk is assessed as low based on our analysis of the indicators. However, the risk to Monash University’s and Victoria University’s overall financial sustainability is assessed as medium, driven by weak self-financing indicators impacting on their ability to maintain and replace assets.
- The TAFE sector’s overall financial sustainability risk is assessed as low, despite TAFE institutes generally recording high or medium risk results for the self-financing indicator. Sunraysia Institute of TAFE was assessed as medium risk for the period under review.
- The TAFE funding model allocates capital grants strategically across the sector rather than progressively to each entity, with funds for asset replacement not provided until government considers replacement is necessary. This model limits the ability of governing bodies and management to exercise discretion or make decisions around asset maintenance and replacement, and consequently can impact on the TAFE sector’s long-term operational performance.
5.1 Introduction
To be financially sustainable, universities and technical and further education (TAFE) institutes need the capacity to meet their current and future expenditure as it falls due. They must also be able to absorb foreseeable changes and financial risks as they materialise.
Insight into the financial sustainability of Victoria’s eight universities and 14 TAFEs is obtained from analysing the trends in five financial sustainability indicators over a five‑year period. The analysis reflects on the position of individual entities and on the two categories of tertiary education providers—universities and TAFEs. Appendix B describes the sustainability indicators and risk assessment criteria used in this report.
The financial sustainability indicators and assessments flag departures from the norm that warrant attention. However, to form a definitive view of any entity’s financial sustainability requires a holistic analysis that moves beyond financial considerations to include the entity’s operations and environment. These further considerations are not examined in this report.
The results in this Part should be analysed in the context of the regulatory environment in which the tertiary education sector operates.
5.2 Financial sustainability: universities
5.2.1 Overall assessment
The university sector’s overall financial sustainability risk is low based on an analysis of five indicators over a five-year period. However, Monash University’s and Victoria University’s overall financial sustainability risk assessments are medium, driven by weak self-financing indicators.
The sector’s results for the five indicators are generally positive, including:
- positive underlying operating results
- short-term liabilities can usually be met by short-term assets
- spending on fixed assets is generally higher than depreciation.
Figure 5A summarises the results of the five financial sustainability indicators at a sector and individual entity level over the five-year period, 2007 to 2011.
High risk results are shown as red, medium risk as orange, and low risk as green.
Figure 5A
Five-year mean financial sustainability risk assessment – universities
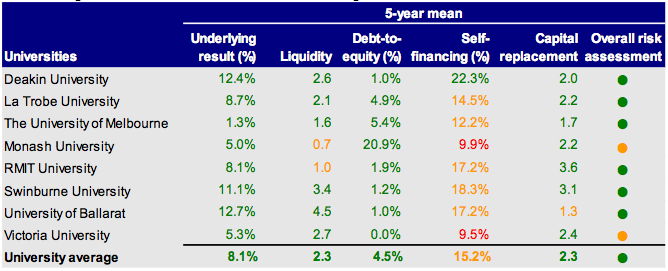
Source: Victorian Auditor-General's Office.
The average underlying result, liquidity, debt-to-equity and capital replacement indicators for the university sector are all assessed as low risk.
Based on a five-year mean, risk related to the average self-financing indicator is assessed as medium for the sector. However, for this indicator Monash University and Victoria University continue to be assessed as high risk, meaning there is a likelihood that assets cannot be replaced and new assets purchased from operating cash flows over the long term. For both entities, cash flows from operating activities will require monitoring and active management, as asset renewals and additions are important contributors to maintaining and improving the universities’ facilities.
5.2.2 Five-year trend analysis
This section provides an analysis and commentary on the trends for each indicator for the past five years. The financial sustainability indicators for 2007 to 2011 are provided in Appendix B.
Underlying result
Figure 5B shows that the average underlying result indicator has improved from 7.4 per cent in 2007 to 8.9 per cent in 2011. The trend indicates that revenue has grown faster than expenditure over the five-year period. The average result for 2011 is slightly down on 2010, however, all universities continued to generate an operating surplus.
Figure 5B
Average underlying result – universities
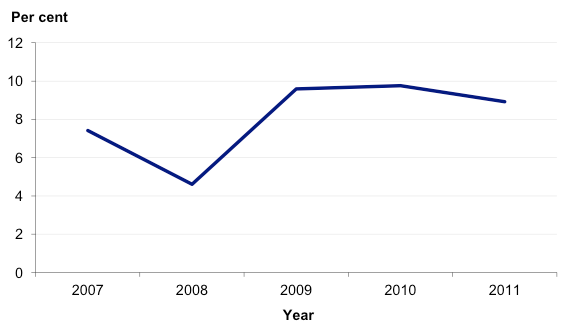
Source: Victorian Auditor-General's Office.
The underlying result indicator for all universities has been assessed as low since 2009.
Liquidity
Figure 5C shows that the overall ability of universities to repay short-term liabilities was consistent from 2010 to 2011. The risk assessment for two universities has been assessed as medium and high as their short-term liabilities exceed their short-term assets.
Figure 5C
Liquidity risk assessment – universities
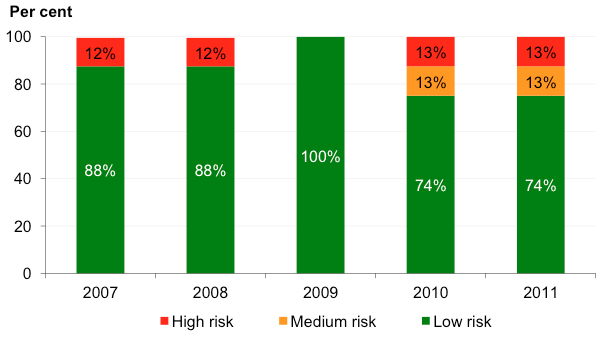
Source: Victorian Auditor-General's Office.
The sector’s average liquidity risk remains low. Current asset balances have been more than double the level of current liabilities over the five-year period.
Debt-to-equity
The benefit of maintaining a low debt-to-equity ratio is that an entity is able to comfortably meet its debt repayment obligations. A low ratio indicates the entity is less reliant on debt to fund its operations and capital programs over the long term.
Figure 5D shows that the debt-to-equity indicator has marginally improved from 2007 to 2011. This shows that universities are able to comfortably repay their debt from own‑source revenues.
Figure 5D
Average debt-to-equity indicator – universities
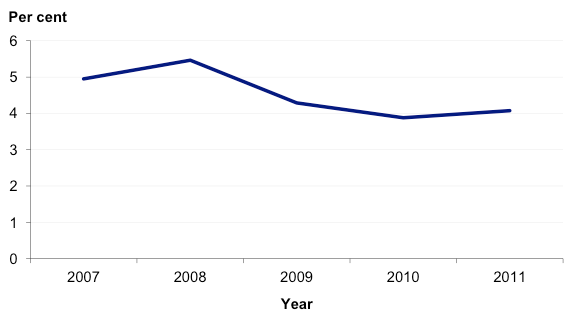
Source: Victorian Auditor-General's Office.
Each of the eight universities was assessed as low risk for the debt-to-equity indicator over the period under review.
Self-financing
The trend in the average self-financing indicator for universities has marginally improved over the five-year period, although it remained in the medium-risk category at 16.5 per cent in 2011.
Figure 5E shows that six of the eight universities (75 per cent) have been assessed as high or medium risk for the self-financing indicator in 2011. This suggests that the universities cannot effectively replace their assets over the long term using income generated by their operations. Under these circumstances there may be a greater reliance on government funding for asset renewal and replacement.
Figure 5E
Self-financing risk assessment – universities
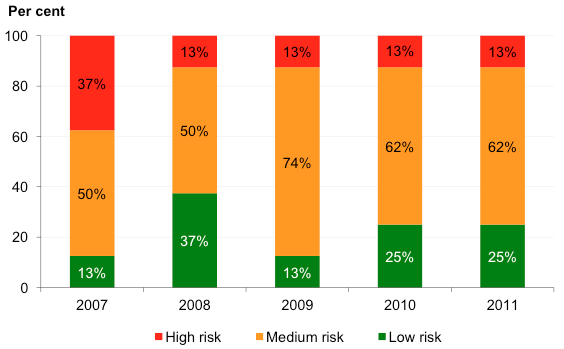
Source: Victorian Auditor-General's Office.
The results highlighted above are even more problematic given that four of the medium- to high-risk assessments relate to universities with limited cash reserves to draw upon to meet operational expenditure commitments and fund capital activities.
Monash University was assessed as medium risk in 2011 (high risk in 2010), due to the cost of its voluntary separation program being felt more in 2010 than in 2011.
Victoria University was assessed as high risk for the fourth time in five years, highlighting its limited cash flows from operations during the period under review. Unlike some universities, Victoria University does not have large cash or investment reserves but has continued to invest in required infrastructure. Consequently, it is dependent to a large extent on government funding for its future capital expansion program.
Capital replacement
The average capital replacement indicator for the university sector has improved over the five-year trend period and the risk remains low.
Aggregate capital spending on property, plant and equipment has consistently and significantly exceeded aggregate depreciation. It should be noted, however, that these good results reflect the significant expenditure incurred by a number of universities on new buildings, facilities and infrastructure over the past several years. As a result, the true level of spending on asset renewal is substantially less than indicated.
Figure 5F shows that 87 per cent of universities have been assessed as low risk for the capital replacement indicator in 2011. This illustrates that for these entities spending on capital works is sufficient to maintain and upgrade existing infrastructure and equipment. These universities are able to keep up with the increasing demand for improved education service facilities.
Figure 5F
Capital replacement risk assessment – universities
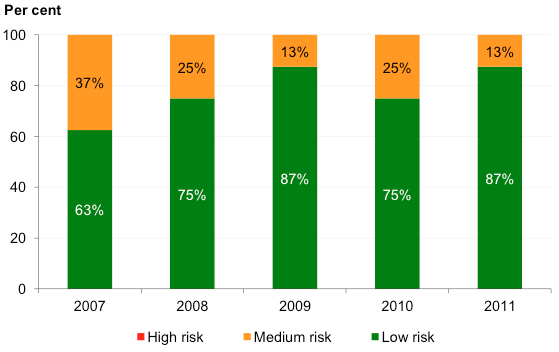
Source: Victorian Auditor-General's Office.
The University of Ballarat was assessed as medium risk in 2011 and for the five-year period under review, however, their capital spending continues to outstrip depreciation.
5.3 Financial sustainability: TAFEs
The TAFE sector’s overall financial sustainability risk is assessed as low, based on an analysis of five indicators over a five-year period. The sector’s indicators are generally positive, including:
- positive underlying operating results
- strong liquidity ratios, indicating current assets exceed current liabilities.
Over the period under review TAFE institutes have consistently recorded poor self‑financing ratios, suggesting that they are not able to effectively fund capital programs with cash generated from operations. However, strong results noted across the other financial sustainability indicators lessen the adverse impact of poor self‑financing assessments.
Figure 5G summarises the results of the assessment of the risks for the five financial sustainability indicators at the sector and individual entity levels over the period 2007 to 2011.
Figure 5G
Five-year mean financial sustainability risk assessment – TAFEs
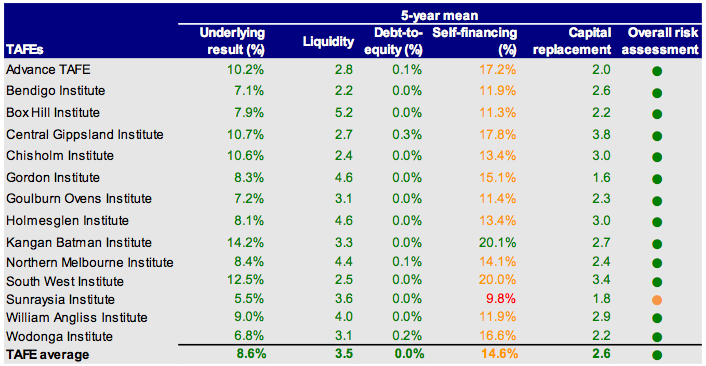
Source: Victorian Auditor-General’s Office.
The average risk for the indicators of underlying result, liquidity, debt to equity and capital replacement is assessed as low.
The assessed risk of the average self-financing indicator is medium. This indicator represents a TAFE’s ability to fund new assets and replace existing assets from operating cash flows. While TAFEs are generating operating surpluses, they are not generating sufficient revenues to build enough retained earnings to finance future asset replacement and purchase new assets.
The funding model for TAFEs does not progressively fund them for the depreciation of their assets, but allocates capital grants strategically across the sector. This means that funds for replacing assets are not provided until such time as the government considers replacement is appropriate, given its strategic review of the sector’s needs and other spending priorities. Nevertheless, the governing board of each entity is accountable for the entity’s financial management and performance.
Therefore, the capital funding model limits the ability of the boards and management to exercise discretion or make decisions around asset maintenance and replacement. This could have implications for holding them to account for an entity’s operational performance.
5.3.1 Five-year trend analysis
This section provides an analysis and commentary on the trends for each indicator for the past five years. The financial sustainability indicators for 2007 to 2011 are provided in Appendix B.
Underlying result
It is important to maintain a positive underlying result ratio, as these provide ongoing surpluses from which entities can fund their capital programs.
Figure 5H shows that the average underlying result indicator for the TAFE sector decreased in 2011 after two years of growth to 2010. In 2011 the underlying result of the TAFE sector was just over 50 per cent of the 2010 underlying result.
Figure 5H
Average underlying result – TAFEs
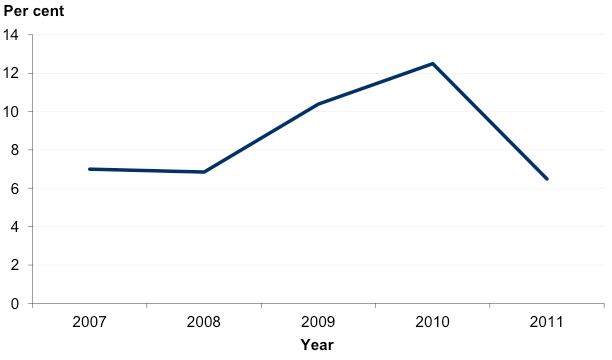
Source: Victorian Auditor-General's Office.
Four of the 14 TAFEs were assessed as medium risk in 2011 (zero in 2010). This was due to each of these entities recording a small operating deficit for the first time in four years. While deficits are not sustainable, strong past results recorded by these entities indicate that this is not yet of concern.
Liquidity
The liquidity indicator is a measure of an entity’s current assets compared to their current liabilities—a low risk indicates that the entity does not have any immediate issues with repaying short-term liabilities as they fall due.
Figure 5I shows that on average TAFEs have strong liquidity positions, well above the 1:1 low-risk threshold.
Figure 5I
Average liquidity ratio – TAFEs
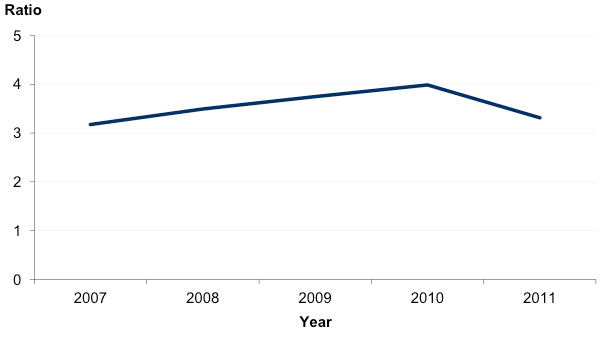
Source: Victorian Auditor-General's Office.
The ability of all the TAFEs to repay short-term liabilities has been consistently assessed as low risk for the five years to 2011.
Debt-to-equity
A low debt-to-equity ratio indicates the entity is less reliant on debt to fund its operations and capital programs. A ratio of zero indicates that the entity does not have any debt at all, which was substantially the case across the TAFE sector in 2010 and 2011 as shown in Figure 5G.
The risk related to the debt-to-equity indicator for all TAFEs is assessed as low for 2011. This result was due to none of the TAFEs having notable debt balances at 31 December 2011.
Self-financing
The self-financing indicator for the TAFE sector was at a similar level in 2011 as in the preceding four years. A strong indicator is important as it suggests that entities are generating sufficient cash from operations to fund the replacement of assets. Conversely, a poor indicator suggests that this is not the case, and that capital programs are either underfunded, or financed by other means.
Figure 5J shows that 10 of 14 (72 per cent) of TAFEs have an assessed risk of either high or medium for the self-financing indicator in 2011. This indicates that these entities cannot effectively replace their assets over the long term using income funded from operations. Under these circumstances there is a greater reliance on government funding for asset renewal and replacement. This is largely because the TAFE capital funding model allocates capital funding strategically across the sector, rather than progressively to individual TAFEs.
Figure 5J
Self-financing risk assessment – TAFEs
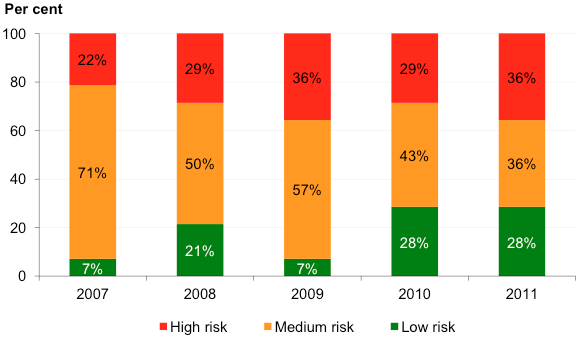
Source: Victorian Auditor-General's Office.
This indicator will need to be monitored, as a continuing decline would indicate that assets will not be able to be replaced from operating cash flows over the long term.
Capital replacement
The average capital replacement indicator for the TAFE sector decreased in 2011, after steady improvement over the preceding four-year period.
Aggregate capital spending on property, plant and equipment has consistently and significantly exceeded aggregate depreciation across the TAFE sector. However, caution is required when interpreting these results as annual capital expenditure includes new and expanded facilities, in addition to existing facilities. As a result, the true level of spending on asset renewal is less than indicated.
Figure 5K shows that the risk to capital replacement for four TAFEs has moved to high in 2011, and that a further two TAFE institutes have been assessed as medium risk. These results indicate that TAFE spending on capital works is not sufficient to maintain and upgrade existing infrastructure and equipment.
Figure 5K
Capital replacement risk assessment – TAFEs
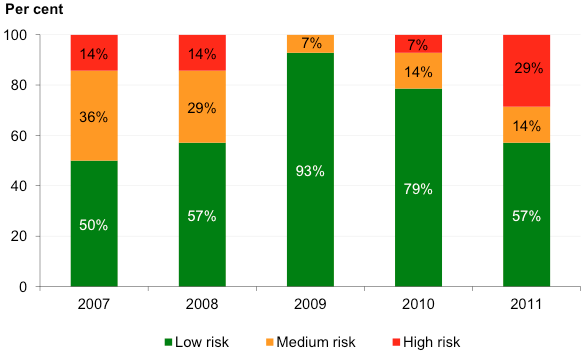
Source: Victorian Auditor-General's Office.
6 Alpine resorts
At a glance
Background
Victoria’s alpine resorts located at Mount Buller and Mount Stirling, Falls Creek, Mount Hotham, Mount Baw Baw and Lake Mountain, are managed by alpine resort management boards (ARMBs). The Alpine Resorts (Management) Act 1997 sets out the roles and functions of the ARMBs, including the requirement to prepare financial reports with balance dates of 31 October.
Findings
- Clear audit opinions were issued on the financial reports of all ARMBs, although an emphasis of matter was included in the auditor’s report for Mount Baw Baw and Lake Mountain, relating to their ongoing financial sustainability.
- Alpine resorts collectively made an operating surplus of $5.2 million, down $1.1 million or 18.4 per cent from 2010, as expenses grew faster than revenues.
- Bushfire relief funding, insurance recoveries for assets destroyed by fires and support payments from the Department of Sustainability and Environment totalling $10.1 million were the main factors contributing to the alpine resort sector’s surplus. Without these, the sector’s 2011 operating result would have been a deficit of $4.9 million.
- The alpine resort sector’s overall financial sustainability risk assessment is low, and is similar to 2010. However, Lake Mountain’s and Mount Baw Baw’s overall financial sustainability risks are assessed as high and medium, respectively.
- Their risk assessments raise concerns for their long-term sustainability and illustrate the need for government support to continue as a going concern.
Recommendations
- The Alpine Resorts Co-ordinating Council together with Lake Mountain and Mount Baw Baw ARMBs should investigate the potential for implementing revised operating arrangements to improve their longer-term financial viability.
- ARMBs should continue to address commonly identified internal control weaknesses to ensure they are operating in a reliable and sustainable manner.
6.1 Introduction
This Part deals with the results of the audit of the alpine resort management board (ARMB) entities which have a financial year ending 31 October 2011.
The Alpine Resorts (Management) Act 1997 sets out the roles and functions of the ARMBs. The then Minister for Environment and Climate Change appointed ARMBs for Victoria’s alpine resorts of Mount Buller and Mount Stirling, Falls Creek, Mount Hotham, Mount Baw Baw, and Lake Mountain.
6.2 Audit opinions issued
The five ARMBs prepare financial reports in accordance with the Financial Management Act 1994 (FMA).
All five ARMBs received clear audit opinions for the financial year ended 31 October 2011. While Mount Baw Baw and Lake Mountain received a clear audit opinion, an emphasis of matter paragraph was included relating to their ongoing financial sustainability and reliance on the Department of Sustainability and Environment (DSE) for operating funding. Both boards received support payments to meet operational expenditure from DSE during 2010–11. The department also provided both ARMBs with a letter of comfort—that it would provide adequate funding to enable the boards to meet their current and future obligations as and when they fall due up to December 2012, should this be required.
6.3 Quality of reporting
The quality of an entity’s financial reporting can be measured by the timeliness and accuracy of the preparation and finalisation of its financial report. To achieve cost‑effective financial reporting ARMBs need to have well planned and managed financial report preparation processes.
6.3.1 Timeliness of reporting
In 2011, all of the ARMBs completed their financial reports within the mandated 12‑week time frame. As shown in Figure 6A, the average time taken by the ARMBs to finalise their financial statements improved from 9.8 weeks in 2010 to 9.5 weeks in 2011.
Figure 6A
Average time to finalise financial reports
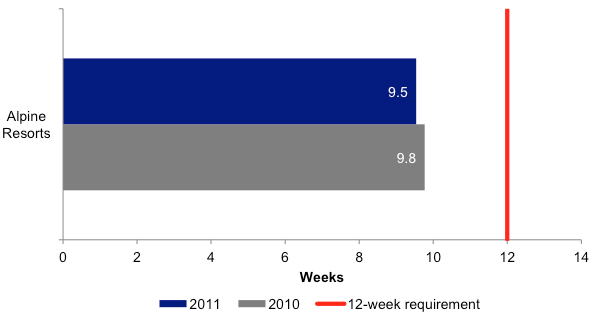
Source: Victorian Auditor-General’s Office.
6.3.2 Accuracy
An analysis of errors for the sector revealed that only one ARMB required a material adjustment to finalise its financial statements (four in 2010). Three other ARMBs required adjustments to their financial statements although the amounts were not material.
There were no significant classification or disclosure errors identified that required adjustment in the financial statements across the sector.
6.4 Financial results
6.4.1 Introduction
The financial objective for ARMBs should be to generate a sufficient surplus from operations to meet their financial obligations, and to fund asset replacement and new asset acquisitions. The ability of ARMBs to achieve this depends largely on the funding policies established by DSE and on how well they manage their operations.
The revenue base for the ARMBs is generally not tied to the value of their asset base and they cannot obtain funds by selling their assets. Their objective should be to maintain the condition of their infrastructure, while managing debt so it can be reduced from the proceeds of future operations.
6.4.2 Operating result
Each of the ARMBs recorded an operating surplus in 2011, which is an improvement on 2010, when Mount Baw Baw recorded an operating deficit. The total sector result was $5.2 million, down from $6.3 million in 2010. However, the sector received significant support payments of $8.2 million from the DSE, including funding in advance for the 2011–12 financial year. Excluding the DSE support payments, the insurance recoveries received and bushfire relief funding of $1.9 million, the sector’s operating result would have been a deficit of $4.9 million.
Figure 6B provides a comparison of the total operating results for the ARMBs for 2011 and 2010.
Figure 6B
ARMB operating result 2010–11
|
2010 |
2011 |
Movement |
||
|---|---|---|---|---|
|
$’000 |
$’000 |
$’000 |
% |
|
|
Operating result |
6 326 |
5 162 |
(1 164) |
(18.4) |
|
Less DSE support payments |
2 700 |
8 164 |
5 464 |
202.4 |
|
Less insurance recoveries and bushfire relief |
5 502 |
1 912 |
(3 590) |
(65.3) |
|
Revised operating result |
(1 876) |
(4 914) |
(3 038) |
(161.9) |
Source: Victorian Auditor-General’s Office.
Mount Baw Baw received $5.4 million in support funding from the DSE, up from $2.7 million in 2010. Of these receipts, $2.3 million related to funding received in advance for the 2011–12 financial year.
Lake Mountain recorded an operating surplus of $2.2 million, which included proceeds from insurance recoveries and Regional Development Victoria for bushfire relief funding of $1.9 million (2010, $5.5 million). Lake Mountain also received $2.8 million in support funding from the DSE. Of this, $0.9 million related to funding received in advance for the 2011–12 year.
Operating revenue
The composition of operating revenue has changed substantially over the past five years, as indicated in Figure 6C. Government grants, including DSE support payments, represent an increasing percentage of the sector’s revenue, up from 6 per cent in 2007 to 23 per cent in 2011.
Figure 6C
ARMBs revenue composition
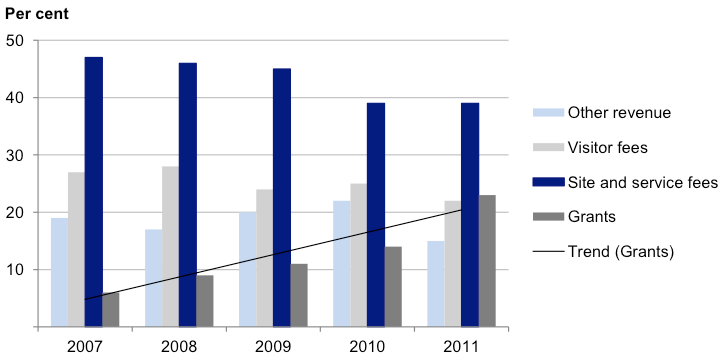
Source: Victorian Auditor-General’s Office.
During 2010–11, the combined operating revenues for ARMBs increased by 1 per cent from $46.3 million to $46.8 million. Revenue from grants increased by $4.2 million or 64.1 per cent, mainly due to the additional DSE support payments made to Mount Baw Baw and Lake Mountain. As the trend indicates, the percentage of government grants to total revenue has grown over the period under review, highlighting the sector’s increasing dependence on government funding. Increasing cost levels have not been matched by a growth in own-source revenues, such as visitor and site fees.
Operating expenditure
In 2010–11, total operating expenditure for ARMBs increased by 4.1 per cent or $1.6 million to $41.6 million. Employee benefit costs grew by $1.4 million or 9.7 per cent due in part to additional staff employed to operate the new oversnow transport system at Falls Creek.
The composition of operating expenditure has remained relatively consistent over the past five years.
6.4.3 Assets
There was an overall decrease in assets of $30.6 million, to $394.6 million at 31 October 2011. Total ARMB land values decreased by $75.2 million, including decreases in land assets of Mount Buller and Mount Stirling—$39.6 million, Falls Creek, $18.0 million and Mount Hotham—$17.7 million. Revaluations performed during 2010–11 decreased the value of land reflecting significant downward adjustments in market values, in part due to improved revaluation arrangements.
The Mount Hotham ARMB has reported an unquantifiable contingent liability for a native title land claim made in relation to parts of its land and resources. This may have a future impact on the access arrangements and value of the ARMB’s land assets.
The decreases in land values were partly offset by increases in infrastructure values, largely due to valuation revisions at 31 October 2011. This included valuation increments recognised by Mount Buller and Mount Stirling of $10.5 million and Mount Hotham, $6.0 million. Falls Creek also recognised a $12.6 million revaluation increment for road assets.
The shift in land and infrastructure values from 2010 to 2011 is shown in Figure 6D.
Figure 6D
Property, plant and equipment composition
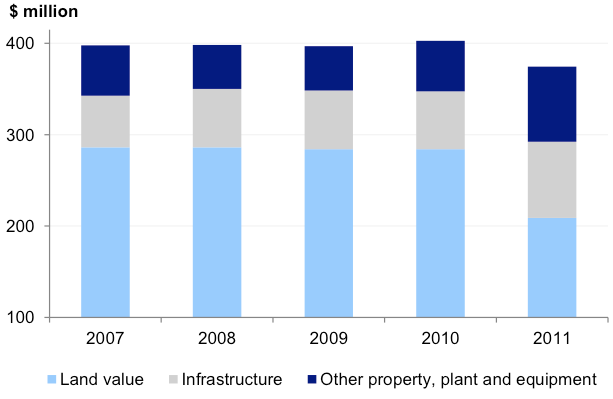
Source: Victorian Auditor-General’s Office.
Despite the above valuation movements, property, plant and equipment continue to make up more than 95 per cent of total assets.
6.4.4 Liabilities
Liabilities are primarily comprised of payables and interest bearing liabilities, making up 32 per cent and 27 per cent respectively.
In 2011, liabilities decreased by $0.7 million or 5.6 per cent, to $12.1 million at 31 October 2011, due to repayment of borrowings and a decrease in year-end payables.
The composition of liabilities has remained consistent over the past five years.
6.5 Financial sustainability
Our insight into the financial sustainability of the alpine resort sector is obtained from analysing five financial sustainability indicators over a five-year period. The five indicators used are underlying result, liquidity, debt-to-equity, self-financing and capital replacement. These indicators reflect each entity’s funding and expenditure policies, and indicate whether these policies are sustainable.
Financial sustainability should be viewed from both short- and long-term perspectives. The shorter-term indicators consider the entity’s ability to maintain a positive operating cash flow and adequate cash holdings, and to generate an operating surplus over time. These are the underlying result and liquidity indicators.
The longer-term indicators signify whether there is adequate funding available for spending on asset replacement to enable the entity to maintain the quality of service delivery and to help meet community expectations and the demand for these services. These are the self-financing and capital replacement indicators.
The debt-to-equity indicator is also a longer-term indicator as it measures the entity’s financial leverage, being the degree to which an entity’s activities are funded by debt.
Appendix B describes the sustainability indicators and risk-assessment criteria we use in this report.
The financial sustainability indicators and assessments flag departures from the norm that warrant attention. To form a definitive view of any entity’s financial sustainability requires a holistic analysis that moves beyond financial considerations to include the entity’s operations and environment.
6.5.1 Conclusion
The alpine resort sector’s overall financial sustainability risk assessment is low. However, Lake Mountain’s and Mount Baw Baw’s overall financial sustainability assessments are high risk and medium risk, respectively.
Figure 6E summarises the results of the five financial sustainability indicators at a sector and individual entity level, over the five-year period, 2007 to 2011.
High risk results are shown as red, medium risk as orange, and low risk as green.
Figure 6E
Five-year mean financial sustainability risk assessment 2007–11
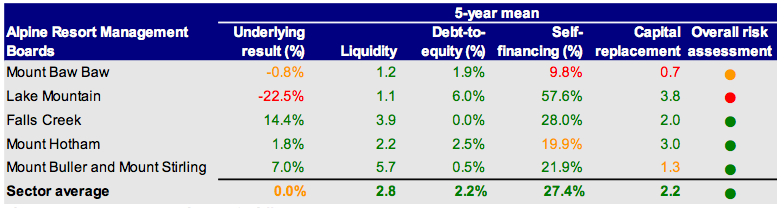
Source: Victorian Auditor-General's Office.
The indicators continue to raise concerns for the long-term sustainability of the smaller ARMBs of Lake Mountain and Mount Baw Baw. Over the five-year period these resorts recorded operating deficits, low liquidity and low levels of investment in fixed assets. This year’s assessment is consistent with prior years, although insurance recoveries have boosted Lake Mountain’s capital replacement indicator over the past two years. Both resorts are heavily reliant on DSE support funding as noted above, without which the underlying result indicators would be substantially less favourable.
Mount Baw Baw has assets depreciating at a greater rate than they are being replaced, as shown by the capital replacement indicator of high risk. This coupled with their low self-financing and liquidity indicators shows that this will have a significant effect on their future financial sustainability and capacity to replace assets.
Lake Mountain has improved its capital replacement indicator from 2010. This is due to government funding and insurance payments used to replace assets destroyed by the 2009 bushfires. However, the low underlying result indicator shows that they are not meeting operational expenditure requirements from operating revenues, and continue to require support funding from the DSE.
Our analysis showed that the workforce and contractor costs for Lake Mountain and Mount Baw Baw are the main contributing factors in their poor operating results and cash flow issues, signalling a need for structural reform.
The financial sustainability risk assessments for Mount Baw Baw and Lake Mountain illustrate their limited capacity to continue as a going concern without ad hoc operational funding from the government. As a result DSE has committed to provide further operational funding to Mount Baw Baw and Lake Mountain that will meet their essential operating expenses in 2012.
In our previous reports to Parliament, we have noted the previous government’s developments and reforms to the alpine resort sector. In 2007, the then Minister for Environment and Climate Change commissioned the State Services Authority (SSA) to perform a review of the institutional and governance arrangements for the individual ARMBs. The SSA final report Review of Alpine Resort Areas, released in 2009, made recommendations on key legislation and government policies.
The new government has yet to outline its strategic and long-term plan for the alpine resorts. However, the Minister for Environment and Climate Change has directed a number of resorts to work with the Alpine Resorts Co-ordinating Council to provide advice and recommendations on an integrated financial sustainability solution for the alpine industry. We will continue to report on the financial sustainability of the ARMBs and future developments in the sector.
6.5.2 Five-year trend analysis
This section provides an analysis and commentary on the trends for each indicator for the past five years. The financial sustainability indicators for 2007 to 2011 are provided in Appendix B.
Underlying result
Figure 6F suggests a steady improvement in the underlying result of the ARMBs since 2008 with all five resorts now at a low risk. The underlying result indicator for Lake Mountain has improved from 15 per cent in 2010 to 26 per cent in 2011. In addition to support payments received, Lake Mountain is now able to operate at full capacity after replacing its assets destroyed by bushfires in February 2009.
Figure 6F
Underlying result risk assessment
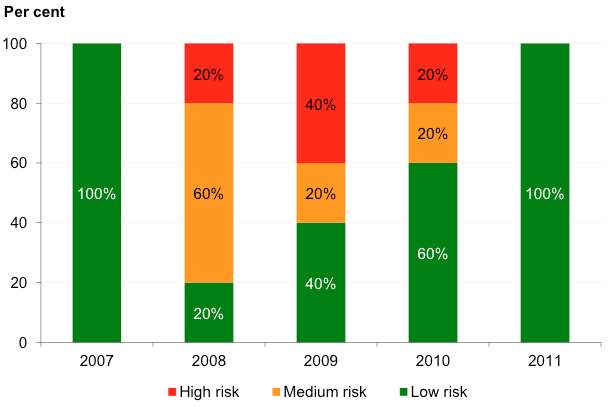
Source: Victorian Auditor-General's Office.
However, without significant support payments from DSE two resorts would have recorded operating deficits in 2011. Operating deficits are of concern in that, while manageable in the short term, over the longer term persistent deficits will affect an entity’s ability to sustain it operations. If operating deficits persist there is a risk that cash reserves become depleted and expenditure on capital programs may need to be curtailed. In particular, expenditure that is perceived to be discretionary, especially for maintenance, may be deferred or abandoned.
Liquidity
Figure 6G shows that the overall ability of ARMBs to repay short-term liabilities has remained stable over the past three years.
The liquidity indicator for Mount Baw Baw has fallen to a low risk in 2011 for the first time in four years. However, Lake Mountain recorded its first high-risk assessment for the five-year period under review, due to significant spending on capital infrastructure during 2011 which reduced its cash holdings. All other ARMBs have maintained a low‑risk assessment.
Figure 6G
Liquidity risk assessment
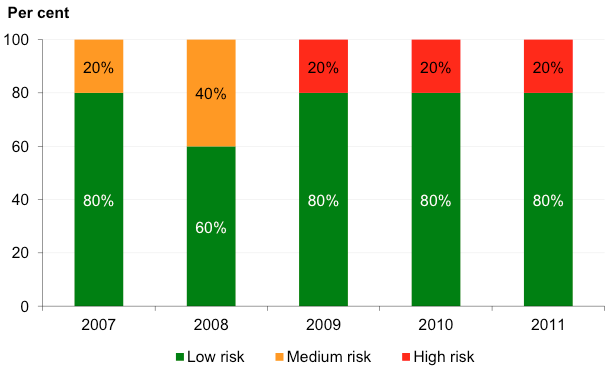
Source: Victorian Auditor-General's Office.
Debt-to-equity
Maintaining a low debt-to-equity indicator is important as it shows that the ARMBs are able to comfortably meet their repayment obligations from own-source revenues. While the sector’s overall debt level is low at $4.7 million (2010, $4.2 million), interest bearing liabilities represent 38 per cent of ARMBs’ liabilities (2010, 33 per cent).
Figure 6H shows that the average debt-to-equity indicator for all ARMBs remained at a similar low-risk level from 2007 to 2011.
Figure 6H
Average debt-to-equity indicator
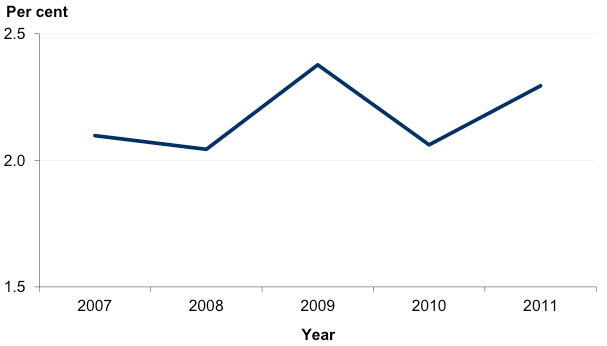
Source: Victorian Auditor-General's Office.
Self-financing
Figure 6I shows some improvement in the self-financing results of the ARMBs since 2008, with none of the five resorts registering as a high risk assessment in 2011. A low risk assessment indicates that an entity can effectively replace their assets over the long term using cash generated by their operations. Mount Hotham and Mount Buller and Mount Stirling were assessed as medium risk.
Figure 6I
Self-financing risk assessment
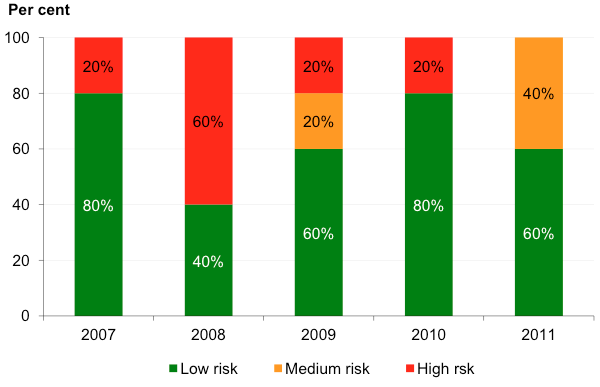
Source: Victorian Auditor-General's Office.
Capital replacement
The nature of alpine activities and services provided to residents and visitors means the industry is capital intensive and heavily reliant on capital infrastructure to generate revenue. The capital replacement indicator is a long-term measure of a resort’s ability to replace these capital assets.
Caution is required when interpreting these results, as annual spending on assets includes new and expanded facilities, in addition to existing facilities. As a result, the true level of spending on asset renewal is less than indicated.
Figure 6J shows the capital replacement risk assessment for ARMBs has steadily improved since 2008, with only one ARMB recording a risk capital replacement indicator of less than one in 2011.
Figure 6J
Capital replacement risk assessment
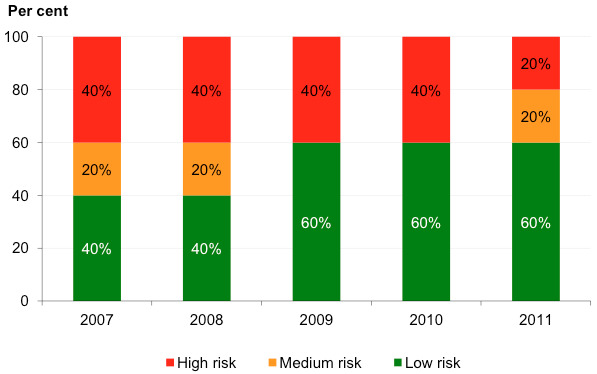
Source: Victorian Auditor-General's Office.
6.6 Effectiveness of general internal controls
All ARMBs operate adequate internal controls to maintain the reliability of financial reporting, the efficiency and effectiveness of their operations, and compliance with relevant laws and regulations. Poor controls diminish management’s ability to achieve their entities’ objectives and comply with relevant legislation, and increase the risk of fraud occurring.
Where certain factors have a significant impact on the financial statements, we report these matters to management.
6.6.1 Control weaknesses identified
Our audits confirmed that the ARMBs’ internal controls were sufficient to produce a reliable financial report. This year the internal controls have improved, as common weaknesses identified previously have been corrected.
Nevertheless, we identified instances where important internal control activities needed to be strengthened. These matters were reported to boards and the management teams. Areas of identified control weaknesses related to:
- changes to the payroll masterfile
- processing of general ledger journals
- asset stocktakes
- cash reconciliations
- calculation of employee benefits provisions.
These control weaknesses were not systemic across the sector. In many instances those concerns that had been raised with management in the past have been addressed. Findings raised during the course of our 2011 audits were not matters that had been previously raised.
Recommendations
- The Alpine Resorts Co-ordinating Council together with Lake Mountain and Mount Baw Baw alpine resort management boards should investigate the potential for implementing revised operating arrangements to improve their longer-term financial viability.
- Alpine resort management boards should continue to address commonly identified internal control weaknesses to ensure they are operating in a reliable and sustainable manner.
Appendix A. Acronyms and glossary
Acronyms
| AASB | Australian Accounting Standards Board |
| ARCC | Alpine Resorts Co-ordinating Council |
| ARMB | Alpine Resort Management Board |
| ASIC | Australian Securities and Investments Commission |
| DEECD | Department of Education and Early Childhood Development |
| DSE | Department of Sustainability and Environment |
| DTF | Department of Treasury and Finance |
| FMA | Financial Management Act 1994 |
| FRD | Financial Reporting Direction |
| IT | Information Technology |
| KPI | Key Performance Indicator |
| PAEC | Public Accounts and Estimates Committee |
| SSA | State Services Authority |
| TAFE | Technical and Further Education |
| VAGO | Victorian Auditor-General's Office |
Glossary
Accountability
Responsibility on public sector entities to achieve their objectives, with regard to reliability of financial reporting, effectiveness and efficiency of operations, compliance with applicable laws, and reporting to interested parties.
Amortisation
The systematic allocation of the depreciable amount of an intangible asset over its expected useful life.
Asset
A resource controlled by an entity as a result of past events, and from which future economic benefits are expected to flow to the entity.
Asset useful life
An asset’s useful life is the period over which it is expected to provide the entity with economic benefits. Depending on the nature of the asset, the useful life can be expressed in terms of time or output.
Audit Act 1994
The Audit Act 1994 establishes the operating powers and responsibilities of the Auditor-General. This includes the operations of his office—VAGO as well as the nature and scope of audits conducted by VAGO.
Auditor’s opinion
Positive written expression within a specified framework indicating the auditor’s overall conclusion on the financial report based on audit evidence obtained.
Capital expenditure
Amount capitalised to the balance sheet for contributions by a public sector entity to major assets owned by the entity, including expenditure on:
- capital renewal of existing assets that returns the service potential or the life of these assets
- expenditure on new assets, including buildings, infrastructure, plant and equipment
Corporations Act 2001
The Corporations Act 2001 is an act of the Commonwealth of Australia that sets out the laws dealing with business entities in Australia at federal and state levels. It focuses primarily on companies, although it also covers some laws relating to other entities such as partnerships and managed investment schemes.
Depreciation
The systematic allocation of the value of an asset over its expected useful life.
Employee benefits provision
The liability recognised for employees accrued service entitlements, including all accrued costs related to employment comprising of wages and salaries, leave entitlements, redundancy payments and superannuation contributions.
Entity
Is a body whether corporate or unincorporated that has a public function to exercise on behalf of the state or is wholly owned by the state, including departments, statutory authorities, statutory corporations and government business enterprises.
Equity or net assets
Residual interest in the assets of an entity after deduction of its liabilities.
Expense
Outflows or other depletions of economic benefits in the form of incurrence of liabilities or depletion of assets of the entity.
Fair value
The amount for which a financial or non-financial asset could be exchanged between knowledgeable and willing parties in an arm’s-length transaction.
Financial delegation
A schedule that specifies the level or approval required for each transaction category to facilitate the execution of functions necessary for the efficient operation of the entity.
Financial reporting direction
Financial reports are prepared in accordance with Australian Accounting Standards and Interpretations as issued by AASB. When an AASB standard provides accounting treatment options, the Minister for Finance issues financial reporting directions to ensure consistent application of accounting treatment across the Victorian public sector in compliance with that particular standard.
Financial sustainability
An entity’s ability to manage financial resources so it can meet spending commitments, both at present and into the future.
Financial year
A period of 12 months for which a financial report is prepared.
Going concern
An entity which is expected to be able to pay its debts as and when they fall due, and continue in operation without any intention or necessity to liquidate or otherwise wind up its operations.
Internal control
Internal control is a means by which an entity’s resources are directed, monitored and measured. It plays an important role in preventing and detecting error and fraud and protecting the entity’s resources.
Liability
A present obligation of the entity arising from past events, the settlement of which is expected to result in an outflow from the entity of resources embodying economic benefits.
Masterfile
A database of entries containing data that does not often change (for example, address and bank account details).
Materiality
Information is material if its omission or misstatement could influence the economic decisions of users taken on the basis of the financial report. Materiality depends on the size or nature of the item or error judged in the particular circumstances of its omission or misstatement.
Net result
The net result is calculated by subtracting an entity’s total expenses from the total revenue, to show what the entity has earned or lost in a given period of time.
Non-reciprocal
Transfers in which an entity receives assets without directly giving equal value in exchange to the other party to the transfer.
Audit opinion types
The types of audit opinions in an auditor’s report and the basis for issuing these reports are as follows:
- A clear opinion indicates that the financial report has been prepared in accordance with the requirements of the relevant legislation and Australian accounting standards.
- An emphasis of matter includes a paragraph that draws attention to a disclosure or item in the financial report. The addition of such an emphasis of matter does not affect the auditor’s opinion.
- A qualified opinion is expressed when the auditor concludes that an unqualified opinion cannot be expressed due to a disagreement with management, a conflict between applicable financial reporting frameworks or a scope limitation; however, the effect is not so material and pervasive as to require an adverse opinion. The qualified opinion is expressed as being ‘except for’ the effects of the matter to which the qualification relates.
- A disclaimer of opinion is expressed when a limitation of scope of the auditor’s work exists and the possible effect of the limitation on scope is so material and pervasive that the auditor has not been able to obtain sufficient appropriate audit evidence, and accordingly is unable to express an opinion on the financial statements.
- An adverse opinion is expressed when the effect of a disagreement with management or a conflict between applicable financial reporting frameworks is so material or pervasive to the financial statements that the auditor concludes that a qualification is not adequate to disclose the misleading or incomplete nature of the financial statements.
Revenue
Inflows or other enhancements or savings in outflows of service potential, or future economic benefits in the form of increases in assets or reductions in liabilities of the entity.
Risk
The chance of a negative impact on the objectives, outputs or outcomes of the entity.
Tertiary education sector
Tertiary education sector refers to the eight universities and 14 TAFE institutes.
Appendix B. Financial sustainability indicators and criteria
Indicators of financial sustainability
Figure B1
Financial
sustainability indicators
Indicator |
Formula |
Description |
|---|---|---|
Underlying result (%) |
Adjusted net surplus / Total underlying revenue |
A positive result indicates a surplus, and the larger the percentage, the stronger the result. A negative result indicates a deficit. Operating deficits cannot be sustained in the long term. Underlying revenue does not take into account one-off or non-recurring transactions. Net result and total underlying revenue is obtained from the comprehensive operating statement and is adjusted to take into account large one-off (non-recurring) transactions. |
Liquidity (ratio) |
Current assets / Current liabilities |
This measures the ability to pay existing liabilities in the next 12 months. A ratio of one or more means there are more cash and liquid assets than short-term liabilities. Current liabilities exclude long-term employee provisions and revenue in advance. |
Debt-to-equity (%) |
Debt / Equity |
This is a longer-term measure that compares all current and non-current interest bearing liabilities to equity. It complements the liquidity ratio which is a short-term measure. A low ratio indicates less reliance on debt to finance the capital structure of an organisation. |
Self-financing (%) |
Net operating cash flows / Underlying revenue |
Measures the ability to replace assets using cash generated by the entity’s operations. The higher the percentage the more effectively this can be done. Net operating cash flows are obtained from the cash flow statement. |
Capital replacement (ratio) |
Cash outflows for property, plant and equipment / Depreciation |
Comparison of the rate of spending on infrastructure with its depreciation. Ratios higher than 1:1 indicate that spending is faster than the depreciating rate. This is a long-term indicator, as capital expenditure can be deferred in the short term if there are insufficient funds available from operations, and borrowing is not an option. Cash outflows for infrastructure are taken from the cash flow statement. Depreciation is taken from the comprehensive operating statement. |
Source: Victorian Auditor-General's Office.
These indicators should be considered collectively, and are more useful when assessed over time as part of a trend analysis. These indicators have been applied to the published financial information of universities, technical and further education (TAFE) institutes and alpine resort management boards (ARMBs) for the period from 2007 to 2011.
The analysis of financial sustainability in this report reflects on the position of each individual entity, and for the university sector, TAFE sector, and alpine resort sector, respectively. The financial sustainability indicators used in this report are consistent with those used in previous reports to Parliament, and are indicative of the financial sustainability of universities, TAFEs and ARMBs.
Financial sustainability risk assessment criteria
The financial sustainability of each university, TAFE and ARMB has been assessed using the risk criteria outlined in Figure B2.
Figure B2
Financial
sustainability indicators – risk assessment criteria
Risk |
Underlying result |
Liquidity |
Debt-to-equity |
Self-financing |
Capital replacement |
|---|---|---|---|---|---|
High |
Negative 10% or less Insufficient revenue is being generated to fund operations and asset renewal. |
Less than 0.7 Immediate sustainability issues with insufficient current assets to cover liabilities. |
More than 60% Potential long‑term concern over ability to repay debt levels from own source revenue. |
Less than 10% Insufficient cash from operations to fund new assets and asset renewal. |
Less than 1.0 Spending on capital works has not kept pace with consumption of assets. |
Medium |
Negative 10%–0% A risk of long‑term run down to cash reserves and inability to fund asset renewals. |
0.7–1.0 Need for caution with cash flow, as issues could arise with meeting obligations as they fall due. |
40–60% Some concern over the ability to repay the debt from own source revenue. |
10–20% May not be generating sufficient cash from operations to fund new assets. |
1.0–1.5 May indicate spending on asset renewal is insufficient. |
Low |
More than 0% Generating surpluses consistently. |
More than 1.0 No immediate issues with repaying short‑term liabilities as they fall due. |
Less than 40% No concern over the ability to repay debt from own source revenue. |
More than 20% Generating enough cash from operations to fund new assets. |
More than 1.5 Low risk of insufficient spending on asset renewal. |
Source: Victorian Auditor-General's Office.
The overall financial sustainability risk assessment has been calculated using the ratings determined for each indicator as outlines in Figure B3.
Figure B3
Overall financial
sustainability risk assessment
Risk rating |
Risk indicators |
|---|---|
|
High risk of short-term and immediate sustainability concerns indicated by:
|
|
Medium risk of long-term sustainability concerns indicated by either:
|
|
Low risk of financial sustainability concerns—there are no high-risk indicators |


Source: Victorian Auditor-General's Office.
Financial sustainability trend key:
![]() = Improving trend
= Improving trend
![]() = Deteriorating trend
= Deteriorating trend
 = No substantial trend identified.
Universities
Underlying result
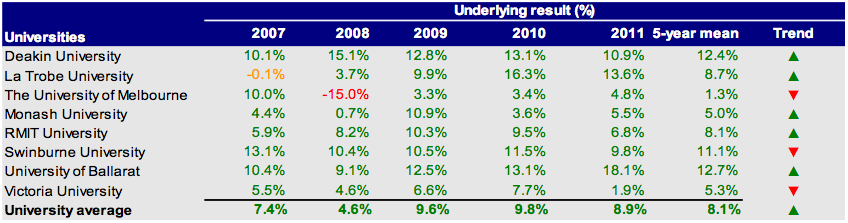
Source: Victorian Auditor-General's Office.
Liquidity
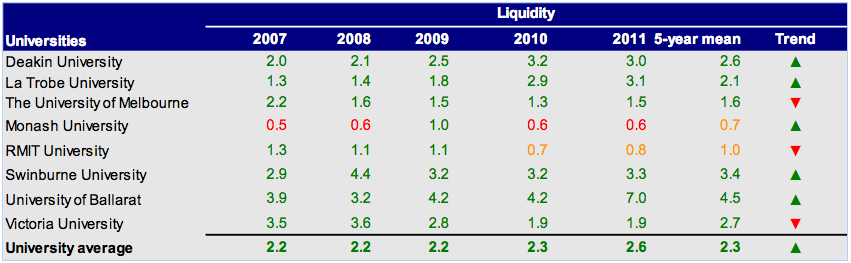
Source: Victorian Auditor-General's Office.
Debt-to-equity
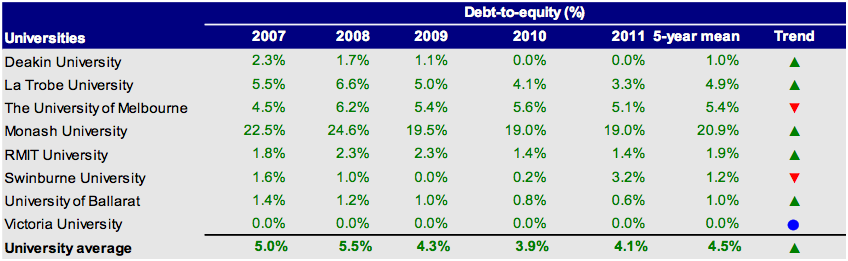
Source: Victorian Auditor-General's Office.
Self-financing
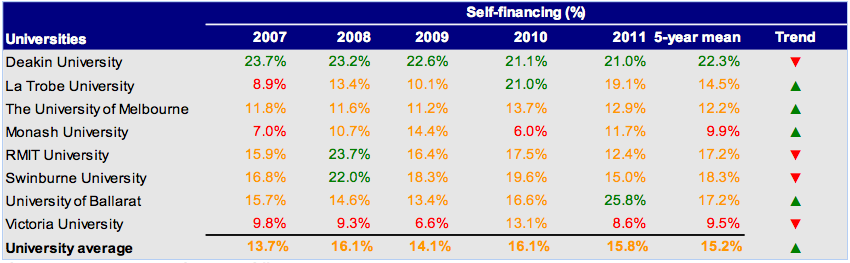
Source: Victorian Auditor-General's Office.
Capital replacement
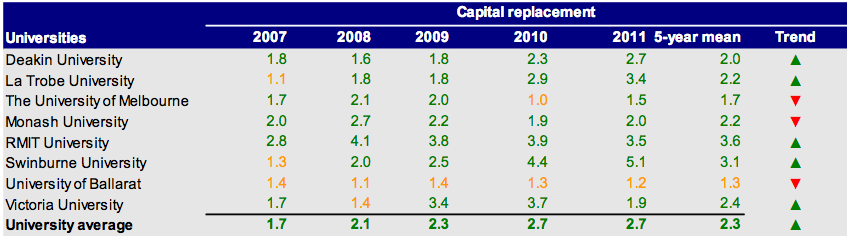
Source: Victorian Auditor-General's Office.
TAFEs
Underlying result
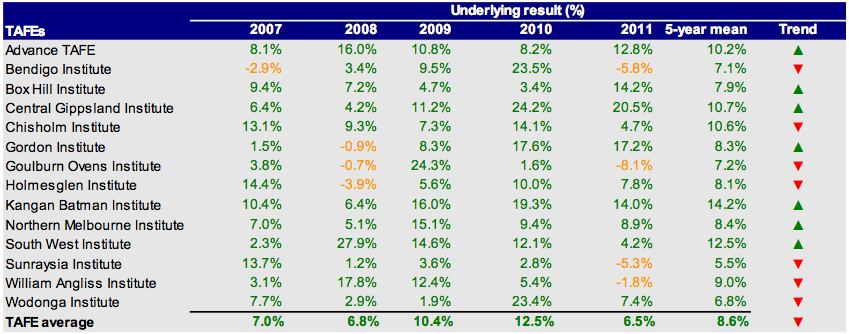
Source: Victorian Auditor-General's Office.
Liquidity
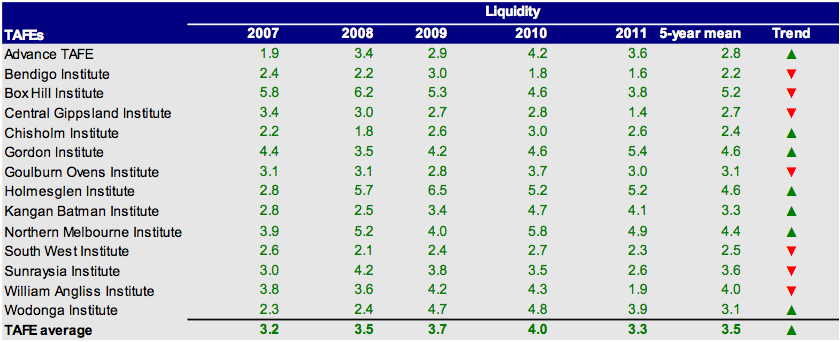
Source: Victorian Auditor-General's Office.
Debt-to-equity
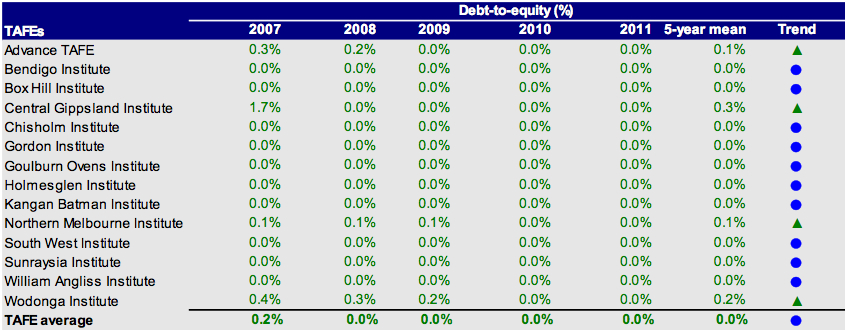
Source: Victorian Auditor-General's Office.
Self-financing
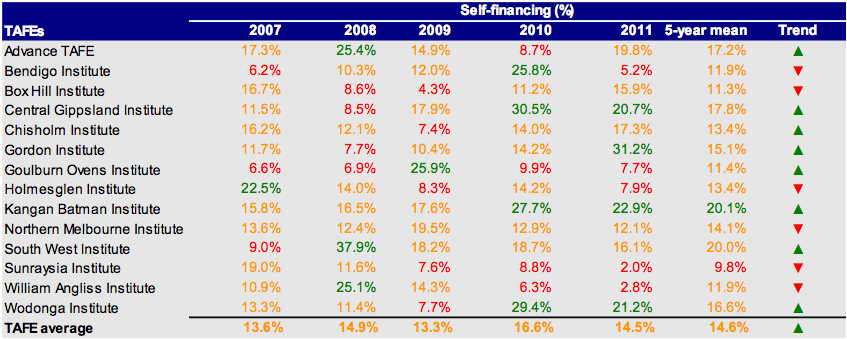
Source: Victorian Auditor-General's Office.
Capital replacement
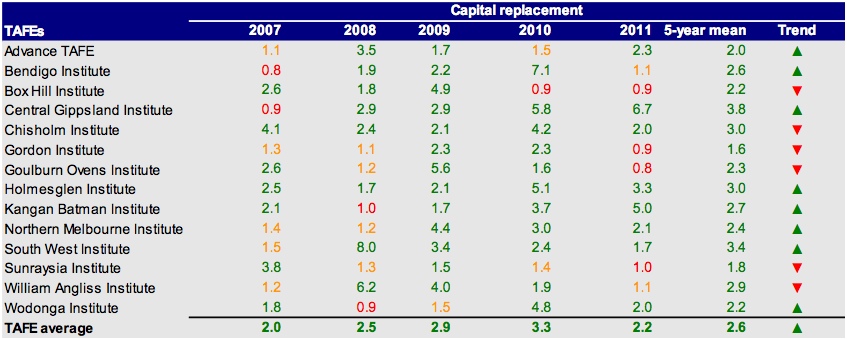
Source: Victorian Auditor-General's Office.
Alpine resorts
Underlying result
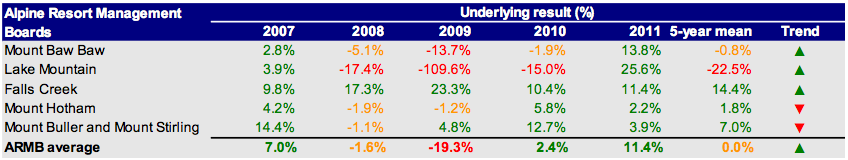
Source: Victorian Auditor-General's Office.
Liquidity
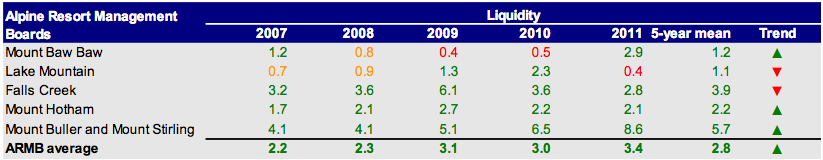
Source: Victorian Auditor-General's Office.
Debt-to-equity
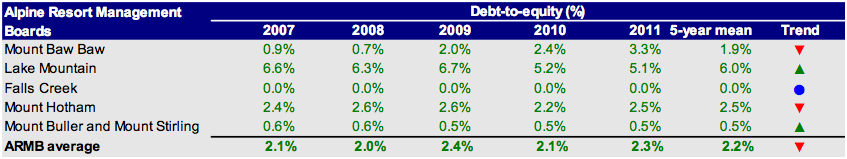
Source: Victorian Auditor-General's Office.
Self-financing
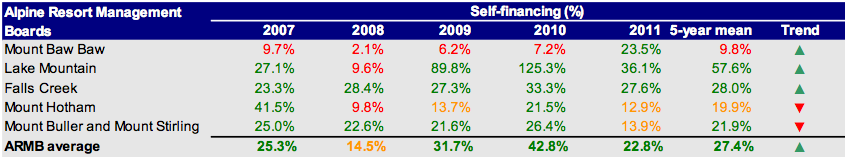
Source: Victorian Auditor-General's Office.
Capital replacement
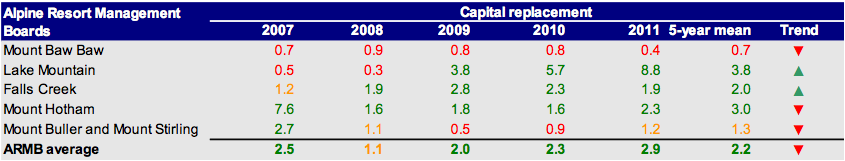
Source: Victorian Auditor-General's Office.
Appendix C. Reports on the results of the 2010–11 financial audits
Reports
This report is the last of six reports to be presented to Parliament covering the results of our audits of public sector financial reports. The reports in this series are outlined in Figure C1.
Figure C1
VAGO reports on the results of the 2010–11 financial audits
Report |
Description |
|---|---|
Auditor-General’s Report on the Annual Financial Report of the State of Victoria, 2010–11 |
Reports on the results of the audit of the state’s annual financial report and addresses the quality and timeliness of financial reporting, explanation of significant financial results for the state and observations on the status and financial implications of significant projects and developments that occurred during 2010–11 and subsequent to year end. Tabled in Parliament on 9 November 2011. |
Public Hospitals: Results of the 2010–11 Audits |
This report provides the results of the audits of 112 entities, addressing the timeliness of their financial reporting, their financial sustainability, and aspects of how they manage procurement and information technology security. Tabled in Parliament on 9 November 2011. |
Water Entities: Results of the 2010–11 Audits |
The report provides the results of the audits of 20 water entities addressing the timeliness of their financial and performance reporting, their financial sustainability and aspects of how they manage declarations of interests, asset valuations and outsourcing. Tabled in Parliament on 9 November 2011. |
Portfolio Departments and Associated Entities: Results of the 2010–11 Audits |
The report provides the results of the annual financial statement audits of approximately 210 entities. The report includes comment on the timeliness of their financial reporting, financial sustainability and aspects of how they manage grants administration, employee leave, information technology change, and information technology security. Tabled in Parliament on 23 November 2011. |
Local Government: Results of the 2010–11 Audits |
The report provides the results of the audits of approximately 100 entities in the local government sector. It addresses the timeliness of their financial and performance reporting, their financial sustainability, their utilisation of internal audit and aspects of how they manage assets and procurement. Tabled in Parliament on 23 November 2011. |
Tertiary Education and Other Entities: Results of the 2011 Audits |
The report provides the results of the annual financial audits of approximately 106 entities with a financial year end other than 30 June 2011. It addresses the timeliness of their financial and performance reporting, their financial sustainability and aspects of how they manage information technology security, capital projects and international student fee revenue. Tabled in Parliament on 23 May 2012. |
Source: Victorian Auditor-General's Office.
Appendix D. Audit status
Tertiary education
Audit type |
Financial statements |
Timeliness of financial statements completion |
|||||
|---|---|---|---|---|---|---|---|
Entity |
FMA |
Non-FMA |
Clear opinion |
Opinion date |
Up to 12 weeks |
12 to 18 weeks |
More than 18 weeks |
COMPLETED AUDITS – 31 DECEMBER 2011 BALANCE DATES |
|||||||
UNIVERSITIES |
|||||||
Deakin University Reason for qualification: Grant income recognised as liabilities rather than as income, as required by AASB 1004 Contributions. |
Yes |
No |
16-Mar-12 |
Yes |
|||
Callista Software Services Pty Ltd |
Yes |
Yes |
14-Mar-12 |
Yes |
|||
Deakin Foundation Trust |
Yes |
Yes |
14-Mar-12 |
Yes |
|||
Deakin Foundation Limited |
Yes |
Yes |
14-Mar-12 |
Yes |
|||
Deakin Nominee’s Pty Ltd |
Yes |
Yes |
14-Mar-12 |
Yes |
|||
Deakin Residential Services Pty Ltd |
Yes |
Yes |
14-Mar-12 |
Yes |
|||
Unilink Limited |
Yes |
Yes |
14-Mar-12 |
Yes |
|||
La Trobe University |
Yes |
Yes |
07-Mar-12 |
Yes |
|||
La Trobe Innovation Pty Ltd |
Yes |
Yes |
10-May-12 |
Yes |
|||
La Trobe International Pty Ltd |
Yes |
Yes |
22-Mar-12 |
Yes |
|||
Medical Centre Developments Pty Ltd |
Yes |
Yes |
22-Mar-12 |
Yes |
|||
Monash University |
Yes |
Yes |
22-Mar-12 |
Yes |
|||
Monash Accommodation Services Pty Ltd |
Yes |
Yes |
06-Mar-12 |
Yes |
|||
Monash College Pty Ltd |
Yes |
Yes |
24-Feb-12 |
Yes |
|||
Monash Commercial Pty Ltd |
Yes |
Yes |
29-Feb-12 |
Yes |
|||
Monash Educational Enterprises Audit report contained an ‘emphasis of matter’: Attention drawn to the need for continuing financial support from Monash University. |
Yes |
Yes |
05-Mar-12 |
Yes |
|||
Monash Health Research Precinct Pty Ltd |
Yes |
Yes |
27-Feb-12 |
Yes |
|||
Monash Investment Holdings Pty Ltd |
Yes |
Yes |
02-Mar-12 |
Yes |
|||
Monash Investment Trust |
Yes |
Yes |
02-Mar-12 |
Yes |
|||
Monash Property South Africa Pty Ltd |
Yes |
Yes |
24-Feb-12 |
Yes |
|||
Monash South Africa Ltd Audit report contained an ‘emphasis of matter’: Attention drawn to the need for continuing financial support from Monash University. |
Yes |
Yes |
05-Mar-12 |
Yes |
|||
Monash University Foundation |
Yes |
Yes |
01-Mar-12 |
Yes |
|||
Monash University Foundation Pty Ltd |
Yes |
Yes |
29-Feb-12 |
Yes |
|||
Royal Melbourne Institute of Technology |
Yes |
Yes |
29-Feb-12 |
Yes |
|||
Meltech Services Limited |
Yes |
Yes |
29-Feb-12 |
Yes |
|
||
RMIT Drug Discovery Technologies Pty Ltd Audit report contained an ‘emphasis of matter’: Attention drawn to the need for continuing financial support from Royal Melbourne Institute of Technology. |
Yes |
Yes |
02-Mar-12 |
Yes |
|||
RMIT Foundation |
Yes |
Yes |
28-Feb-12 |
Yes |
|
||
RMIT International University Vietnam |
Yes |
Yes |
29-Feb-12 |
Yes |
|||
RMIT Training Pty Ltd |
Yes |
Yes |
08-Feb-12 |
Yes |
|
||
RMIT Vietnam Holdings Pty Ltd |
Yes |
Yes |
29-Feb-12 |
Yes |
|||
Spatial Vision Innovations Pty Ltd |
Yes |
Yes |
10-Feb-12 |
Yes |
|||
RMIT Link |
Yes |
Yes |
24-Feb-12 |
Yes |
|||
Swinburne University of Technology |
Yes |
Yes |
09-Mar-12 |
Yes |
|||
National Institute of Circus Arts Limited |
Yes |
Yes |
05-Mar-12 |
Yes |
|||
Swinburne College Pty Ltd |
Yes |
Yes |
05-Mar-12 |
Yes |
|||
Swinburne (Holdings) Pty Ltd |
Yes |
Yes |
16-Mar-12 |
Yes |
|||
Swinburne Intellectual Property Trust |
Yes |
Yes |
16-Mar-12 |
Yes |
|||
Swinburne Ltd |
Yes |
Yes |
09-Mar-12 |
Yes |
|||
Swinburne Student Amenities Association Ltd |
Yes |
Yes |
05-Mar-12 |
Yes |
|||
Swinburne Ventures Limited |
Yes |
Yes |
16-Mar-12 |
Yes |
|||
The University of Melbourne Reason for qualification: Grant income recognised as liabilities rather than as income, as required by AASB 1004 Contributions. |
Yes |
No |
19-Mar-12 |
Yes |
|||
Australian International Health Institute (The University of Melbourne) Ltd |
Yes |
Yes |
23-Mar-12 |
Yes |
|||
Australian Music Examinations Board (Vic) Ltd |
Yes |
Yes |
23-Mar-12 |
Yes |
|||
Australian National Academy of Music Foundation Ltd |
Yes |
Yes |
30-Mar-12 |
Yes |
|||
Australian National Academy of Music Ltd |
Yes |
Yes |
30-Mar-12 |
Yes |
|||
Melbourne Business School Foundation trust |
Yes |
Yes |
14-Mar-12 |
Yes |
|||
Melbourne Business School Foundation Ltd |
Yes |
Yes |
14-Mar-12 |
Yes |
|||
Melbourne Business School Ltd |
Yes |
Yes |
14-Mar-12 |
Yes |
|||
Mount Eliza Graduate School of Business and Government Limited |
Yes |
Yes |
14-Mar-12 |
Yes |
|||
MU Student Union Ltd |
Yes |
Yes |
28-Mar-12 |
Yes |
|||
UM Commercialisation Pty Ltd |
Yes |
Yes |
20-Apr-12 |
Yes |
|||
UM Commercialisation Trust |
Yes |
Yes |
20-Apr-12 |
Yes |
|||
University of Ballarat |
Yes |
Yes |
24-Feb-12 |
Yes |
|||
Datascreen Pty Ltd |
Yes |
Yes |
23-Mar-12 |
Yes |
|||
Inskill Pty Ltd |
Yes |
Yes |
23-Mar-12 |
Yes |
|||
The School of Mines and Industries Ballarat Limited |
Yes |
Yes |
23-Mar-12 |
Yes |
|||
Victoria University |
Yes |
Yes |
16-Mar-12 |
Yes |
|||
Victoria University Enterprises Pty Ltd |
Yes |
Yes |
16-Mar-12 |
Yes |
|||
Victoria University Foundation |
Yes |
Yes |
16-Mar-12 |
Yes |
|||
Victoria University Foundation Ltd |
Yes |
Yes |
16-Mar-12 |
Yes |
|||
Victoria University International Pty Ltd |
Yes |
Yes |
16-Mar-12 |
Yes |
|||
Victoria University of Technology (Singapore) Pty Ltd |
Yes |
Yes |
16-Mar-12 |
Yes |
|||
TAFE INSTITUTES |
|||||||
Advance Institute of Technical and Further Education |
Yes |
Yes |
02-Mar-12 |
Yes |
|||
Bendigo Regional Institute of Technical and Further Education |
Yes |
Yes |
28-Feb-12 |
Yes |
|||
Box Hill Institute of Technical and Further Education |
Yes |
Yes |
07-Mar-12 |
Yes |
|||
Box Hill Enterprises Ltd |
Yes |
Yes |
07-Mar-12 |
Yes |
|||
Central Gippsland Institute of Technical and Further Education |
Yes |
Yes |
07-Mar-12 |
Yes |
|||
Chisholm Institute of Technical and Further Education |
Yes |
Yes |
05-Mar-12 |
Yes |
|||
Caroline Chisholm Education Foundation |
Yes |
Yes |
05-Mar-12 |
Yes |
|||
Gordon Institute of Technical and Further Education |
Yes |
Yes |
07-Mar-12 |
Yes |
|||
GOTEC Limited |
Yes |
Yes |
07-Mar-12 |
Yes |
|||
Goulburn Ovens Institute of Technical and Further Education |
Yes |
Yes |
13-Mar-12 |
Yes |
|||
Holmesglen Institute of Technical and Further Education |
Yes |
Yes |
09-Mar-12 |
Yes |
|||
Holmesglen International Training Services Pty Ltd |
Yes |
Yes |
14-Mar-12 |
Yes |
|||
Kangan Batman Institute of Technical and Further Education |
Yes |
Yes |
16-Mar-12 |
Yes |
|||
John Batman Consultancy & Training Pty Ltd |
Yes |
Yes |
16-Mar-12 |
Yes |
|||
Northern Melbourne Institute of Technical and Further Education |
Yes |
Yes |
07-Mar-12 |
Yes |
|||
South West Institute of Technical and Further Education |
Yes |
Yes |
16-Mar-12 |
Yes |
|||
Sunraysia Institute of Technical and Further Education |
Yes |
Yes |
08-Mar-12 |
Yes |
|||
TAFE Kids Incorporated |
Yes |
Yes |
14-Mar-12 |
Yes |
|||
TAFE Work Safety Centre |
Yes |
Yes |
23-Mar-12 |
Yes |
|||
William Angliss Institute of Technical and Further Education |
Yes |
Yes |
15-Mar-12 |
Yes |
|||
Angliss Consulting Pty Ltd |
Yes |
Yes |
15-Mar-12 |
Yes |
|||
William Angliss Institute Foundation |
Yes |
Yes |
15-Mar-12 |
Yes |
|||
Angliss Multimedia Pty Ltd |
Yes |
Yes |
15-Mar-12 |
Yes |
|||
Angliss Solutions Pty Ltd |
Yes |
Yes |
15-Mar-12 |
Yes |
|||
Wodonga Institute of Technical and Further Education |
Yes |
Yes |
24-Feb-12 |
Yes |
|||
Training Entities |
|||||||
Adult Multicultural Education Services |
Yes |
Yes |
29-Feb-12 |
Yes |
|||
Centre for Adult Education |
Yes |
Yes |
13-Mar-12 |
Yes |
|||
Driver Education Centre of Australia Ltd Audit report contained an ‘emphasis of matter’: Attention drawn to the need for continuing financial support from Skills Victoria. |
Yes |
Yes |
11-Apr-12 |
Yes |
|||
International Fibre Centre Limited |
Yes |
Yes |
29-Feb-12 |
Yes |
|||
TAFE Development Centre |
Yes |
Yes |
22-Mar-12 |
Yes |
|||
Telematics Course Development Fund |
Yes |
Yes |
26-Apr-12 |
Yes |
|||
VERNet Pty Ltd |
Yes |
Yes |
22-Mar-12 |
Yes |
|||
2011 Total |
26 |
68 |
|
86 |
7 |
1 |
|
94 |
94 |
||||||
2010 Total |
25 |
78 |
82 |
21 |
0 |
||
103 |
103 |
||||||
INCOMPLETE AUDITS – 7 MAY 2012 |
|||||||
Australian Regenerative Medicine Institute Joint Venture |
Yes |
Audited financial statements yet to be finalised |
|||||
DECA Ltd |
Yes |
Audited financial statements yet to be finalised |
|||||
Melbourne University Publishing Ltd |
Yes |
Audited financial statements yet to be finalised |
|||||
Monash Custodians Pty Ltd |
Yes |
Audited financial statements yet to be finalised |
|||||
2011 Total |
0 |
4 |
|||||
4 |
|||||||
2010 Total |
1 |
1 |
|||||
2 |
|||||||
Alpine resorts
Audit type |
Financial statements |
Timeliness of financial statements completion |
|||||
|---|---|---|---|---|---|---|---|
Entity |
FMA |
Non-FMA |
Clear opinion |
Opinion date |
Up to 12 weeks |
12 to 18 weeks |
More than 18 weeks |
COMPLETED AUDITS – 31 OCTOBER 2011 BALANCE DATES |
|||||||
Falls Creek Alpine Resort Management Board |
Yes |
Yes |
20-Dec-11 |
Yes |
|||
Lake Mountain Alpine Resort Management Board Audit report contained an ‘emphasis of matter’: Attention drawn to the need for continuing financial support from Department of Sustainability and the Environment. |
Yes |
Yes |
05-Jan-12 |
Yes |
|||
Mount Baw Baw Alpine Resort Management Board Audit report contained an ‘emphasis of matter’: Attention drawn to the need for continuing financial support from Department of Sustainability and the Environment. |
Yes |
Yes |
04-Jan-12 |
Yes |
|||
Mount Buller and Mount Stirling Alpine Resort Management Board |
Yes |
Yes |
17-Jan-12 |
Yes |
|||
Mount Hotham Alpine Resort Management Board |
Yes |
Yes |
12-Jan-12 |
Yes |
|||
2011 Total |
5 |
0 |
5 |
0 |
0 |
||
5 |
5 |
||||||
2010 Total |
5 |
0 |
5 |
0 |
0 |
||
5 |
5 |
||||||
Other entities
Audit type |
Financial statements |
Timeliness of financial statements completion |
|||||
|---|---|---|---|---|---|---|---|
Entity |
FMA |
Non-FMA |
Clear opinion |
Opinion date |
Up to 12 weeks |
12 to 18 weeks |
More than 18 weeks |
COMPLETED AUDITS – 31 OCTOBER 2011 BALANCE DATES |
|||||||
MAPS Group Limited |
Yes |
Yes |
05-Mar-12 |
Yes |
|||
COMPLETED AUDITS – 31 DECEMBER 2011 BALANCE DATES |
|||||||
Anti-Cancer Council of Victoria Reason for qualification: Unable to assess the completeness of cash donations as inherent risk in collecting this type of revenue cannot be mitigated by further internal controls. |
Yes |
No |
16-Mar-12 |
Yes |
|||
2011 Total |
1 |
1 |
1 |
0 |
1 |
||
2 |
2 |
||||||
2010 Total |
1 |
1 |
1 |
0 |
1 |
||
2 |
2 |
||||||
NOT COMMENCED AUDITS – 31 MARCH 2012 BALANCE DATES |
|||||||
Melbourne Cricket Ground Trust |
Yes |
Audited financial statements yet to be finalised |
|||||
Source: Victorian Auditor-General’s Office
Appendix E. Audit Act 1994 section 16—submissions and comments
Introduction
In accordance with section 16(3) of the Audit Act 1994 relevant extracts from the report were provided to all universities, TAFEs, alpine resort management boards, the Department of Treasury and Finance, the Department of Education and Early Childhood Development and the Department of Sustainability and Environment with a request for submissions or comments.
The submission and comments provided are not subject to audit nor the evidentiary standards required to reach an audit conclusion. Responsibility for the accuracy, fairness and balance of those comments rests solely with the agency head.
Responses were received as follows:
Further audit comment:
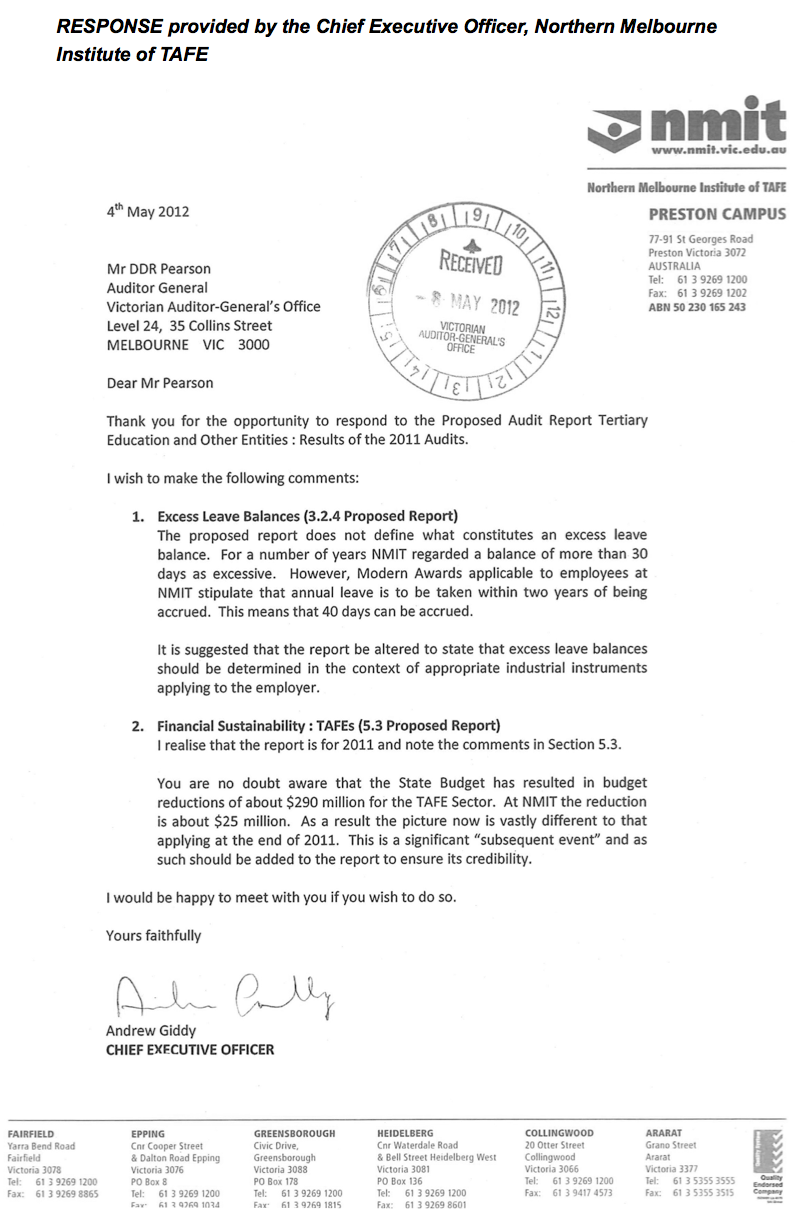
Auditor-General’s comment on the response from the Northern Melbourne Institute of TAFE
Excess leave balances
The report at page 18 has been amended to add ‘These limits are determined in the context of industrial agreements applying to the employer.’ A reference to a specific number of days has not been made as within the sector various industrial agreements set different limits for what constitutes excess leave.
Financial sustainability of TAFEs
The decision to reduce funding to the TAFE sector was a decision of government. Section 16(5) of the Audit Act 1994 specifically states that the Auditor-General is not entitled to question the merits of policy objectives of government.