Access to Emergency Healthcare
Audit snapshot
What we examined
We assessed whether the Department of Health (DH) and responsible agencies are addressing Victorians’ need for timely and equitable access to emergency healthcare.
We examined DH, Ambulance Victoria (AV) and 3 health services (The Royal Melbourne Hospital, Werribee Mercy Hospital and Bendigo Hospital).
Why this is important
Victorians should have access to timely emergency healthcare irrespective of where they live or their social or economic status.
When Victorians are unable to access emergency healthcare in a timely manner, it can negatively impact their health and overall quality of life.
What we concluded
From 2013–14 to 2022–23, Victorian health services met the target to immediately see all triage category 1 patients with life threatening conditions.
However, for the same period, health services did not meet their targets for:
- patients to be transferred from ambulance to the emergency department (ED) within 40 minutes
- patients to be seen within clinically recommended time
- length of stay in the ED.
DH, AV and audited health services understand the key drivers of demand and barriers to timely access to emergency healthcare, and the initiatives we examined address some of these factors.
DH is improving its performance monitoring and reporting systems, but it does not publish long term performance data.
What we recommended
We made 3 recommendations to DH about:
- investigating and addressing the root cause of why health service performance targets are not being met
- investigating and addressing potential differences in timely access to emergency healthcare for different population groups
- improving public reporting on timely access to emergency healthcare.
Video presentation
Key performance measures
Note: *Conditions that require immediate aggressive intervention.
**As recommended by the Australasian Triage Scale.
Source: VAGO.
Our recommendations
We made 3 recommendations to address 3 issues. The Department of Health accepted 2 recommendations in full and one in principle.
| Key issues and corresponding recommendations | Agency response | |||
|---|---|---|---|---|
| Issue: From 2013–14 to 2022–23, health services did not meet targets for some key performance measures for timely access to emergency healthcare | ||||
Department of Health
| 1
| In consultation with Victorian health services:
| Accepted
| |
| Issue: There are potential differences in the timeliness of access to emergency healthcare for different population groups over the period of 2013–14 to 2022–23 | ||||
Department of Health
| 2
| In consultation with Victorian health services, investigate the root cause and nature of differences in access to timely emergency healthcare for different population groups and put in place any necessary measures to ensure equitable access (see Section 1).
| Accepted
| |
| Issue: The public reporting of performance against key measures does not provide insights into long-term trends | ||||
Department of Health
| 3
| Improve its public reporting on timely access to emergency healthcare by:
| Accepted in principle
| |
What we found
This section summarises our key findings. The numbered sections that follow detail our complete findings, including supporting evidence.
When reaching our conclusions, we consulted with the Department of Health (DH), Ambulance Victoria and 3 health services (The Royal Melbourne Hospital, Werribee Mercy Hospital and Bendigo Hospital) and considered their views. The agencies’ full responses are in Appendix A.
Why we did this audit
It is an objective of the Health Services Act 1988 that an adequate range of essential health services is available to all Victorians irrespective of where they live or their social or economic status. This includes access to timely emergency healthcare.
When Victorians are unable to access emergency healthcare in a timely manner, it can negatively impact their health and overall quality of life.
Time in scope
We assessed the key performance measures for timely access to emergency healthcare over the most recent 10 financial years (2013–14 to 2022–23) to determine if health services met their targets to provide emergency healthcare to Victorians in a timely manner.
Key performance measures
DH sets out several performance measures in its annual statements of priorities with health services and Ambulance Victoria. We assessed the following key performance measures for timely access to emergency healthcare:
- patients transferred from ambulance to the emergency department (ED) within 40 minutes
- patients treated within clinically recommended time
- length of stay in the ED.
Experiences of different patient groups
We assessed how different population groups access emergency healthcare based on the key performance measures outlined above. We examined 5 different population groups:
- patients who prefer a language other than English
- First Nations peoples
- patients with a mental health indicator
- presentations in non-metro hospitals
- patients from lower socioeconomic postcodes.
Our key findings
We made 3 key findings:
1
| From 2013–14 to 2022–23, Victorian health services met the target to immediately see all triage category 1 patients with life-threatening conditions. For the same period, health services did not meet their targets for:
|
| 2 | DH, AV and audited health services understand the key drivers of demand and barriers to timely access to emergency healthcare, and the initiatives we examined address some of these factors. |
| 3 | DH is improving data collection and monitoring of health services. However, public reporting of health services' performance against key measures does not provide insights into long-term trends. |
Key finding 1: Victorian health services immediately see all triage category 1 patients with life-threatening conditions but do not meet other key performance targets
Targets for key performance measures
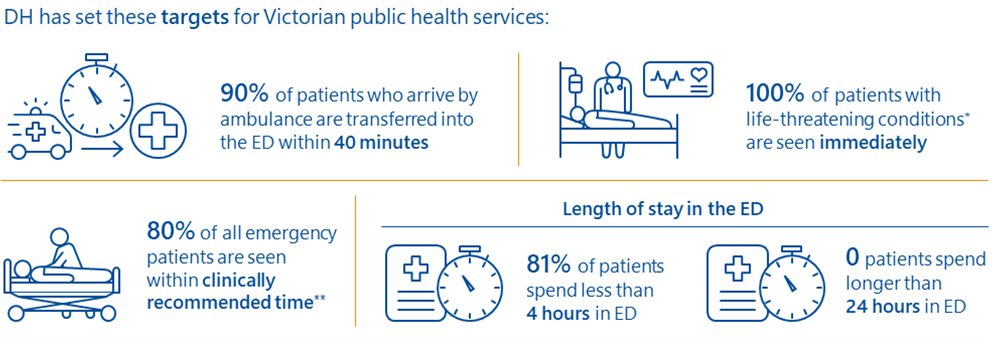
From 2013–14 to 2022–23, Victorian health services immediately attended to all triage category 1 patients presenting in the ED with life-threatening conditions. However, they did not meet the performance targets for other key timeliness measures (see Figure 1).
Figure 1: Key performance measures for timely access to emergency healthcare
| Key performance measure | Target | Performance | |
|---|---|---|---|
| Ambulance to the ED transfer | % of patients transferred from ambulance to the ED within 40 minutes | 90% | Below target |
| Time to treatment | % of (all) triage category 1 to 5 emergency patients (collectively) seen within clinically recommended time* | 80% | Below target |
| % of triage category 1 emergency patients (with immediately life-threatening conditions) seen immediately | 100% | Target achieved | |
| Length of stay in the ED | % of emergency patients with a length of stay in the ED of less than 4 hours | 81% | Below target |
| Number of patients with a length of stay in the ED greater than 24 hours | 0 | Below target | |
Note: *As recommended by the Australasian Triage Scale.
Source: VAGO, based on the Victorian Health Services Performance Monitoring Framework 2022-23.
Performance is declining over time
Victorian health services have immediately seen all triage category 1 emergency patients with life threatening conditions and met the target for this performance measure. However, their performance against other key measures for timely access to emergency healthcare has declined from 2013–14 to 2022–23.
Figure 2 shows that the percentage of patients transferred from an ambulance into the ED within 40 minutes remained below target but stable at around 86 per cent from 2014–15 to 2016–17. However, it began to gradually decline until 2020, when the coronavirus diseases (COVID-19) began to spread in Victoria. There is a sharper decline in performance against this measure from 2020–21 onwards.
There was a similar trend for the number of patients seen within clinically recommended timeframes. Performance against this measure gradually declined since 2014–15 and was at its worst in 2020–21, following the onset of the COVID-19 pandemic. There is an improvement in performance in 2022–23, but it is too early to tell if this reflects a sustained performance improvement.
The percentage of patients staying in the ED for less than 4 hours was relatively stable at around 70 per cent from 2013–14 to 2017–18, but since then there has been a gradual decline.
The performance data we used to undertake our assessment is based on yearly time series for 2013–14 to 2022–23.
The performance data for the first 3 quarters of 2023–24 is also available (see Appendix D). While the data potentially shows some signs of improvement it is incomplete and does not account for seasonal variation. Therefore, it is not included in our assessment to compare to previous years and cannot be reflected in our findings.
Figure 2: Health services' performance against key measures for timely access to emergency healthcare over 2013–14 to 2022–23
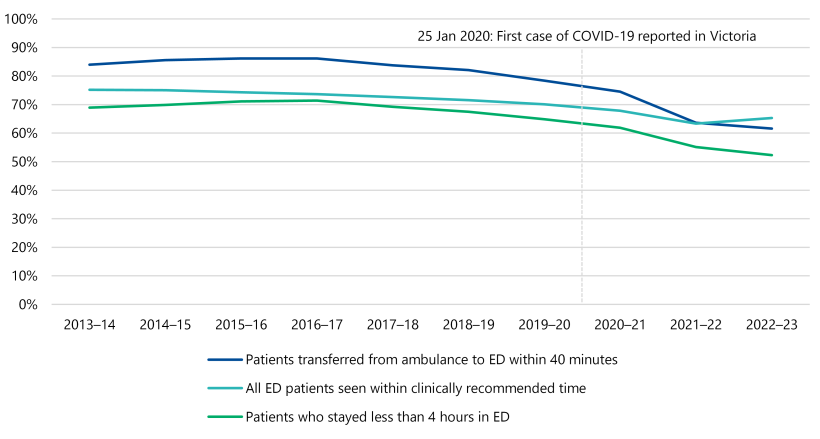
Source: VAGO, based on Victorian Emergency Minimum Dataset (VEMD) data.
Key finding 2: DH, AV and audited health services understand the key drivers of demand and barriers to timely access to emergency healthcare, and the initiatives we examined address some of these factors
Factors impacting timely access to emergency healthcare
DH, Ambulance Victoria and the audited health services understand and largely agree on the drivers of demand and barriers to patient flow impacting timely access to emergency healthcare.
The primary drivers of demand include the growing and ageing population, and an increase in the number of patients experiencing more severe health conditions. The limited capacity of health services to transfer and discharge patients through the health system in a timely manner is a key barrier to patient flow.
Patient flow in the ED
Patient flow through the emergency healthcare system refers to the movement of patients through emergency healthcare settings and encompasses the entire patient journey from arrival until the patient leaves the ED.
Effective patient flow is essential for timely, high-quality emergency healthcare, and inefficiencies can cause disruptions within the emergency healthcare system.
DH's initiatives
DH has implemented several initiatives to address the system-wide barriers that impact patient flow and timely access to emergency healthcare. In consultation with DH, we selected a sample of 8 initiatives to determine if they:
- address the key factors impacting timely access to emergency healthcare
- contribute towards improving health services' overall performance against key measures for timely access to emergency healthcare.
DH monitors the performance of these initiatives against their intended program objectives. Seven of these initiatives aim to connect patients to out-of-hospital care, where appropriate. The Timely Emergency Care Collaborative is the only initiative we examined with the primary objective to provide more timely emergency healthcare to Victorians by improving system-wide patient flow. Audited health services have also implemented several initiatives to address factors impacting ED patient flow within hospitals. But it is not clear whether and to what extent they are improving timely access to emergency healthcare.
Addressing factors impacting timely access to emergency healthcare
DH's monitoring data reveals that because of these initiatives, some potential ED presentations were directed to appropriate out-of-hospital care settings. This potentially increases the availability of ED resources to attend to high-acuity presentations. It also enables patients with low-acuity conditions to access timely medical care outside of the ED, which can prevent their condition from further deteriorating.
The 8 initiatives we examined address the drivers of demand related to:
- patients with low-acuity conditions
- patients with lasting impact of COVID-19
- patients with socioeconomic disadvantage
- limited access to GPs
- seasonal demand
- some workforce barriers.
Impact on performance against key measures
The 8 initiatives we examined are part of a broader range of programs in place with varying objectives. The performance data related to timely access to emergency healthcare from 2013–14 to 2022–23 does not show significant improvement.
Performance evaluation data is not available for 2 of the 8 initiatives we examined. The initiatives that DH has evaluated appear to be achieving their specific program objectives. However, we note most initiatives we examined are relatively recent and many factors may contribute to the health services' ability to meet performance targets.
Key finding 3: DH is improving data collection and monitoring of health services. However, public reporting of health services' performance against key measures does not provide insights into long-term trends
Improvements to data collection and performance monitoring
DH is improving its ability to capture real-time adverse event data from all public health services. This data is now used as part of its early warning system to proactively identify and monitor patient safety risks.
DH has also been working with a selection of health services to improve the data it has and to better use data insights to make improvements. For example, DH's Timely Emergency Care Collaborative has included development of a dashboard to monitor post-ED patient metrics. DH advised us this will be expanded to all hospitals with an ED.
Publicly reporting on access to emergency healthcare
Access to long-term performance data is important for the public because it provides transparency and accountability in the delivery of public health services.
DH publishes performance data for Victorian health services and hospitals through the Victorian Agency for Health Information. This data only displays performance over the most recent 15 months for individual hospitals. The short-term results do not show trends over time or insights on how events such as the COVID-19 pandemic have impacted health services’ delivery of emergency healthcare.
DH advised us that it plans to publish time series data for all Victorian health services' performance indicators on the Victorian Agency for Health Information website. This will be published by the end of the 2024, including 25 quarters of data from 2018–19 to the first quarter of 2024–25. Each new time series will be anchored at 2018–19, providing an increasing time series as new data is released.
Interstate comparison
Public health authorities in New South Wales and Queensland publicly report comparable performance data on timely access to emergency healthcare for a significantly longer period than Victoria. The published data on ED presentations in New South Wales dates to January 2010 while Queensland publishes 10 quarters of historical ED data.
Performance data presented in the Budget papers
DH provides an overview of the health services' performance to Parliament through the Budget Paper No. 3 Service Delivery (BP3). The reported information includes results for the previous financial year and expected results for the current one.
The BP3 includes results of 4 of the 5 key performance measures for timely access to emergency healthcare. The performance measure for the number of patients with a length of stay in the ED greater than 24 hours is not a BP3 measure and is therefore not reported.
The BP3 target for the percentage of emergency patients with a length of stay in the ED of less than 4 hours is 75 per cent, instead of 81 per cent as per health services' statements of priorities. Results for this performance measure for the last decade are consistently below 75 per cent.
1. Access to emergency healthcare
DH has several key performance measures for timely access to emergency healthcare. One of these is that health services immediately see all triage category 1 patients (with immediately life threatening conditions). From 2013–14 to 2022–23, Victorian health services met this target. However, they did not meet the targets for the following performance measures:
- patients transferred from ambulance to the ED within 40 minutes
- patients treated within clinically recommended time
- length of stay in the ED.
In addition, there are some differences in access to timely emergency healthcare for different patient groups.
Emergency healthcare in Victoria
Health Services Act 1988
One of the objectives of the Health Services Act 1988 is that all Victorians have access to an adequate range of essential health services regardless of where they live or their social or economic status. This includes access to timely emergency healthcare.
Victorian Health Services Performance Monitoring Framework
The Victorian Health Services Performance Monitoring Framework 2022-23 (the Framework) articulates the government’s performance monitoring of public health services and hospitals. It describes the contextual, strategic and operational aspects of monitoring and improving health services’ performance.
The Framework also describes the various roles DH, Safer Care Victoria and the Victorian Agency for Health Information have in building, designing and monitoring best-practice indicators to assist with the implementation of health services’ performance strategies.
Roles and responsibilities
DH, Ambulance Victoria and health services share individual and collective responsibilities in delivering timely and equitable emergency healthcare services. Figure 3 outlines these responsibilities.
Figure 3: Roles and responsibilities of key agencies in delivering emergency healthcare services
| DH | Ambulance Victoria | Individual health services | |
|---|---|---|---|
| Entity type | Government department | Independent legal entities | |
Role
|
|
|
|
| Responsibilities under the Framework | System manager | Service providers | |
|
| ||
Source: VAGO, based on the Framework.
Targets for key performance measures
Each year, DH sets performance measures for timely access to emergency healthcare in its statements of priorities with health services and Ambulance Victoria. We assessed the health services' performance for the key measures in Figure 4.
Figure 4: DH performance measures (with targets) that we assessed
| Key performance measure | DH target | ||
|---|---|---|---|
| 1 | Time for transfer on arrival: ambulance to the ED | % of patients transferred from ambulance to the ED within 40 minutes | 90% |
| 2 | Time to treatment | % of (all) triage category 1 to 5 emergency patients (collectively) seen within clinically recommended time* | 80% |
| % of triage category 1 emergency patients (with life threatening conditions) seen immediately | 100% | ||
| 3 | Length of stay in the ED | % of emergency patients with a length of stay in the ED of less than 4 hours | 81% |
| Number of patients with a length of stay in the ED greater than 24 hours | 0 | ||
Note: *As recommended by the Australasian Triage Scale.
Source: VAGO, based on the Framework.
Measure 1: Transferring patients from ambulance on arrival to the ED within 40 minutes
Risks associated with delayed transfers
It is important patients are transferred from ambulance on arrival to the ED in a timely manner to not delay medical assessment and ensure ambulances are available to respond to other emergencies.
The 90 per cent target and actual performance
In 2011, DH introduced a new performance target for health services to transfer at least 90 per cent of patients from ambulances into the ED within 40 minutes.
However, in the decade 2013–14 to 2022–23, health services did not meet this target.
Figure 5 illustrates this, showing that performance remained below target but stable at around 86 per cent from 2014–15 to 2016–17, but gradually declined until 2020, when COVID-19 started spreading in Victoria. There is a sharper decline in performance against this measure from 2021–22 onwards.
Figure 5: Percentage of patients transferred from ambulance to the ED within 40 minutes for 2013–14 to 2022–23
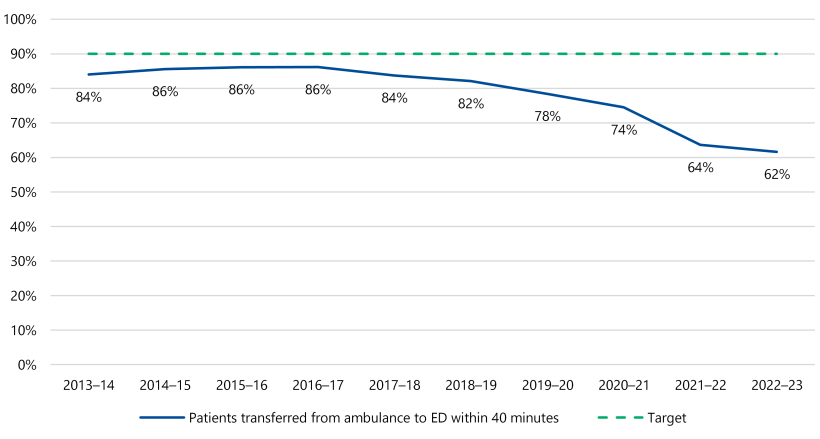
Note: VAGO reviewed VEMD data from 1 July 2014 to 30 June 2023. For 2013–14, we used data from DH’s 2013–14 annual report because VEMD did not collect this data until 2014–15 onwards.
Source: VAGO, based on VEMD and DH's 2013–14 annual report.
Measure 2: Seeing emergency patients within clinically recommended times
The ED triage system
Hospitals use a triage system to guide decisions about which patients they should see first. This is according to how sick they are rather than when they present. A triage assessment should take no more than 2 to 5 minutes and be carried out by an appropriately trained staff member.
On arrival at the ED, a specialist emergency nurse, called a triage nurse, assesses all patients. Using an established urgency scale, the triage nurse categorises the patient. This dictates how quickly the patient needs treatment.
Australasian Triage Scale
All Victorian EDs use the Australasian Triage Scale to ensure patients are treated in order of clinical urgency and allocated to the most appropriate assessment and treatment area.
The Australasian Triage Scale has 5 categories with corresponding maximum wait times for medical assessment and treatment, as shown in Figure 6.
Figure 6: The 5 Australasian Triage Scale categories
| Triage category | Patient description | Response |
|---|---|---|
| Category 1 | Immediately life threatening and requiring immediate aggressive intervention | 0 minutes (immediate assessment and treatment) |
| Category 2 | Imminently life threatening, important or time-critical, or very severe pain (for example, airway risk or severe respiratory distress, acute stroke, very severe pain) | Within 10 minutes – assessment and treatment (often simultaneous) |
| Category 3 | Potentially life-threatening conditions, or situational urgency requires time-critical treatment or humane practice mandates relief of severe discomfort or distress (for example, persistent vomiting or moderately severe blood loss) | Within 30 minutes – assessment and treatment to start |
| Category 4 | Potentially serious conditions, or situational urgency requires time critical treatment or involves significant complexity or severity (for example, mild haemorrhage, difficulty swallowing, sprained ankle, and semi-urgent mental health problems) | Within 60 minutes – assessment and treatment to start |
| Category 5 | Less urgent or clinic-administrative problems, such as results review, medical certificates or prescriptions only | Within 120 minutes – assessment and treatment to start |
Source: DH and the Australasian College for Emergency Medicine.
DH’s targets
In 2011, DH set health services the following performance targets based on the triage categories:
- percentage of triage category 1 emergency patient seen immediately: 100 per cent
- percentage of triage category 1 to 5 emergency patients seen within clinically recommended time: 80 per cent (note this is a combined measure for all category 1 to 5 patients).
Actual performance: category 1 patients
From 2013–14 to 2022–23, health services consistently provided immediate treatment to all the patients in triage category 1 with conditions that are an immediate threat to life (or at imminent risk of deterioration).
This performance meets DH’s 100 per cent target.
Actual performance: all category 1 to 5 patients
During the same 10-year period, aggregate data across all health services shows they did not meet the performance target of seeing at least 80 per cent of triage category 1 to 5 patients within the clinically recommended times.
Figure 7 shows that the performance against this target has been gradually declining since 2014–15 and was at its worst in 2021–22, following the onset of the COVID-19 pandemic. There is an improvement in performance since 2022–23, but it is too early to tell if this reflects a sustained performance improvement.
Figure 7: Percentage of all emergency patients (triage Category 1 to 5) treated within clinically recommended timeframes
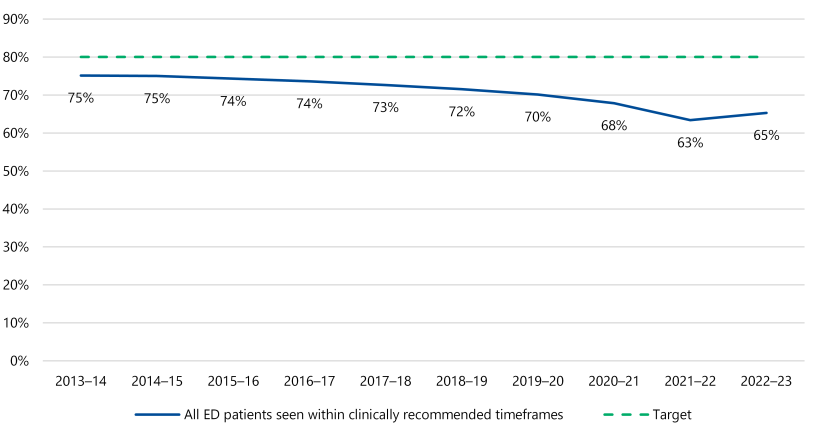
Source: VAGO, based on VEMD.
Actual performance: time for assessment and treatment by category
While triage category 1 patients are those with the most urgent medical needs, triage category 2 and 3 patients also have imminent or potentially serious conditions.
DH has advised us that it tracks performance against each triage category. However, it does not have individual targets for health services with respect to triage categories 2, 3, 4 and 5. The Australasian College for Emergency Medicine’s Policy on the Australasian Triage Scale outlines different performance indicator thresholds (the percentage of patients who commence assessment and treatment within the relevant waiting time from their time of arrival) for each triage category 1 to 5 of 100 per cent, 80 per cent, 75 per cent, 70 per cent and 70 per cent, respectively.
Performance against the Australasian College for Emergency Medicine's threshold scale indicates that triage category 2 and 3 patients have had the most significant drop in performance overall, while all performance threshold targets except category 3 were met in 2013–14.
We have not assessed patient outcomes, clinical decision-making or anything else with respect to this performance. As shown in Figure 13 in Section 2, from 2013–14 to 2022–23 the proportion of patients in triage category 2 and 3 has grown, while the proportion of patients in triage categories 4 and 5 has decreased. This increased demand in category 2 and 3 patients may be contributing to the declining performance for these patients.
Figure 8 shows the percentage of patients seen within clinically recommended timeframes by triage category over the 10 years between 2013–14 to 2022–23.
Figure 8: Percentage of patients seen within recommended timeframes by triage category (2013–14 to 2022–23)
| Category and recommended response time to assess/commence treatment | Category 1 (Immediate) | Category 2 (10 mins) | Category 3 (30 min) | Category 4 (60 min) | Category 5 (120 min) |
|---|---|---|---|---|---|
| 2013–14 | 100% | 84% | 73% | 71% | 89% |
| 2014–15 | 100% | 80% | 73% | 73% | 89% |
| 2015–16 | 100% | 78% | 71% | 73% | 89% |
| 2016–17 | 100% | 77% | 70% | 73% | 89% |
| 2017–18 | 100% | 76% | 68% | 72% | 89% |
| 2018–19 | 100% | 75% | 66% | 72% | 89% |
| 2019–20 | 100% | 67% | 65% | 72% | 90% |
| 2020–21 | 100% | 62% | 63% | 71% | 90% |
| 2021–22 | 100% | 55% | 58% | 69% | 89% |
| 2022–23 | 100% | 57% | 62% | 69% | 88% |
Source: VAGO, based on VEMD.
Measure 3: Length of stay in the ED
Length of stay in ED
Length of stay is an important performance measure for EDs, particularly as longer stays can tie up resources, including beds, medical equipment and staff that could be used to treat incoming patients. Length of stay is also very important to the quality of care and longer stays can delay transfer to other healthcare settings.
DH’s target
In 2011, DH introduced the following new performance measures for health services regarding length of stay in the ED:
- at least 81 per cent of all emergency patients stay in the ED for less than 4 hours
- no patients stay in the ED for longer than 24 hours.
Actual performance: less than 4-hour length of stay
From 2013–14 to 2022–23, health services did not meet the 81 per cent target for this measure.
Figure 9 shows the percentage of patients staying in the ED for less than 4 hours was relatively stable at around 70 per cent from 2013–14 to 2017–18, but since then there has been a gradual decline. The performance data reported for the first 3 quarters of 2023–24 shows slight improvement but remains under target (see Appendix D).
In 2022–23, almost half of all emergency patients (48 per cent) remained in ED for more than 4 hours. This was between 29 and 31 per cent from 2013–14 to 2017–18.
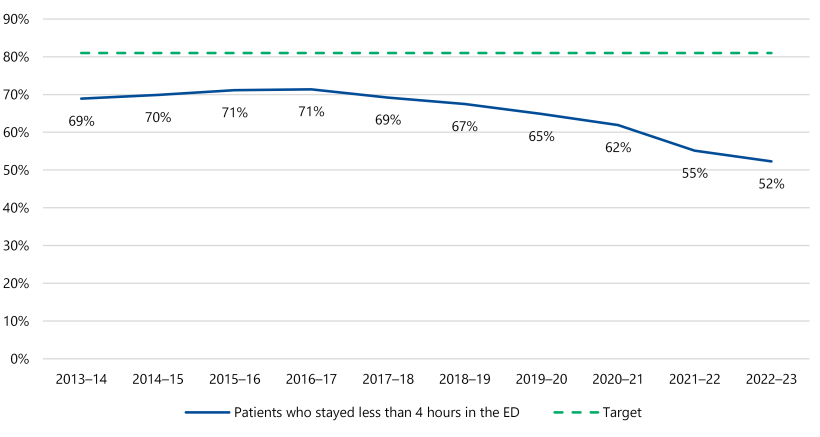
Figure 9: Percentage of emergency patients staying in ED for less than 4 hours (2013–14 to 2022–23)
Source: VAGO, based on VEMD.
Actual performance: less than 24-hour length of stay
Collectively, health services have also consistently missed the target of having no patient stay in the ED for longer than 24 hours. As Figure 10 shows, from 2013–14 to 2022–23, there has been a significant increase in the number of patients exceeding a 24-hour stay, with a substantial increase between 2020–21 and 2021–22 of 177 per cent and another substantial increase between 2021–22 to 2022–23 of 304 per cent.
Health services identified the following 2 key factors for this. However, we could not verify them as part of this audit:
- the number of available hospital beds (bed capacity)
- whole-of-hospital difficulties with patient flow, such as access block where patients who need admission to hospital are delayed from leaving the ED due to a lack of ward beds.
Figure 10: Number of patients staying in ED for longer than 24 hours (2013–14 to 2022–23)
| Year | No. of patients who stayed in ED longer than 24 hours per 100,000 population | Increase on prior year | Increase on year 1 (2013–14) |
|---|---|---|---|
| 2013–14 | 518 | N/A | N/A |
| 2014–15 | 534 | 3% | 3% |
| 2015–16 | 252 | –53% | –51% |
| 2016–17 | 368 | 46% | –29% |
| 2017–18 | 292 | –21% | –44% |
| 2018–19 | 721 | 147% | 39% |
| 2019–20 | 972 | 35% | 88% |
| 2020–21 | 1,017 | 5% | 96% |
| 2021–22 | 2,815 | 177% | 443% |
| 2022–23 | 11,363 | 304% | 2,094% |
Source: VAGO, based on VEMD.
Targeted actions to address high number of patients staying in EDs longer than 24 hours
DH is aware of the high number of patients staying in EDs longer than 24 hours. It has taken action to understand the causes of extended length of stays and barriers to improvement.
It has consulted health services with both high and low numbers of ED breaches and identified targeted actions for improvement, including:
- strengthening leadership and culture of zero tolerance to 24-hour ED breaches, with a focus on quality and safety implications for patients
- reviewing or developing new escalation processes, protocols and guidelines, with an emphasis on outlining precise actions across all teams in a hospital
- developing relationships with community-based services to enhance the ability to discharge patients earlier and reduce bed access block
- where possible, redirecting appropriate patients to alternative services and at-home care
- increasing the availability of senior decision-makers across the patient pathway to reduce delayed transfer of care.
DH is managing health services that show sustained rates of 24-hour breaches. This includes a targeted follow-up with health services who have reported the highest numbers of 24-hour breaches relative to total presentations each fortnight. DH is seeking to understand:
- patient impacts
- reasons for the breach
- steps being taken to minimise further breaches occurring due to similar reasons.
DH undertakes monthly engagement with these health services to understand progress on implementing the targeted actions, delivering quarterly best practice workshops to promote collaboration and cross-service learning between low and high-breach sites. DH advises that it has an increased focus on this issue at performance meetings. It is too early to tell if these actions are having any impact on reducing the number of 24-hour breaches.
Access to emergency healthcare for specific population groups
Comparing equitable access to emergency healthcare
Comparing the experience of patients across various population groups provides insights into whether they have the same timely access to emergency healthcare. Healthcare providers need this data to identify any disparities and areas for improvement so they can implement targeted interventions.
We assessed whether there was any statistically significant difference in outcomes for 5 population groups:
- patients who prefer a language other than English
- Aboriginal and Torres Strait Islander patients (excludes patients for whom First Nations status was not stated)
- patients with a mental health indicator
- patients presenting in non-metro hospitals
- patients from lower socioeconomic postcodes (determined using Australian Bureau of Statistics classifications).
What we examined
We analysed each of the 5 population groups against the same key performance measures:
- percentage of patients transferred from ambulance into the ED within 40 minutes
- percentage of triage category 1–5 patients (collectively) seen within clinically recommended times
- percentage of patients with a stay in the ED of less than 4 hours
- number of patients with a stay in the ED over 24 hours.
We analysed aggregated data for each population group for these measures over the 10-year period from 2013–14 to 2022–23.
As health services immediately attended to 100 per cent of triage category 1 patients, we did not assess this measure for the different cohorts.
Comparing metro and non metro performance
To improve health outcomes across all parts of the state during the COVID-19 pandemic, DH established Health Service Partnerships to promote collaboration between metro and regional services.
To compare access to emergency healthcare in metro and regional health services, we analysed performance data provided by the 3 metropolitan and 5 regional Health Service Partnerships.
Differences among some population groups
Our assessment of available data shows statistically significant differences in experiences for all population groups in accessing emergency healthcare services when compared to their counterparts over the period of 2013–14 to 2022–23.
We investigated whether the differences are driven by demographic differences between regions but could not find any evidence of this. While aggregate data is useful in conducting comparative analysis and identifying overall differences, it does not consider individual characteristics, such as patient and demographic factors.
Our analysis does not rule out the potential influence of other factors that may be driving the differences in the experience of these population groups. Since the population groups we assessed are not mutually exclusive, there may also be factors (for example, urgency of treatment, nature of the diagnosis or age) impacting patients across multiple population groups simultaneously.
Further investigation is required to identify and understand the factors that may be driving the differences in the experience of these population groups.
The result of our analysis is shown in Appendix E.
Statistically significant
An observation is statistically significant when the size of the effect is so large that it is unlikely to be explained by chance or random effects alone. A statistically significant effect that is also material may warrant further investigation to understand and address underlying causes.
2. Understanding and improving timely access to emergency healthcare
DH, AV and audited health services understand the demand drivers and barriers to timely access to emergency healthcare, and they have implemented various initiatives to address them. We examined 8 initiatives, and 6 of them have mostly achieved their specific goals, which are broader than improving timely access to emergency healthcare. Performance evaluation data for 2 of the 8 initiatives is not available.
However, health services' overall performance against key timeliness measures has not improved over the period we examined between 2013–14 to 2022–23.
Factors that affect timely access to emergency healthcare
Understanding the drivers of demand
Ambulance Victoria and the audited health services have a good understanding of the factors driving demand and barriers to patient flow in EDs. They identify population growth and the increased severity and complexity of patient conditions as primary drivers of demand for emergency healthcare services. Figure 11 shows the demand drivers and system constraints identified by Ambulance Victoria and the audited health services.
Figure 11: ED drivers of demand and barriers identified by Ambulance Victoria and health services
| Drivers of demand | Barriers |
|---|---|
| Ambulance Victoria | |
| Delays in patient handover from ambulance to hospitals (ramping most prevalent in growth corridors)
|
| Bendigo Health | |
|
|
| Werribee Mercy Hospital | |
| Current limited capacity of Werribee Mercy Hospital |
| The Royal Melbourne Hospital | |
|
|
Source: VAGO, based on information provided by DH and audited health services.
Impact of growing demand
The case study illustrates the impact of growing demand on hospitals' capacity to provide services and highlights the need for effective forward planning.
Case study: Growing demand in the Werribee Mercy Hospital catchment area
Context
DH and health services are responsible for developing service plans for new or expanded services for hospitals across the state. DH prioritises the development of service plans according to a needs assessment framework. This considers the needs of the hospital's location, including socioeconomic disadvantage, average travel time, GPs per capita, growth in required hospital beds and forecast bed deficit.
Increasing demand in the Werribee Mercy Hospital catchment area
Werribee Mercy Hospital is a general hospital that provides a broad range of comprehensive care in the south western region of Melbourne. The hospital opened in January 1994 and has since experienced increasing demand from the expanding population in Melbourne's fast-growing western suburbs.
In 2015, the government allocated $560 million to boost hospital capacity to support growing communities, particularly in metropolitan Melbourne. As a part of this capital investment, the government allocated $85 million for a new critical care unit at Werribee Mercy Hospital. According to the Werribee Mercy Hospital Service Plan Refresh 2021, the hospital’s emergency services will have an increased self-sufficiency of 54 per cent by 2036–37. The service plan states that Werribee Mercy Hospital is scheduled to get a new ED in late 2025.
Demand outstrips current ED capacity at Werribee Mercy Hospital
A May 2023 internal Werribee Mercy Hospital briefing noted that demand was outstripping ED capacity, resulting in ‘a poor perception of the ED in the community due to the negative experience of patients’.
A Werribee Mercy Hospital analysis found that from 2017–18 to 2021–22, around 8,500 patients from postcodes in the hospital’s catchment bypassed their local hospital to receive treatment at the Royal Children’s Hospital each year. This may have been necessary or by preference for some patients, although it indicates challenges meeting demand.
In 2016, Werribee Mercy Hospital’s service plan recommended a continuous focus on strategies to meet ongoing increases in demand arising from the population growth in its catchment area. However, a new ED for the hospital was not announced until 2022, with planned completion in late 2025.
Source: VAGO, based on Werribee Mercy Hospital.
Shared understanding of drivers and barriers
DH's understanding of drivers and barriers is largely consistent with that of Ambulance Victoria and the audited health services. This understanding is based on its consultation with health services and review of available emergency data and information.
DH uses this information when advising the government on issues and challenges facing Victoria’s health services.
Figure 12 summarises the factors identified by DH.
Figure 12: Drivers of demand and barriers to patient flow identified by DH as impacting timely access to emergency healthcare
| Factor | Drivers of demand | Barriers to patient flow in EDs |
|---|---|---|
Patient factors
|
|
|
Clinical factors
|
| |
Environmental factors
|
|
Source: VAGO, from DH’s April 2023 Timely Emergency Care Project report and DH’s budget submissions between 2019–20 and 2023–24.
Decreasing demand from patients with lower acuity conditions
Our analysis of available data shows a decline in the number of patients with lower-acuity conditions (typically triage categories 4 and 5).
Figure 13 shows that from 2013–14 to 2022–23, the overall number of patients in triage categories 4 and 5 decreased while the number of patients in triage categories 2 and 3 patients increased.
Figure 13: Number of patients by triage category from 2013–14 to 2022–23
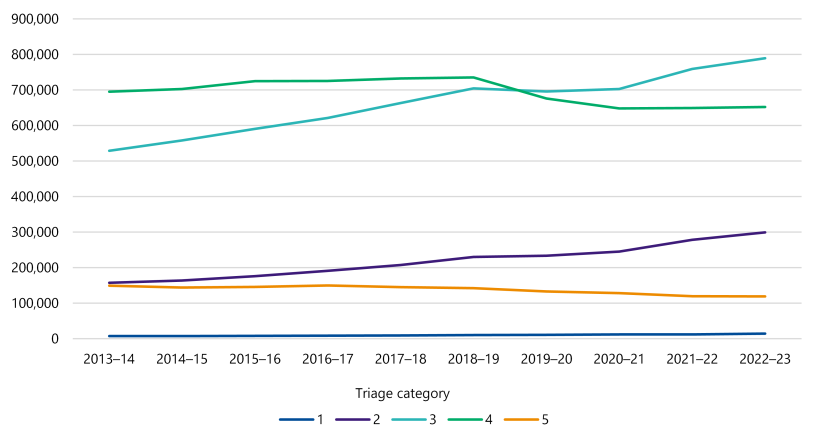
Source: VAGO, from DH data.
Funding timely access to emergency healthcare
Forecasting activity and demand
DH seeks operational funding for emergency health services in line with the government's annual Budget cycle. DH bases its Budget submissions for ED growth funding on a forecasting model that incorporates:
- changes in the number of patient presentations over several previous years
- trends in patient presentation
- changes in population, including ageing and patient utilisation
- feedback from health services on demand pressures, which is collected through its regular meetings with the health services throughout the year.
Calculating activity funding for existing services
The government funds health services based on the National Weighted Activity Unit model. Changes in patient complexity are built into the budget estimates when converting patient growth to funding growth.
Health services are funded on a total National Weighted Activity Unit target for admitted and non admitted (including emergency) services. This allows services greater flexibility in the way they allocate internal resources for managing and treating patients.
In addition, DH has a recall and throughput policy. This means health services are paid for activity levels above the set target. That is, when a health service delivers additional activity, it receives additional funding.
The National Weighted Activity Unit model
A National Weighted Activity Unit represents a measure of health service activity expressed as a common unit of resources. This provides a way of comparing and valuing each public hospital service (whether it is an ED presentation, admission or outpatient episode) by weighting it for clinical complexity.
Funding for service expansion
In recent years, growth funding for emergency healthcare has focused on planned service expansion.
The government considers funding requests for expanding and/or adding new services as part of its capital build program. In determining where to expand services, it considers a broad suite of variables as part of forecasting future demand for services and rates of growth. In 2021, DH identified 5 hospitals – Austin Hospital, Casey Hospital, Maroondah Hospital, Northern Hospital and Werribee Mercy Hospital – for priority expansion of their EDs.
Initiatives to improve timely access to emergency healthcare
DH investments
In the past few years, DH has made a series of investments that it advised are related to, or may contribute to, improved timely access to emergency healthcare. Figure 14 outlines some of these initiatives, noting it is not an exhaustive list of investments.
Figure 14: Budget initiatives aimed at improving timely access to emergency healthcare
| State Budget | Budgeted amount | Purpose |
|---|---|---|
| 2022–23 | $698 m | Better at Home package to deliver more hospital services within patients’ homes through home based and virtual care |
| 2023–24 | $41.9 m | Prevention and early intervention of chronic and preventable health conditions |
| $16.0 m | Supporting GPs | |
| $6.0 m | Supporting community sector jobs | |
| $73.9 m | Public Health Victoria | |
| $44.0 m | Victoria's pandemic program | |
| $15.5 m | Maternal and child health and early parenting services | |
| $117.4 m | System-wide improvements to support timely emergency care | |
| $9.1 m | For Pathways to home, supporting people well enough for discharge from hospital, including those with disability, into home-like settings equipped to meet their needs, making more hospital beds available | |
| $34.3 m | Better services for older people in aged care | |
| $162 m (over 4 years) | Better aged-care services for regional Victorians (asset initiative) |
Source: VAGO, based on DH information.
DH's initiatives to improve timely access to emergency healthcare
DH has implemented several initiatives to address the system-wide barriers that impact patient flow and timely access to emergency healthcare. In consultation with DH, we selected a sample of 8 initiatives to determine if they:
- address the key factors impacting timely access to emergency healthcare, as identified by DH
- contribute towards improving health services' overall performance against key measures for timely access to emergency healthcare.
DH monitors the performance of these initiatives against their intended program objectives, which can be broader than improving timely access to emergency healthcare. Seven of these initiatives are designed to connect patients to out-of-hospital care, where appropriate. Of the initiatives we examined, the Timely Emergency Care Collaborative is the only initiative with the primary objective to provide more timely emergency healthcare to Victorians by improving system-wide patient flow.
These initiatives mostly target lower-acuity patients and not the identified demand driver of an increasing number of high-acuity presentations in ED over the period of 2013–14 to 2022–23. However, any efforts to reduce demand (including from lower-acuity patients) is positive and may free up resources to focus on higher acuity patients for whom ED is the most appropriate care setting.
Figure 15 shows DH's reported outcomes for these initiatives.
Figure 15: Summary of DH's 8 initiatives in scope – purpose and outcomes
| Initiative and start year objective | Reported outcome relative to objective* | Evaluation done/planned? |
|---|---|---|
Nurse on Call (2006) A 24/7 statewide phoneline connecting callers with a registered nurse who can provide health advice | ||
Objective: To reduce demand on hospitals by diverting cases where acute care is not needed | Outcome: In 2022, 50.9% of callers intending to go to ED were diverted to an out-of-hospital care setting. | Yes (2021)
|
Supercare Pharmacies (2016) Includes 20 pharmacies providing access to after-hours nursing services that can treat minor injuries | ||
Objective: To reduce preventable ED attendances for minor injuries and illnesses after hours | Outcome: In a survey of over 78,000 Supercare Pharmacy consumers, over 30% of respondents reported that they would have gone to a local hospital if the Supercare Pharmacy was not available. | Yes (2020)
|
Victorian Virtual Emergency Department (2020) (Pilot) A 24/7 statewide video call service connecting callers with an emergency doctor who can provide health advice and prescriptions | ||
Objective: To reduce unnecessary ambulance transports and ED attendances | Outcome: 84.4% of Victorian Virtual Emergency Department presentations were not referred to the ED from October 2020 to April 2024. | Yes (2023)
|
Priority Primary Care Centres (2022) A GP-led model able to treat minor injuries and fractures | ||
Objective: To provide an alternative to EDs where treatment can be provided in a primary care setting | Outcome: Based on survey of users (6.5% survey response), 44,730 patients were diverted from going to the ED. | Yes, (planned late 2023)
|
GP respiratory clinics (2021) A GP-led model that offered comprehensive respiratory assessments and advice on ongoing treatment | ||
Objective: To provide an alternative to the ED for adults and children with mild respiratory symptoms | Outcome: No evaluation to date | No
|
Ambulance Victoria secondary triage (2003) A secondary triage service operated by paramedics and nurses connecting patients with appropriate care in the community when an emergency response is not needed | ||
Objective: To avoid unnecessary ambulance call-outs and ED transports | Outcome: At least 17.5% of 000 calls avoided emergency dispatch since 2019–20. | Yes (2023)
|
Ambulance Victoria Medium Acuity Patient Transport Services (2021)
| ||
Objective: To improve code 1 response times for Ambulance General Platform resources by attending codes 2 and 3 cases | Outcome: The end of the trial was associated with a reduction of 9.2% in codes 2 and 3 cases attended by an Ambulance General Platform resource. | Yes (2022)
|
Timely Emergency Care Collaborative (2022)
| ||
Objective: To provide more timely emergency care to Victorians by improving system-wide patient flow | Outcome: Current progress data shows positive impact across multiple sites and metrics. | Due for completion in May 2024
|
Note: *The reported outcomes for these initiatives are based on DH's evaluations and reporting.
Source: VAGO, based on information provided by DH.
Initiatives implemented by health services
Health services have also implemented specific initiatives to address ED patient flow issues in hospitals. These initiatives aim to match hospital capacity with demand and are ordinarily aimed at improving patient flow within a service or hospital.
Figure 16 outlines some of these initiatives implemented in 3 of the audited health services.
Figure 16: Whole-of-hospital patient-flow initiatives implemented by some health services
| Initiative | Bendigo Hospital | The Royal Melbourne Hospital | Werribee Mercy Hospital |
|---|---|---|---|
| Real-time data dashboards | Yes | Yes | Yes (except for data outside of ED) |
| Discharge lounges | Yes | Yes | No |
| Huddles* | Yes | Yes | Yes |
| Patient flow coordinator | Yes | Yes | Yes |
| Early assessment/doctor at triage | Yes (when capacity allows) | Yes | Yes |
| Waiting room nursing staff | Yes | Yes | Yes |
Note: *Huddles are brief, focused and structured stand-up meetings among senior and clinical staff to exchange information about potential or existing safety risks that may affect patients and/or staff.
Source: VAGO, from health services’ documentation.
Gaps in addressing drivers and barriers
DH has implemented a range of initiatives with varying objectives and committed to investing in improving timely access to emergency healthcare. There are gaps to address around critical drivers of demand and barriers to patient flow.
The initiatives we assessed primarily aim to reduce demand from patients with low-acuity conditions, freeing up ED resources to respond to patients with more serious conditions and/or needing urgent care. However, given the increasing proportion of higher-acuity presentations (triage category 2 and 3, shown in Figure 13), demand will likely continue to put significant pressure on our state’s EDs, and therefore on the broader hospital system. From 2013–14 to 2022–23, the increase in demand for emergency healthcare has mostly been driven by patients who require urgent or immediate healthcare and cannot be diverted to other care systems. But reducing demand from lower-acuity patients frees up resources to deal with the higher-acuity patients.
Figure 17 outlines whether the initiatives we examined directly address drivers of demand and barriers to patient flow. We note that these initiatives have their own specific program objectives that may not be intended to directly address factors impacting timely emergency healthcare.
Figure 17: Assessment of 8 in-scope initiatives against drivers and barriers to timely emergency healthcare
| Drivers/barriers identified by DH | Addressed by the initiatives |
|---|---|
| Patient drivers | |
| Growing and ageing population | Not addressed directly |
| Improved health literacy/expectations | Not addressed directly |
| Low health literacy | Not addressed directly |
| Patient choice for public healthcare | Not addressed directly |
| Clinical drivers | |
| Mental health, alcohol and drugs | Not addressed directly |
| Low-acuity conditions | Directly addressed by Nurse on Call, Supercare Pharmacies, Priority Primary Care Centres and GP respiratory clinics |
| Chronic and complex conditions | Not addressed directly |
| Lasting COVID-19 impact | Directly addressed by GP respiratory clinics |
| GP skills/confidence | Not addressed directly |
| Environmental drivers | |
| Limited access to GPs | Directly addressed by Nurse on Call, Supercare Pharmacies, Priority Primary Care Centres and GP respiratory clinics |
| Socioeconomic disadvantage | Directly addressed by Nurse on Call, Supercare Pharmacies, Priority Primary Care Centres and GP respiratory clinics |
| Seasonal demand (for example, heatwaves, winter) | Directly addressed by GP respiratory clinics |
| Barriers | |
| Workforce | Directly addressed by Ambulance Victoria Medium Acuity Patient Transport Services |
| Inadequate planning and system linkages | Not addressed directly |
| Infrastructure constraints | Not addressed directly |
| Focus on service quantity over quality | Not addressed directly |
| ED and hospital capacity, including to respond to unexpected events | Not addressed directly |
Source: VAGO, from DH's documentation.
Impact on performance against key measures
The 8 initiatives we assessed are part of a broader range of programs in place to address system wide issues, including timely access to emergency healthcare.
Despite the broader program of work in place, the performance data related to timely access to emergency healthcare does not show significant improvement in the period we examined between 2013–14 and 2022–23. We note that most of these initiatives are recent and many factors may contribute to the health services' ability to meet performance targets.
Workforce planning
Victorian Health Workforce Strategy
DH’s 2023–24 Budget submission notes that Victoria lacks timely, detailed and quality data on the public health sector workforce, including in emergency healthcare. This limits DH's ability to guide health services on current and emerging workforce issues and ensure workforce availability across the system.
In February 2024, DH launched its new workforce strategy, setting out a plan to bolster Victoria’s workforce capacity and capability for the next 10 years. We have not assessed DH's new workforce strategy as part of this audit.
Health service workforce plans
The Royal Melbourne Hospital and Werribee Mercy Hospital advised that they are currently developing workforce plans. Werribee Mercy Hospital advised us a focus of this work will be addressing sub speciality workforce gaps.
Bendigo Hospital advised that its workforce plan is out of date and it is currently developing a new workforce plan in consultation with external advisors.
Ambulance Victoria has a draft workforce plan, but it is yet to be approved. The draft plan focuses on attracting and retaining staff, particularly in rural and remote locations.
3. Performance monitoring and reporting
DH’s regular performance monitoring enables the collection of important data from health services and Ambulance Victoria on their short-term performance. Longer-term performance data is also important for the public because it provides greater insights into trends over time and improves the accountability and transparency of public health services.
DH is improving its ability to monitor patient safety trends and is working with health services to capture real-time hospital data, and to better use data insights to make improvements at health services.
Monitoring patient safety trends
Safer Care Victoria and adverse events
Safer Care Victoria is an administrative office of DH, and is a quality and safety body. As a part of its function, Safer Care Victoria responds to safety risks and issues and identifies areas for improvement.
Safer Care Victoria is the accountable agency for the Adverse Patient Safety Event policy, including oversight of the Sentinel Event Program. It collects and collates information thematically as part of the Sentinel Event Program. This process is partly automated, but is predominantly a manual process.
Where relevant, Safer Care Victoria shares individual events with DH, particularly where this event is considered high risk.
Adverse patient safety event
An adverse patient safety event is an incident that results, or could have resulted, in harm to a patient or consumer. A near miss is a type of adverse event.
Sentinel event
A sentinel event is an unexpected and adverse incident that occurs infrequently in a health service entity and results in the death of, or serious physical or psychological harm to, a patient as a result of system and process deficiencies.
VHIMS data quality
In our 2021 audit Clinical Governance: Health Services, we found deficiencies in the quality and consistency of data in the Victorian Health Incident Management System (VHIMS). DH has not yet fully addressed these deficiencies.
DH advises that work is underway to improve the quality of data reported to VHIMS, which will enable it to identify potential or emerging patterns of risk to patient safety.
VHIMS
VHIMS is a standardised dataset for the collection and classification of clinical, occupational health and safety incidents, near misses and hazards. Incident information collected in VHIMS helps to drive local and statewide improvements in quality, safety and patient experience.
Improvements in performance data monitoring processes
Recent improvements to VHIMS: near real-time adverse event data
DH advises that since September 2023, it receives near-real-time adverse event data from all public health services via VHIMS. This data is now used in an early warning system report that enables Safer Care Victoria to proactively identify and monitor safety risks, which is an ongoing project.
This work is the result of:
- optimising the utility of VHIMS data, which also involves ongoing work to review and refine the VHIMS minimum dataset
- the VHIMS automation project, overseen by the VHIMS project board, which focused on enabling automated submission of incident records at creation from local health service incident management systems via the VHIMS interface.
DH advised us that all Victorian public health services are utilising the VHIMS interface to submit incident data in near real time since September 2023.
The VHIMS compliance reports, presented to the VHIMS project board, show an increase in the number of services submitting data and the total volume of records received and the reduction in average and median days from record creation to submission.
Under automation, the DH receives all records that public health services create in near real time.
Case study: The Timely Emergency Care Collaborative
DH is working to improve the way it uses data to identify and progress improvement opportunities in partnership with health services. One such initiative is the Timely Emergency Care Collaborative that involves 14 health services and Ambulance Victoria. Officially launched in December 2022, the primary focus of the Timely Emergency Care Collaborative is to identify and address systemic opportunities to improve access to emergency healthcare.
DH reports that health services participating in the Timely Emergency Care Collaborative have observed a reduction in ED length of stay for both admitted and non-admitted patients compared to non-participating health services. This assessment is based on a comparison of data from February 2023 to November 2023 with baseline performance from January 2022 to December 2022. DH's evaluation of the Timely Emergency Care Collaborative is due to complete in May 2024.
Through the Timely Emergency Care Collaborative dashboard, DH can actively monitor post ED patient flow metrics, including inpatient length of stay, percentage of discharges before 12 pm, and bed occupancy, across all participating health services and Ambulance Victoria. In 2024, these metrics will expand to all sites with an ED, supporting a data driven whole of hospital improvement focus on ED performance.
DH and health services uses these same measures to measure the impact of post-ED improvement initiatives.
Source: VAGO.
Initiatives by health services
All audited health services review individual adverse events at all levels of harm, including those related to delays accessing emergency healthcare.
For example, The Royal Melbourne Hospital conducted a review after detecting an increase in falls and pressure injuries in the ED. The review found that access block was a contributing factor to the falls and injuries.
While working on broader strategies to address access block, The Royal Melbourne Hospital put strategies in place to mitigate the risk of pressure injuries and falls in the ED, including:
- flagging and monitoring long-stay patients
- enacting preventative plans for long-stay patients.
Publishing ED performance data
Publishing long term performance data
Long-term performance data on timely access to emergency healthcare can provide important insights into performance over time and help to identify trends and patterns. This allows for investigation and action to be undertaken into any performance gaps, and also provides transparency and accountability of public health service performance.
DH publishes short-term data (via the Victorian Agency for Health Information website), showing performance results for timeliness of emergency healthcare for individual hospitals for the most recent 15 months.
While the performance data available to the public via the Victorian Agency for Health Information is accurate, it has its limitations. Since the data only shows performance over a short period of time, it does not provide a view of performance over time or insights to the public, such as long term performance trends and the impact of events like the COVID-19 pandemic on health services’ delivery of emergency healthcare.
Interstate comparison
In comparison to Victoria, New South Wales and Queensland publish long-term performance data for timely access to emergency healthcare. New South Wales provides data on ED presentations that dates to January 2010 while Queensland provides 10 quarters of historical ED data. The performance data published by New South Wales and Queensland is more informative than that from Victoria because it enables the public to see trends over a long period of time.
DH's future plans
DH advised us that it plans to publish time series data for all Victorian health services' performance indicators on the Victorian Agency for Health Information website. This will be published by the end of the 2024, including 25 quarters of data from 2018–19 to the first quarter of 2024–25. Each new time series will be anchored at 2018–19, providing an increasing time series as new data is released.
Reporting performance targets in the BP3
BP3 measures
DH reports on the performance of health services against 4 of the emergency healthcare timeliness measures we have assessed in the BP3. The performance measure for patients staying longer than 24 hours in the ED is not a BP3 measure. The information reported in the BP3 includes actual performance results for the previous financial year and expected results for the current financial year.
Reporting does not match timeliness target
Figure 18 shows that the BP3 target for patients staying less than 4 hours in ED is 75 per cent and not 81 per cent as per health services' statements of priorities. Regardless, the results for this performance measure from 2013–14 to 2022–23 remained below 75 per cent, ranging from 52 per cent to 71 per cent.
Figure 18: Comparison of measures in health services' statements of priorities and the BP3
| Measure in health services’ statements of priorities (examined in this audit) | Health services' statement of priorities target | Target published in the BP3 |
|---|---|---|
| % of patients transferred from ambulance to the ED within 40 minutes | 90% | 90% |
| % of (all) ED patients (collectively) seen within clinically recommended time* | 80% | 80% |
| % of triage category 1 patients (with immediately life-threatening conditions) seen immediately | 100% | 100% |
| % of emergency patients with a length of stay in the ED of less than 4 hours | 81% | 75% |
| Number of patients with a length of stay in the ED greater than 24 hours | 0 | N/A |
Source: VAGO, from health services’ statements of priorities and the BP3.
Appendix A: Submissions and comments
Download a PDF copy of Appendix A: Submissions and comments.

Appendix B: Abbreviations, acronyms and glossary
Download a PDF copy of Appendix B: Abbreviations, acronyms and glossary.
Appendix C: Audit scope and method
Download a PDF copy of Appendix C: Audit scope and method.
Appendix D: Performance data for 2023–24 (quarters 1 to 3)
Download a PDF copy of Appendix D: Performance data for 2023–24 (quarters 1 to 3).
Download Appendix D: Performance data for 2023–24 (quarters 1 to 3)
Appendix E: Experience of different population groups
Download a PDF copy of Appendix E: Experience of different population groups.
Download Appendix E: Experience of different population groups