Major Projects Performance Reporting 2024
Review snapshot
Do public entities publish information that can be used to assess their major projects' performance against expected cost, time, scope and benefits?
Why we did this review
Major projects are specialised and complex. Changes to a project's cost, time and scope can impact originally intended project benefits. Parliament and the community want transparent and useful information about changes to a major project's cost, time, scope and benefits.
This is our fourth assurance review focusing on accountability and transparency gaps. Our previous reviews found the public entities we examined do not consistently and transparently report on their major projects' performance.
What we concluded
The information public entities provide Parliament and the community is not meaningful. It does not allow the community to understand major projects' performance against expected cost, time, scope and benefits or the impact of any changes.
The public entities in scope do not consistently and transparently report major projects' performance information in a way that is useful to the Parliament or the general public. They partially report only some information in a meaningful way about their major projects' performance.
Entities and the Department of Treasury and Finance (DTF) have the information to address this. Internal analysis of project performance is often high quality and meaningful, but this is not typically publicly reported. They could use their internal analysis to significantly improve the quality of information available to the community about project performance, at an insignificant cost.
Entities also are not systematically assessing the impact of material changes to a project's originally approved parameters. Entities' project benefits measurement systems are often immature, with unclear roles and responsibilities. These weaknesses can be addressed through strengthened guidance for entities from DTF.
We made 6 recommendations to DTF and public entities to improve the transparency and meaningfulness of major projects performance reporting.
Key background information
Source: VAGO.
Case studies
We developed 8 major project case studies to give a more focused review to some selected projects. The 10 major projects we reviewed in our 8 case studies are high cost (over $250 million TEI) or have shown significant cost or time changes during their lifecycle.
The case studies are published separately and can be read independently of this report.
Data dashboard
1. Our key findings
What we examined
Our review followed one line of inquiry:
1. Are public entities transparently reporting the performance of their major projects against cost, time, scope and benefits?
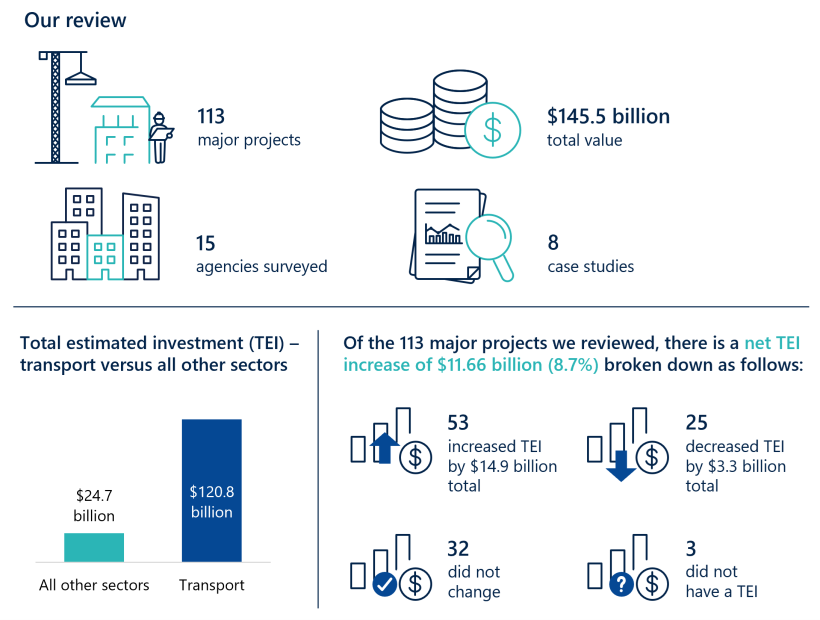
To answer this question, we surveyed 15 of the 19 entities in scope for this review and examined 113 selected major projects.
Appendix A lists agencies’ formal letters of response to this review along with their recommendation action plans. Appendix G contains the entity responses to our survey.
We did not survey the Department of Treasury and Finance (DTF) and the Department of Families, Fairness and Housing (DFFH) because they did not have any major projects during this Budget year. DTF is in scope for this review because it is the central entity responsible for major project budget management and other guidance. DFFH is in scope because it is responsible for Homes Victoria. Victorian Rail Track (VicTrack) is in scope because the Budget papers have allocated some major projects in the transport sector to this entity.
The public entities included in this review’s scope are:
- Court Services Victoria
- Department of Energy, Environment and Climate Action
- Department of Families, Fairness and Housing
- Department of Health
- Department of Jobs, Skills, Industry and Regions
- Department of Justice and Community Safety
- Department of Transport and Planning
- Department of Treasury and Finance
- Geelong Performing Arts Centre Trust
- Homes Victoria
- Kardinia Park Stadium Trust
- Melbourne Arts Precinct Corporation
- Melbourne Water Corporation
- North East Link State Tolling Corporation
- South East Water Corporation
- State Sport Centres Trust
- Suburban Rail Loop Authority
- Victorian Infrastructure Delivery Authority
- VicTrack.
Terms used in this report
Capital project
A capital project is a project that builds, improves or maintains assets or infrastructure. Capital projects usually have complexity challenges as well as a relatively large cost and scale.
High value high risk (HVHR) project
A project is HVHR if DTF assesses it as:
- high risk
- medium risk and it has a total estimated investment (TEI) between $100 million and $250 million
- low risk and it has a TEI over $250 million
- a project outside these parameters that warrants the extra rigour applied to HVHR projects.
Major project
A major project is a new, existing or completed capital project with a TEI worth $100 million or more.
Total estimated investment (TEI)
TEI is the project cost reported in Budget papers. This includes the base cost estimate, the base risk estimate (the expected cost of managing risks) and the excess risk estimate (an additional risk allocation above the base risk estimate).
Background information
Capital projects are a significant part of Victoria’s Budget
DTF reports on capital expenditure, including major projects, in Budget Paper 4: State Capital Program (BP4), which the Victorian Treasurer tables in Parliament on Budget day.
The 2024–25 BP4 reports that the Victorian public sector's new and existing capital investments are worth $208.48 billion. This is $7.85 billion more than the $200.63 billion committed in 2023–24.
Capital investments can include transport and water infrastructure, hospitals, schools, prisons and other community facilities. Capital expenditure grew by an average 13.25 per cent each year over the last decade.
The Victorian Government spends 19 per cent of its Budget on major projects and other capital investments, worth $101.49 billion a year over the Budget period and forward estimates to 2027–28. This spending is expected to reach $19.3 billion per year in the period to 2027–28.
There is a need for more meaningful project performance information
Major projects are complex and changes to them can significantly impact a project’s originally intended social and economic benefits.
Parliament and the community want meaningful information, in an accessible and useful format, about how effective public investment in major projects is and whether original project expectations are being met.
More meaningful project performance information would help Parliament and the community better understand project outcomes. It would allow Parliament to ask the government and responsible public entities about changes to any originally stated project goals.
To be meaningful and useful, project performance reporting and analysis should:
- be available to Parliament and the community in a format that clearly explains project progress and outcomes
- assess the current project status against the cost, time, scope and benefits that were initially defined and analyse underlying reasons for changes to expected project parameters
- measure and analyse progress towards achieving expected project benefits.
Our continued major projects assurance focus
Our previous 3 assurance reviews on this topic found the entities we examined did not consistently and transparently report on their major projects' performance.
In this review, we surveyed 15 of the 19 entities in scope and examined 113 major projects worth $100 million or more. Of these major projects, 3 did not have a confirmed TEI. The remaining 110 major projects in our selection are worth $145.5 billion and account for 70 per cent of value of all capital investments listed in the latest BP4.
See Appendix C for our review scope and method.
What we found
We made 4 key findings:
1. Public reporting about major projects is not meaningful, reliable or comprehensive.
2. Internal analysis of project performance is often high quality and meaningful, but it is not publicly reported.
3. Entities are not systematically assessing significant changes’ impact on a project's original cost, time, scope or benefits.
4. Entities' project benefits measurement systems are not mature, with unclear roles and responsibilities.
The analysis leading to these key findings is discussed in this section.
Key themes from the major project case studies are described in more detail in Section 3. Appendix D lists the case studies we selected to examine in more detail.
We explore the data from our surveys in more detail in Section 4.
Using this data we have updated our interactive major projects dashboard which is a companion product for this report. The updated dashboard can be found at https://www.audit.vic.gov.au/report/major-projects-performance-reporting-2024.
Our recommendations and entity responses are at the end of this section.
Consultation with entities
When reaching our conclusions, we consulted with the reviewed entities and considered their views.
Key finding 1: Public reporting about major projects is not meaningful, reliable or comprehensive
Entities are not clearly explaining project changes in Budget papers
Entities report in BP4 mainly what has changed in a project rather than why a change happened. BP4 footnotes do not always accurately and transparently report underlying factors that impact a major project’s performance.
BP4 footnotes are important because they provide an explanation to Parliament and the community about any changes to capital investments. BP4 footnotes increase transparency and provide further context and are a key accountability mechanism for entities to explain how they have used public taxpayer money in their major projects.
This means BP4, which is the main information source on major projects available to Parliament and the community, is not useful or reliable for assessing major project performance.
Useful public data on project performance is limited
All projects in our case studies had a TEI or date change. Eight projects did not disclose in their BP4 reporting the full reasons why they had a change.
This means public data does not give a full story about these projects' circumstances to Parliament and the community. This reporting gap could lead to misunderstandings about a major project’s management, progress and outcomes.
Some types of major projects, such as public–private partnerships (PPPs), give more meaningful information to Parliament and the community about their key attributes, contract mechanisms and how they can demonstrate value for money. The Treasurer requires that PPP projects publish useful and meaningful project summaries soon after a contract has been finalised with a successful private sector consortium.
Some projects use an alliance or lump sum procurement model and have similar or higher TEIs than some PPPs. But they do not provide any in-depth public reporting about the rationale for the project's design, structure and value for money considerations. This means Parliament and the community have different quality information available to them about important factors relevant to a major project’s establishment and performance.
Key issue: We identified similar gaps in previous reviews
Over the last 3 years, our major projects assurance reviews have identified similar issues around BP4 footnotes, project performance analysis, and expected project benefits measurement and assessment.
We made 9 detailed recommendations to address these deficiencies in our 3 previous reviews. Five have been accepted in principle, 3 have been accepted, and one has not been accepted. Some recommendations have been implemented, but some have not been actioned.
Addressing this finding
To address this finding, we made 2 recommendations to DTF and public entities about improving public reporting on major projects' performance.
Key finding 2: Internal analysis of project performance is often high quality and meaningful, but it is not publicly reported
DTF produces high-quality internal analysis and reporting on project performance
DTF’s project assurance advice and products for government and entities is high quality.
DTF provides comprehensive, confidential advice on major projects performance to ministers on a quarterly basis. This advice is not intended for the public and has limited distribution outside relevant ministers' offices, DTF and the Department of Premier and Cabinet (DPC).
The advice to ministers examines the cost, time, scope and risk factors that may be affecting major projects in detail. It also gives a joint DTF and DPC view about a project's progress using red, amber and green (RAG) ratings. The quarterly advice includes useful analysis of the state's exposure to certain contractors, construction market price escalation impacts and other systemic issues, such as supply chain challenges and industrial relations.
DTF also runs and oversights major project review and assurance processes such as the HVHR framework and the gateway review process (gateway).
These processes give useful and practical advice to senior project leaders at various steps in a project’s lifecycle.
Working well: DTF streamlined its quarterly data collection and reporting for major projects
DTF implemented a new online data management and analytics tool in 2024 to support its quarterly major projects report. DTF has been able to reduce its data collection to reporting timeframe within one month of the end of quarter.
Entities’ internal reporting is high quality, but it is not usually public
The available evidence for our 8 case studies gave us a meaningful understanding of these projects' performance.
But this information is not publicly available. Other types of public updates do not discuss known progress challenges or specifically focus on any government-approved changes to cost, time and scope.
This means that projects do not provide transparent reporting on performance to Parliament and the community. For reporting to be meaningful, we consider that project updates need to reflect Parliament's expectation that public projects, which use public funds, give more transparency and accountability back to the community who fund them.
Addressing this finding
To address this finding, we made one recommendation to DTF and relevant public entities about increasing transparency and providing useful project information.
Key finding 3: Entities are not systematically assessing the impact on a project's original cost, time, scope or benefits when there is a significant change
Some projects had TEI increases over time
Of the major projects we reviewed, 48.2 per cent (53 of 110) show TEI increases over time. There has been a $11.66 billion net overall TEI increase across the major projects in our selection since last year’s review.
Of the 10 projects reviewed in our 8 case studies, 5 have had a significant TEI change at some point in their lifecycle.
Significant TEI change
A TEI change is significant when there is a 20 per cent cost increase or decrease.
These TEI increases over time suggests that cost estimation is not always reliable at business case or investment decision stages. Entities' cost estimation and cost planning capabilities are also not adequately identifying construction market price volatility.
Rising market costs impacted some construction projects
Construction market price volatility has had a significant impact on some project budgets.
In some cases, the construction market has offered significantly higher prices than the TEI estimates announced to the public in early project stages.
Entities are not analysing changes to projects’ economic and other benefits
Entities do not specifically consider the impact of major changes to cost, time and scope on expected project benefits and economic viability.
We found no evidence that original forecast economic and other benefits are formally reassessed after significant project changes.
This means Parliament and the community have no way of knowing whether a project’s estimated economic benefit–cost ratio (BCR) or any other project benefits measurement tool used is still valid after a major change.
Benefit–cost ratio (BCR)
A BCR is an economic appraisal tool used to analyse and understand the relative value of expected cost inputs versus any social, economic and environmental benefits a project is expected to provide.
Procurement model changes impacted some project budgets and timelines
For some major projects, changes to an expected procurement approach happened after an initial funding decision.
This had some observable impacts on the project’s TEI and timelines.
To achieve better project outcomes, entities should explicitly consider doing their detailed analysis of project procurement approaches at the same time that they develop project investment cases and seek approval from government.
Working well: Value management approaches to mitigate scope and cost challenges
We saw some evidence of effective value management approaches. Our conversations with senior project stakeholders on a case study project demonstrated how they maintain a focus on delivering high-quality outcomes, even after market prices came in higher than expected.
Useful approaches included options such as staging of works, cold shell fit-outs (a functional build with basic finishes) and passive infrastructure provision for future but currently unfunded services and facilities. These approaches show how some entities are strategically planning to control cost and scope, as well as futureproof assets.
Some projects also used a longer-term approach to try and gain value from whole-of-life costing by using 'scope ladders', which are a series of iterative and cumulative scope options and choices. This helps the state better understand the opportunity cost of building in options during construction rather than trying to retrofit them to a facility in the future.
Addressing this finding
To address this finding, we made 2 recommendations to DTF about providing more guidance on tracking and acquitting benefits in major projects.
Key finding 4: Entities' benefits measurement systems are not mature, with unclear roles and responsibilities
Entities self-assessed their project benefits as on track, but we found some challenges
This year, our survey included a project benefits self-assessment and questions about measurement systems. Entities rated 96 projects (85 per cent) as green. This means entities believe they have well-developed project benefits measurement systems.
In our detailed review, we rated all 10 case study projects as amber for benefits. This is mainly due to incomplete baseline data or no evidence that established benefits measurement processes are in place.
We also saw some incomplete and outdated benefits plans, as well as some confusion about the different entities’ role in assessing and measuring benefits, especially longer-term benefits linked to a desired economic outcome.
Some project benefits have not been reassessed after significant changes
In our survey, entities recorded that 101 (89.38 per cent) projects had a process to recalculate changes to project benefits due to a significant scope change.
However, we observed through our case study reviews that some projects have had significant changes to scope, cost and time since they were first approved but entities have not reassessed the project's expected benefits’ timing or scale.
This means there is a risk the state could be proceeding with a project that is not providing the expected, and sometimes publicly announced, benefits in line with the scale and timing specified in the original investment decision. Some project assurance reviews (PARs) and gateway reports also identified this mismatch.
Addressing this finding
To address this finding, we made one recommendation to DTF about providing more guidance on tracking and acquitting benefits in major projects.
2. Our recommendations
We made 6 recommendations to address our 4 key findings. The relevant entities have accepted the recommendations in full or in principle. The Department of Health and the Department of Transport and Planning (DTP), also representing the Suburban Rail Loop Authority (SRLA) and the Victorian Infrastructure Delivery Authority (VIDA), do not agree that 2 recommendations are relevant to them and believe that DTF is the appropriate entity to action them.
| Entity response(s) | ||||
|---|---|---|---|---|
| Finding: Public reporting about major projects is not meaningful, reliable or comprehensive | ||||
Department of Treasury and Finance and entities we examined
| 1
| Develop more meaningful public reporting on major projects' performance by:
| The Department of Health and the Department of Transport and Planning (also representing the Suburban Rail Loop Authority and the Victorian Infrastructure Delivery Authority) do not accept that this recommendation is relevant to them. The Department of Treasury and Finance and all other entities we examined have either accepted in full or accepted in principle. | |
Department of Treasury and Finance
| 2
| Expand Budget Paper 4: State Capital Program’s scope and purpose, or develop a standalone annual major projects performance report and data dashboard for tabling in Parliament and public release, that includes:
| Accepted in principle
| |
| Finding: Internal analysis of project performance is often high quality and meaningful, but it is not publicly reported | ||||
Department of Treasury and Finance and entities with major projects worth $250 million or more
| 3
| Collect, synthesise and publish more detailed public information on higher cost ($250 million or more total estimated investment) alliance or lump sum contract projects, using the Department of Treasury and Finance's existing public–private partnership project summaries as a content guide.
| The Department of Health and the Department of Transport and Planning (also representing the Suburban Rail Loop Authority and the Victorian Infrastructure Delivery Authority) do not accept that this recommendation is relevant to them. The Department of Treasury and Finance and all other relevant entities with major projects worth $250 million or more have either accepted in full or accepted in principle. | |
| Finding: Entities are not systematically assessing significant changes’ impact on a project's original cost, time, scope or benefits | ||||
Department of Treasury and Finance
| 4
| Provide more explicit guidance to relevant entities on cost planning, risk management and sensitivity testing before making final investment decisions, and:
| Accepted in principle
| |
5
| Provide more explicit guidance on actions entities need to take after a significant project change, including:
| Accepted in principle
| ||
| Finding: Entities' project benefits measurement systems are not mature, with unclear roles and responsibilities | ||||
Department of Treasury and Finance
| 6
| Provide entities more explicit guidance on how to measure and acquit major projects’ benefits. This includes describing:
| Accepted in full
| |
3. Key themes from our project case studies
We developed 8 major project case studies to give a more focused review to some selected projects.
The 10 major projects we reviewed in our 8 case studies are high cost (over $250 million TEI) or have shown significant cost or time changes during their lifecycle.
Covered in this section:
- How entities publicly report project performance data
- How entities internally report project performance
- How entities assess the impacts from significant project changes
- How entities are measuring and assessing project benefits
Public reporting on major projects
Project cost changes in BP4
In our survey and case study interviews, entities gave us detailed information about budget changes. But they do not provide the same level of detail in their BP4 footnotes.
For example, entities internally reported cost changes for some projects because:
- market demand projections changed
- supply chain costs increased
- project delivery schedules were amended.
But these reasons were not reported in BP4 footnotes.
This means that BP4 footnotes do not always represent accurate and transparent reporting of root cause factors affecting a major project’s performance.
Our 2023 major projects performance reporting assurance review noted that DTF updated its guidance for 2023–24 so entities could provide accurate, complete and well-structured footnotes for capital projects listed in BP4.
DTF's guidance says that if there are changes to a project’s TEI or completion date from the last BP4, the entity should include a footnote to explain why the change happened.
Ten projects in our case studies had a TEI or date change, but 8 projects had not disclosed the full reasons why this change occurred in their BP4 reporting.
These observations show entities are not consistently meeting DTF's footnotes content guidance. DTF advised us that some entities may be meeting the content guidance but this detail is not being published in BP4.
This is because although DTF prepares BP4 for the Treasurer, it is a document produced at the government’s discretion with no format or content requirements set by legislation or ministerial direction. Any content in BP4 is therefore published at the Treasurer’s discretion.
Public reporting
During our review we found meaningful information about project performance, but the information we saw is not publicly available.
We found some public construction updates with useful point-in-time information about disruptions or specific project milestone progress. But other public updates did not discuss known progress challenges or focus on any state-approved changes to a project’s cost and time.
DTF identifies and analyses every 3 months the reasons why projects significantly change, but it does not provide this broader analysis to entities assessed by DTF. Making key elements of this analysis available to entities may help them better understand what challenges are occurring in other major projects and help them avoid future project delivery risks.
Meaningful major projects information
Some major projects give more meaningful public information than others. PPPs have a requirement to publish a detailed project summary, including key contractual terms and value for money considerations, which the Treasurer tables in Parliament and DTF publishes on its website.
Some non-PPP major projects, including major projects that are using an alliance or lump sum procurement model, have similar or higher TEIs compared to recent PPPs. However they do not have the same transparency requirements as PPPs.
Alliance contracting model
An alliance contracting model approach sees the delivery entity and the contractor, designer and other project parties work together to design and construct a project. Parties are required to manage project risks, work together in good faith, act with integrity and make best-for-project decisions.
Alliance model projects do not have the same requirement as PPPs to publicly explain design decisions, contractor selection, project costings, public interest and probity safeguards, and broader value for money considerations. Although alliance projects are expected under national guidelines to develop a final value for money assessment after the project has been fully delivered, this analysis is not usually made public.
All major project contracts must be published on the Buying for Victoria website. But these contracts can sometimes have key commercial terms redacted, and do not explain the project's main attributes in plain English, like PPP summaries do.
Public summaries for non-PPP major projects would improve transparency and accountability. Projects adopting this enhanced disclosure could be defined by having a TEI over $250 million or being identified as a HVHR project.
Project changes analysis
Entities do not specifically analyse how major changes to cost, time and scope impact a project’s benefits and economic viability.
Some projects we examined have been through a detailed economic appraisal to produce a BCR. This allows entities to understand potential economic benefits and a project’s overall value.
Infrastructure Australia independently assessed the BCR for the North East Link (all roads packages) as part of a requirement to get Australian Government funding.
Infrastructure Australia published a 1.3 project BCR in October 2018, based on a $14.87 billion to $15.79 billion nominal cost band for the project. This reflected the state's early proposal and cost assessments from preliminary engineering and design work.
The state government changed some aspects of the project’s design and scope in late 2018. Due to this and other factors, the North East Link packages are now expected to cost $26.21 billion, or $10.42 billion more than what Infrastructure Australia initially analysed.
This means the data Infrastructure Australia used to assess the project’s BCR is no longer accurate.
We saw no evidence that Victorian entities formally reassessed the original BCR or project benefits to reflect the project’s significant changes.
Because this work was not done, there is no way to understand how scope and cost changes impacted the project’s economic viability. It also means that Parliament and the community have no way of knowing the current estimated economic benefit from the project.
Internal reporting on major projects
DTF’s analysis and reporting
During our case studies work, we also analysed examples of DTF's project assurance advice to government and entities. We found DTF’s work:
- was relevant to the project
- was developed by review teams with appropriate expertise
- focused on high-risk matters that could impact a project's delivery
- allowed for wider insights and lessons learnt analysis across the major projects portfolio.
DTF provides comprehensive major projects performance advice to ministers every 3 months. This advice is confidential and not intended for the public. Only project-specific observations are distributed to major projects delivery teams.
DTF recently implemented an online data management and analytics tool to streamline its quarterly data collection. DTF told us this improved the analysis reporting timeline to within one month of the end of quarter.
We identified instances before this where ministers did not formally consider DTF’s quarterly advice until months after the advice was lodged.
DTF told us a delay between advice lodgement and formal consideration did not necessarily mean the advice was not useful. This is because the detailed project analysis, once approved and lodged, is available to central agencies, senior DTF officers and the Treasurer's office.
Project assurance systems
DTF's project assurance processes, such as HVHR and gateway, give useful, practical advice to senior project leaders. HVHR processes apply to 77 of the 113 projects we reviewed.
Larger and more complex projects, like the Suburban Rail Loop East or North East Link, have worked with DTF to develop a modified HVHR and gateway review implementation approach.
This includes using PARs at key lifecycle points to give project leaders focused, timely advice and improvement recommendations.
HVHR project progress RAG ratings
All HVHR projects are captured in DTF’s quarterly reviews sent to ministers. According to BP4, HVHR projects are subject to additional scrutiny, independent review and government approval processes.
DTF uses RAG ratings to track HVHR projects' progress against their estimated, cost, time and scope.
| If DTF and DPC rate a project ... | then the project’s ... |
|---|---|
| red | scope, schedule, budget or expected benefits are not achievable. |
| amber | scope, schedule, budget or expected benefits are achievable but there are significant issues that require attention. |
| green | scope, schedule, budget or expected benefits are on track. |
Project assurance systems
The Budget papers usually disclose which projects have been classified as HVHR.
Of the 63 projects listed in the most recent BP4, 53 of them are also within the scope of this assurance review. The remaining 10 listed in BP4 are out of our scope because they are either technology or land purchase projects, or a program of works with no sub-project worth $100 million or more.
Seventy-seven (68.1 per cent) of the projects we reviewed were subject to HVHR processes. There are more projects in our selection than listed in BP4 because some projects are sub-packages in the overarching level-crossing removal programs, which is subject to HVHR at a program level.
Sub-packages
A major project can be split into sub-packages or sub-projects, which aim to contribute to the overarching goal. For example, the Level Crossings Removal Program, which is the state government's overarching program to remove level crossings, disaggregates its works into smaller sub-packages to deliver various crossing removals.
Gateway and PARs
Under the HVHR framework, any gateway and PAR red-rated recommendations require the relevant entity to develop a recommendation action plan.
All the case study projects we reviewed are following the agreed or required HVHR steps with available evidence showing that red recommendations are being responded to.
But the available evidence was not always clear about the implementation timeliness of agreed response actions.
DTF tracks these types of recommendations in its quarterly reporting to ministers, but this monitoring status report is not widely available.
Our review of recent monitoring reports showed some action plans were overdue, but these projects were not in our case study selection, so we did not follow up the reason for this delay.
It is not clear whether DTF actively monitors gateway and PAR red-rated recommendations. It is also not clear whether DTF or the relevant entity is responsible for following them up. DTF could clarify this with entities as the major projects oversight body.
Assessing significant project changes' impacts
Market volatility
Construction market volatility in recent years has had a significant impact on some project budgets. Some construction market prices are significantly different to early project TEI projections.
DTF advised entities in December 2022 on how to manage unexpected or difficult-to-estimate input cost escalations. This advice noted that:
'volatile input costs can be attributed to a range of factors, including but not limited to the impacts of the coronavirus pandemic, record government investment in infrastructure, the increasing cost of borrowing, global supply chain disruptions, and geopolitical instability'.
Although this advice has now lapsed, the causes of price volatility may still exist, so agencies will still need to closely scrutinise market conditions when estimating project costs.
Value management approaches
We saw evidence of good-practice value management approaches. An entity we examined worked with senior project stakeholders to focus on delivering high-quality outcomes after market prices came in higher than expected.
Other examples of good practice include sequencing sites for construction (construction staging), building basic structures (cold shell fit-outs) and installing supporting infrastructure or works to enable future services and facilities that were currently unfunded.
Other evidence showed a project took a longer-term approach to try and gain value from whole of-life costing by using scope ladders, which are a series of iterative and cumulative scope options and choices.
This exercise allowed the state to better understand the opportunity cost of building in options now rather than trying to retrofit them in the future. This approach allows any current cost implications to be offset by future value outcomes.
Procurement approaches
Some major projects changed their expected procurement approach after an initial funding decision had been made.
This caused some observable impacts. For example, because government policy requires PPP whole-of-life costs to be included, project TEIs are revised upwards if the procurement approach changes from a lump sum contract to a long-term PPP. Changing the procurement approach can also delay project schedules and lead to unexpected cost increases.
When developing project investment cases, entities could also specifically consider desired project procurement approaches to avoid these cost increases.
Project benefits measurement systems and responsibilities
Project benefits measurement systems
We rated all 10 projects in our case studies as amber for project benefits. We saw evidence that entities' project benefits measurement systems are underdeveloped, with unreliable baseline and progress data.
It was also not clear which entity (such as the client entity, end-user entity or the project delivery entity) should measure project benefits, or when.
Project benefits reassessments
Some projects in our case study reviews have had significant TEI changes since they were first approved but entities have not reassessed the project's BCR compared to the BCR originally used to assess economic value.
This means there is a risk the state is proceeding with a project that no longer provides a net economic benefit and runs the risk of wasting scarce public money.
This contrasts to our survey, which asked a question about whether entities have a process to recalculate any changes to project benefits due to a significant scope change. Of the selected 113 major projects, 101 (89.38 per cent) said 'Yes'.
This means that entities believe they have a process to recalculate project benefits.
Entities’ project benefit roles
Benefit management plans (BMP) we examined were not always clear about which entity will measure longer-term benefits.
Some benefits measurement approaches, especially for less tangible and long-term economic outcomes, were vague and tended to rely on data that third parties might collect in the future, rather than data that the sponsoring entity, or final asset user would take responsibility for.
DTF's gateway guidance discusses the importance of collecting sufficient baseline and progress data so that a useful benefits assessment can be made after the project has become operational. The guidance expects this assessment (Gate 6: Benefits realisation) to occur some 6–12 months after the project is complete.
The guidance also says that benefits measurement should occur throughout the project lifecycle and take account of the original benefits expected and specified at the investment case stage.
4. Exploring major projects performance data
The Victorian Government's spending on major projects has increased each year for the last decade. It is important that Parliament and the community have transparent and meaningful information about project progress so they can hold government and public entities accountable for their projects’ performance.
The 113 major projects we examined are worth $145.5 billion in total. There are 9 new projects, 91 existing projects and 13 completed projects. Three of these projects did not have a confirmed TEI.
Covered in this section:
- Investment in major projects compared to 2023
- Cost and number of projects across sectors
- Changes to projects’ cost, time and scope
- Major project stages and procurement models.
Major projects spending
Major projects reporting
The Treasurer reports to Parliament on major projects’ status on Budget day.
DTF prepared the 2024–25 BP4 for the Treasurer. It shows the Victorian public sector is spending $208 billion on capital projects. This amount:
- is $7.85 billion more than the $200.63 billion reported in 2023–24
- includes $12.36 billion invested in new projects, compared to the $27.52 billion allocated to new projects in 2023–24.
High-cost major projects
Out of 113 major projects we examined, 21 projects cost over $1 billion.
The transport sector has 7 major projects worth over $5 billion.
TEI distribution across sectors
Major projects TEI distribution is shown in Figure 1.
Transport has the largest TEI share, making up 83 per cent of all examined major project investments. Major transport projects’ TEI are substantially higher than other sectors.
Figure 1: Total major projects TEI distribution across project sectors ($ billion)
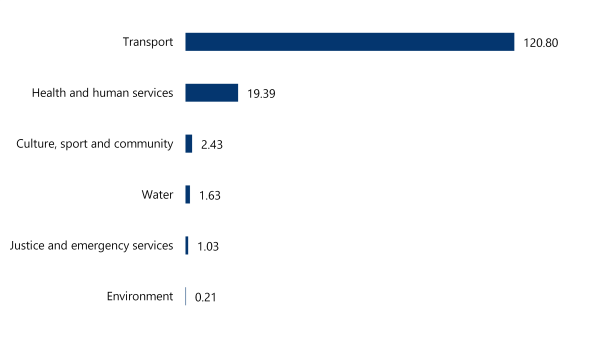
Note: This shows a sector-level overview of reviewed major projects disclosed in the 2024–25 BP4. See Appendix G for information on our survey data, including funding sources.
Source: VAGO.
Project distribution across sectors
Figure 2 shows the transport sector has the most projects (56.6 per cent), followed by health and human services.
Of the 64 transport sector projects, 7 make up $84.05 billion (69.6 per cent) of the sector's TEI.
Figure 2: Major projects distribution across project sectors
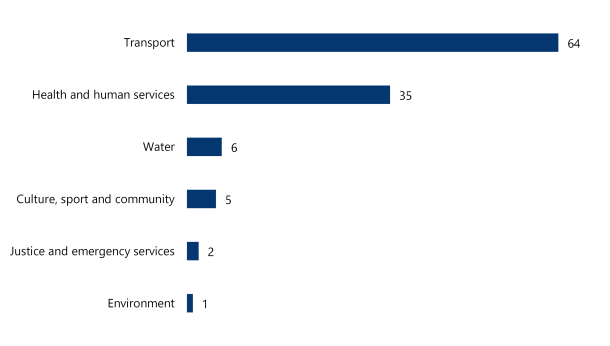
Source: VAGO.
HVHR projects
DTF uses a risk assessment tool to determine if a project is HVHR. According to the Budget papers, HVHR projects go through rigorous scrutiny, independent review and approval processes.
There are 63 HVHR projects listed in the latest BP4.
Entities identified 77 (68.1 per cent) of the 113 projects we examined as HVHR. Our selection has more HVHR projects because some are wider programs' sub-packages that are subject to HVHR.
Transport has the most HVHR projects compared to other sectors, followed by health and human services.
Water sector projects are not included in DTF’s quarterly ministerial reports unless they have been specifically designated as HVHR. There are no HVHR water sector projects at present.
Figure 3: HVHR projects by sector
| Sector | HVHR projects | Total major projects |
|---|---|---|
| Culture, sport and community | 4 | 5 |
| Environment | 0 | 1 |
| Health and human services | 22 | 35 |
| Justice and emergency services | 2 | 2 |
| Transport | 49 | 64 |
| Water | 0 | 6 |
| All sectors | 77 | 113 |
Source: VAGO, using entities’ self-certified data.
Entities' self-assessment
We asked entities to self-assess their projects' current performance against cost, time, scope and benefits.
Appendix E lists the criteria we asked entities to use for self-assessment and provides a historical record of major projects’ ratings over the last 3 years.
This year we introduced a new project benefits self-assessment with questions about benefits management systems. We also asked how entities collect and share lessons learnt.
Most entities said their projects are on time, in scope, within budget and have well-developed benefits measurement systems. Time and cost were identified as the biggest challenges to project performance.
The Suburban Rail Loop – Airport major project is marked as not available because the responsible entity did not provide a self-assessment rating. This is because the project is currently paused.
Figure 4: Entities' self-assessment ratings
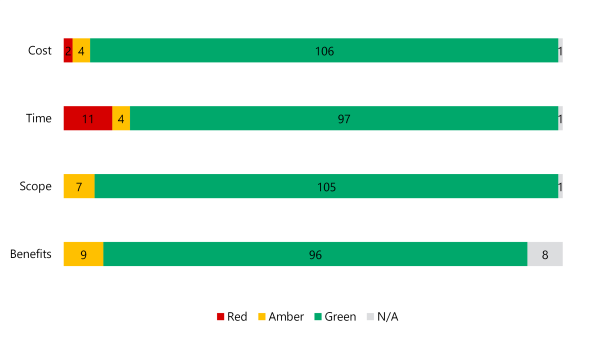
Source: VAGO.
Cost changes
All sectors except for justice and emergency services reported an increase in their total TEI, as shown in figures 5 and 6.
Transport reported the highest total TEI increase ($8.5 billion). This represents a 7.57 per cent change, the second-lowest percentage change across all sectors, because of transport’s substantially higher $120.8 billion total TEI. The environment and water sectors had much smaller TEI changes.
The justice and emergency services sector reported a TEI decrease. BP4 footnotes say this is ‘due to budgeted amounts being reclassified as operating instead of capital expenditure, in line with accounting standards’.
Figure 5: TEI increases or decreases by project sector ($ million)
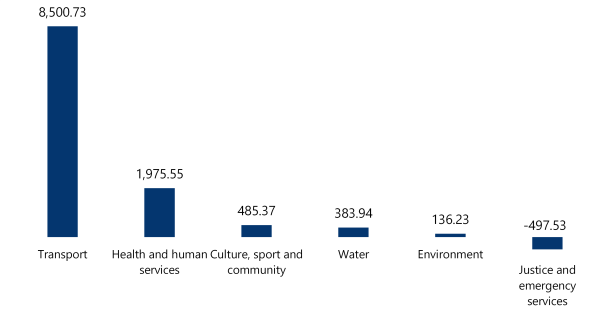
Source: VAGO.
Figure 6: Total TEI percentage change by sector
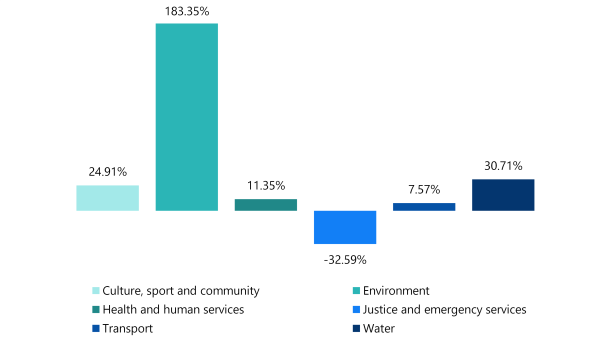
Note: The environment sector has the highest TEI percentage change driven by its sole project, the Suburban Parks Program. BP4 footnotes attribute the increase in TEI to meeting forecast capital costs for land acquisition and parkland establishment.
Source: VAGO.
Case study 1: TEI percentage change in the environment sector
Suburban Parks Program
The environment sector has the highest TEI percentage change in its only major project, the Suburban Parks Program (SPP).
The SPP aims to create and develop up to 6,500 hectares of parkland, walking and cycling trails, pocket parks and dog parks.
The SPP first appeared in the 2019–20 BP4 with a $74.30 million TEI. There have been 2 increases in TEI over this project’s life.
In the 2022–23 BP4, the TEI increased to $191.69 million to pay for compulsory land acquisition costs for large regional parks and other park expansions. The Department of Energy, Environment and Climate Action told us this was due to limited take-up of voluntary land purchase options.
The TEI increased again in the 2024–25 BP4 to $210.53 million, reflecting revised project costings.
The SPP's timelines have been extended from 2025 to 2026.
Source: VAGO.
Significant time changes
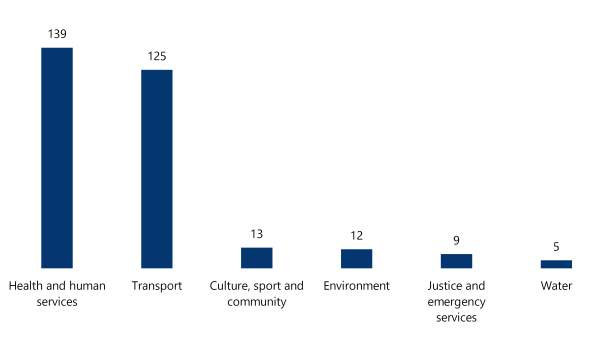
Figure 7 shows that all sectors reported changes to project completion dates.
The health and human services sector reported the most delays, with 14 projects not meeting their original estimated completion dates.
Figure 7: Delays to project schedules by sector (quarters)
Note: Our time change analysis excluded projects with zero and TBC values.
Source: VAGO.
Figure 8 shows the number of delayed major projects by sector.
The transport sector reported 18 of its 64 projects as not meeting original completion dates. The main impact of this delay is that expected project benefits are also delayed.
Figure 8: Delayed projects by sector
| Sector | Total projects | Delayed projects |
|---|---|---|
| Environment | 1 | 1 |
| Justice and emergency services | 2 | 2 |
| Culture, sport and community | 5 | 3 |
| Health and human services | 35 | 14 |
| Water | 6 | 2 |
| Transport | 64 | 18 |
| All sectors | 113 | 40 |
Note: Our time change analysis excluded projects with zero and TBC values.
Source: VAGO.
Significant scope changes
We found 32 of the 113 reviewed projects (28 per cent) had at least one significant scope change. A significant scope change is a change that requires ministerial or government approval.
Figure 9 shows there are 12 projects that have had 2 or more significant scope changes. One project reported 4 significant scope changes.
In 4 projects, the change was due to the state government approving additional scope. For example, the Frankston Hospital redevelopment added a multistorey car park and 2 new emergency department initiatives.
Figure 9: Major projects with 2 or more significant scope changes
| Project | Sector | Significant scope changes |
|---|---|---|
| Next Generation Trams | Transport | 4 |
| Ballarat Health Services expansion and redevelopment and the new Central Energy Plant (Ballarat) | Health and human services | 3 |
| Building a world class hospital for Frankston families (Frankston) | Health and human services | 3 |
| State Basketball Centre redevelopment (Knox) | Culture, sport and community | 3 |
| Men's prison system capacity (statewide) | Justice and emergency services | 2 |
| 85 by 2025 (Level Crossing Removal) (metropolitan various) | Transport | 2 |
| Arden Precinct Redevelopment (metropolitan) | Transport | 2 |
| Car Parks for Commuters (statewide) | Transport | 2 |
| Hurstbridge Line Upgrade Stage 2 (metropolitan various) | Transport | 2 |
| Metro Tunnel (metropolitan various) | Transport | 2 |
| Murray Basin Rail Project (regional various) | Transport | 2 |
| North East Link – Primary Package (Tunnels) and State Tolling Corporation (Greensborough) | Transport | 2 |
Source: VAGO.
Project stages
Most major projects we surveyed are in delivery/under construction.
Figure 10: Major projects' stages by sector
| Project stage | Culture, sport and community | Environment | Health and human services | Justice and emergency services | Transport | Water | Total |
|---|---|---|---|---|---|---|---|
| Feasibility study/planning | 2 | 1 | 3 | ||||
| Business case development | 1 | 1 | 2 | ||||
| Early works/pre-procurement | 5 | 2 | 7 | ||||
| Request for proposal | 1 | 1 | |||||
| Procurement process | 4 | 3 | 7 | ||||
| Contract negotiation | 2 | 2 | |||||
| In delivery/under construction | 3 | 1 | 17 | 2 | 47 | 6 | 76 |
| Practical completion | 4 | 7 | 11 | ||||
| Post-practical completion | 2 | 1 | 1 | 4 |
Source: VAGO.
Project business cases
Preparing a business case is the first stage of planning a project. DTF describes business cases as an opportunity for an entity to conceptualise a project and demonstrate that it is worth doing.
DTF requires any public sector (except for water sector) project costing more than $10 million to develop a business case, an investment logic map (ILM) and a BMP. All non-water sector major projects subject to this review are required to produce these documents, unless formally exempted.
Water sector projects have similar requirements. The Treasurer scrutinises projects at certain project value and decision points that are specific to the various water corporations. An external regulator also examines and approves capital expenditure as part of a water tariff pricing process.
Investment lifecycle documents
Figure 11 shows that 94 of 103 major projects we looked at (or 91.3 per cent) have a business case.
Our sample size for this analysis is 103 major projects because we excluded some individual level crossing removal sub-packages that assert they rely on a program-level business case. We have not seen these program-level business cases and responses to our survey for the 2 overarching level crossing removal programs said they did not have one. The Victorian Infrastructure Delivery Authority (VIDA) told us that the subsequent level crossing removal programs do not need business cases because they apply the first program business case approved in 2017, which was initially developed for the first 50 level crossing removals.
The 9 major projects without business cases either have a similar document to a business case, are currently on track to developing one, or are not required to produce one.
For these 9 projects:
- one is a program of works and does not have any investment lifecycle documents because the Crisis Council of Cabinet approved it as part of the COVID-19 response
- one used a Cabinet submission instead of a business case
- one is part of a wider enhancement project and is included in another project business case
- one did ‘not have a high enough value to trigger the requirement for a business case’, according to the responsible entity
- 2 are the overarching level crossing removal programs
- 3 are currently either in the funding submission stage or are developing a business case. This means either early funding has been given to support the project’s planning and development, or the government approved the project in principle but requires more planning or justification for a final funding decision.
Some projects have a selection of required documents and similar alternative documents.
Figure 11: Major projects with a business case, BMP and ILM documents
| Document | Number of projects |
|---|---|
| Business case | 94 (91.3%) |
| BMP | 91 (88.3%) |
| ILM | 91 (88.3%) |
Note: We have not counted separate level crossing removal projects on a statistical basis.
Source: VAGO.
Procurement models
Figure 12 shows that 30 of the 113 major projects (26.5 per cent), all in the transport sector, use an alliance contracting model.
Appendix F provides detailed definitions on procurement models.
The second most common procurement method, excluding other and multiple approaches, is design and construct with 14 projects (12.4 per cent). All sectors use the design and construct approach.
The transport and health and human services sectors have the most variety of procurement methods.
Multiple approaches is when a sector uses more than one type of procurement model for a project. For example, a project can use both a design and construct and a managing contractor model for different project or sub-project stages.
Eight health and human services projects use the multiple approaches procurement model. In the transport sector, 7 projects use this model with survey responses noting there are multiple workstreams requiring different delivery approaches.
Only the transport and health and human services sectors selected the 'not yet decided' response for procurement model choice, with 9 projects in this category.
Figure 12: Procurement models used
| Procurement model | Culture, sport and community | Environment | Health and human services | Justice and emergency services | Transport | Water | Total |
|---|---|---|---|---|---|---|---|
| Alliance contracting | 30 | 30 | |||||
| Competitive tender | 1 | 1 | |||||
| Construct only | 5 | 5 | |||||
| Design and construct | 2 | 2 | 6 | 4 | 14 | ||
| Managing contractor | 2 | 6 | 1 | 1 | 10 | ||
| Multiple approaches | 1 | 8 | 1 | 7 | 17 | ||
| Not yet decided | 7 | 2 | 9 | ||||
| Other | 2 | 15 | 1 | 18 | |||
| PPP | 1 | 5 | 3 | 9 |
Source: VAGO.
TEI change by procurement models
Figure 13 shows the median TEI change for each procurement model used. The PPP model has the highest median TEI change.
PPP projects often change their TEIs after contracts are finalised due to their complex financing structures and accounting treatments. There is also a policy requirement that full lifecycle costs are reflected in approved project costs.
Figure 13: TEI change by procurement model
| Procurement model | Number of projects | Maximum TEI change | Median TEI change | Minimum TEI change |
|---|---|---|---|---|
| Alliance contracting | 30 | 302.6% | 0.0% | −3.7% |
| Competitive tender | 1 | Not applicable | −3.3% | Not applicable |
| Construct only | 5 | 15.0% | 3.0% | 0.0% |
| Design and construct | 14 | 64.8% | 0.1% | −2.9% |
| Managing contractor | 10 | 36.1% | 10.5% | 0.0% |
| Multiple approaches | 17 | 183.4% | 0.0% | −39.9% |
| Not yet decided | 9 | 151.1% | 0.0% | 0.0% |
| Other | 18 | 306.8% | 12.0% | 0.0% |
| PPP | 9 | 218.1% | 60.1% | −10.3% |
Source: VAGO.
Appendix A: Submissions and comments
Download a PDF copy of Appendix A: Submissions and comments.

Appendix B: Abbreviations, acronyms and glossary
Download a PDF copy of Appendix B: Abbreviations, acronyms and glossary.
Appendix C: Review scope and method
Appendix D: Major project case studies
Download a PDF copy of Appendix D: Major project case studies.
Appendix E: Project self-assessments 2021–22 to 2024–25
Download a PDF copy of Appendix E: Project self-assessments 2021–22 to 2024–25.
Appendix F: Procurement model definitions
Download a PDF copy of Appendix F: Procurement model definitions.
Appendix G: Data sources used in this review
Download a PDF copy of Appendix G: Data sources used in this review.